Paper Menu >>
Journal Menu >>
 Engineering, 2010, 2, 710-719 doi:10.4236/eng.2010.29092 Published Online September 2010 (http://www.SciRP.org/journal/eng) Copyright © 2010 SciRes. ENG Optimization of Biodynamic Seated Human Models Using Genetic Algorithms Wael Abbas1*, Ossama B. Abouelatta2, Magdi El-Azab3, Mamdouh Elsaidy4, Adel A. Megahed5 1Engineering Physics and Mathematics Department, Faculty of Engineering (Mataria), Helwan University, Cairo, Egypt 2Production Engineering and Mechanical Design Department, Faculty of Engineering, Mansoura University, Mansoura, Egypt 3,4Mathematics and Engineering Physics Department, Faculty of Engineering, Mansoura University, Mansoura, Egypt 5Mathematics and Engineering Physics Department, Faculty of Engineering, Cairo University, Cairo, Egypt E-mail: wael_abass@hotmail.com Received May 16, 2010; revised July 21, 2010; accepted August 4, 2010 Abstract Many biodynamic models have been derived using trial and error curve-fitting technique, such that the error between the computed and measured biodynamic response functions is minimum. This study developed a biomechanical model of the human body in a sitting posture without backrest for evaluating the vibration transmissibility and dynamic response to vertical vibration direction. In describing the human body motion, a three biomechanical models are discussed (two models are 4-DOF and one model 7-DOF). Optimization software based on stochastic techniques search methods, Genetic Algorithms (GAs), is employed to deter- mine the human model parameters imposing some limit constraints on the model parameters. In addition, an objective function is formulated comprising the sum of errors between the computed and actual values (ex- perimental data). The studied functions are the driving-point mechanical impedance, apparent mass and seat- to-head transmissibility functions. The optimization process increased the average goodness of fit and the results of studied functions became much closer to the target values (Experimental data). From the optimized model, the resonant frequencies of the driver parts computed on the basis of biodynamic response functions are found to be within close bounds to that expected for the human body. Keywords: Biodynamic Response, Seated Human models, Simulation, Genetic algorithms 1. Introduction Recently, many people have focused their attention on the ride quality of vehicle which is directly related to driver fatigue, discomfort, and safety. As traveling in- creases, the driver is more exposed to vibration mostly originating from the interaction between the road and vehicle. Whole-body vibration occurs in transportation and when near heavy machinery [1]. The vibrations cause the operator’s whole body to vibrate, as opposed to just one part of their body, says their hand or foot. Harm- ful effects of whole-body vibration are experienced when the exposure time is longer than the recommended stan- dard set by ISO 2631-1 [2]. Biodynamic responses of seated human occupant ex- posed to vibration have been widely characterized to define frequency-weightings for assessment of exposure, to identify human sensitivity and perception of vibration, and to develop seated body models [3]. The biodynamic response of the human body exposed to vibration have been invariably characterized through measurement of force motion relationship at the point of entry of vibra- tion “To-the-body response function”, and transmission of vibration to different body segments “Through-the- body response function”. Considering that the human body is a complex biological system, the “To-the-body” response function is conveniently characterized through non-invasive measurements at the driving point alone. The vast majority of the reported studies on biodynamic response to whole-body vibration have considered vibra- tion along the vertical axis alone. The reported studies on biodynamic responses under  W. ABBAS ET AL. Copyright © 2010 SciRes. ENG 711 vertical vibration are thoroughly reviewed, specifically their response characteristics, experimental conditions, and the measured data. The biodynamic response char- acteristics reported in terms of either the driving-point me- chanical impedance (DPMI) or apparent mass (APMS), and the seat-to-head transmissibility (STHT) are classi- fied under different experimental conditions used in the study. In early studies, various biodynamic models have been developed to depict human motion from single-DOF to multi-DOF models. These models can be divided as dis- tributed (finite element) models, lumped parameter mod- els and multi-body models. The distributed model treats the spine as a layered structure of rigid elements, repre- senting the vertebral bodies, and deformable elements representing the intervertebral discs by the finite element method. Multi-body human models are made of several rigid bodies interconnected by pin (two-dimensional) or ball and socket (three-dimensional) joints, and can be further separated into kinetic and kinematic models. The lumped parameter models consider the human body as several rigid bodies and spring-dampers. This type of model is simple to analyze and easy to validate with experiments. However, the disadvantage is the limitation to one-directional analysis. Coermann [4], measured the driving-point impedance of the human body and suggested 1-DOF model. Suggs et al. [5] de- veloped a 2-DOF human body. It was modeled as a damped spring-mass system to build a standardized ve- hicle seat testing procedure. A 3-DOF analytical model for a tractor seat suspension system is presented by Te- wari et al. [6]. It was observed that the model could be employed as a tool in selection of optimal suspension parameters for any other type of vehicles. Boileau et al. [7] used an optimization procedure to establish a 4-DOF human model based on test data. In addition, Zong and Lam [8] validated a 4-DOF nonlinear model originating from Liu et al. [9]. Furthermore, Muksian and Nash [10] presented a 6- DOF nonlinear model dedicated to the analysis of vibra- tion imposed on a seated human. This model was modi- fied by Patil et al. [11], who suggested a 7-DOF model. This model was further incorporated with a tractor model to evaluate vibration responses of an occupant-tractor system. A complete study on lumped-parameter models for seated human under vertical vibration excitation has been carried out by Liang and Chiang [12], based on analytical study and experimental validation. On the other hand, GA optimization is used by Bau- mal et al. [13] to determine both active control and pas- sive mechanical parameters of a vehicle suspension sys- tem, to minimize the extreme acceleration of the passen- ger’s seat, subjected to constraints representing the re- quired road holding ability and suspension working space. The GA is used to solve the problem and results were compared to those obtained by simulated annealing technique and found to yields similar performance mea- sures. It is clear that the lumped-parameter model is probably one of the most popular analytical methods in the study of biodynamic responses of seated human subjects, though it is limited to one-directional analysis. However, vertical vibration exposure of the driver is our main con- cern. Therefore, this paper carries out a thorough survey of literature on the lumped-parameter models for seated human subjects exposed to vertical vibration. This work aims to develop a biomechanical model of the human body in a sitting posture without backrest for evaluating the vibration transmissibility and dynamic response to vertical vibration direction. 2. Biodynamic Response of the Human Body The biodynamic response of a seated human body ex- posed to whole-body vibration can be broadly catego- rized into two types. The first category “To-the-body” force motion interrelation as a function of frequency at the human-seat interface, expressed as the driving-point mechanical impedance or the apparent mass. The second category “Through-the-body” response function, gener- ally termed as seat-to-head transmissibility for the seated occupant. The DPMI relates the driving force and resulting ve- locity response at the driving point (the seat-buttocks interface), and is given by [3]: () () () () () F jFj Zj Vj X j (1) where, () Z j is the complex DPMI, () F j and ()Vj or () X j are the driving force and response velocity at the driving point, respectively. is the an- gular frequency in rad/s , and j = 1 is the complex phasor. In a similar manner, the apparent mass response re- lates the driving force to the resulting acceleration re- sponse, and is given by [14]: () () () F j APMS jaj (2) where, ()aj is the acceleration response at the driv- ing point. The magnitude of APMS offers a simple physical interpretation as it is equal to the static mass of the human body supported by the seat at very low fre- quencies, when the human body resembles that of a rigid 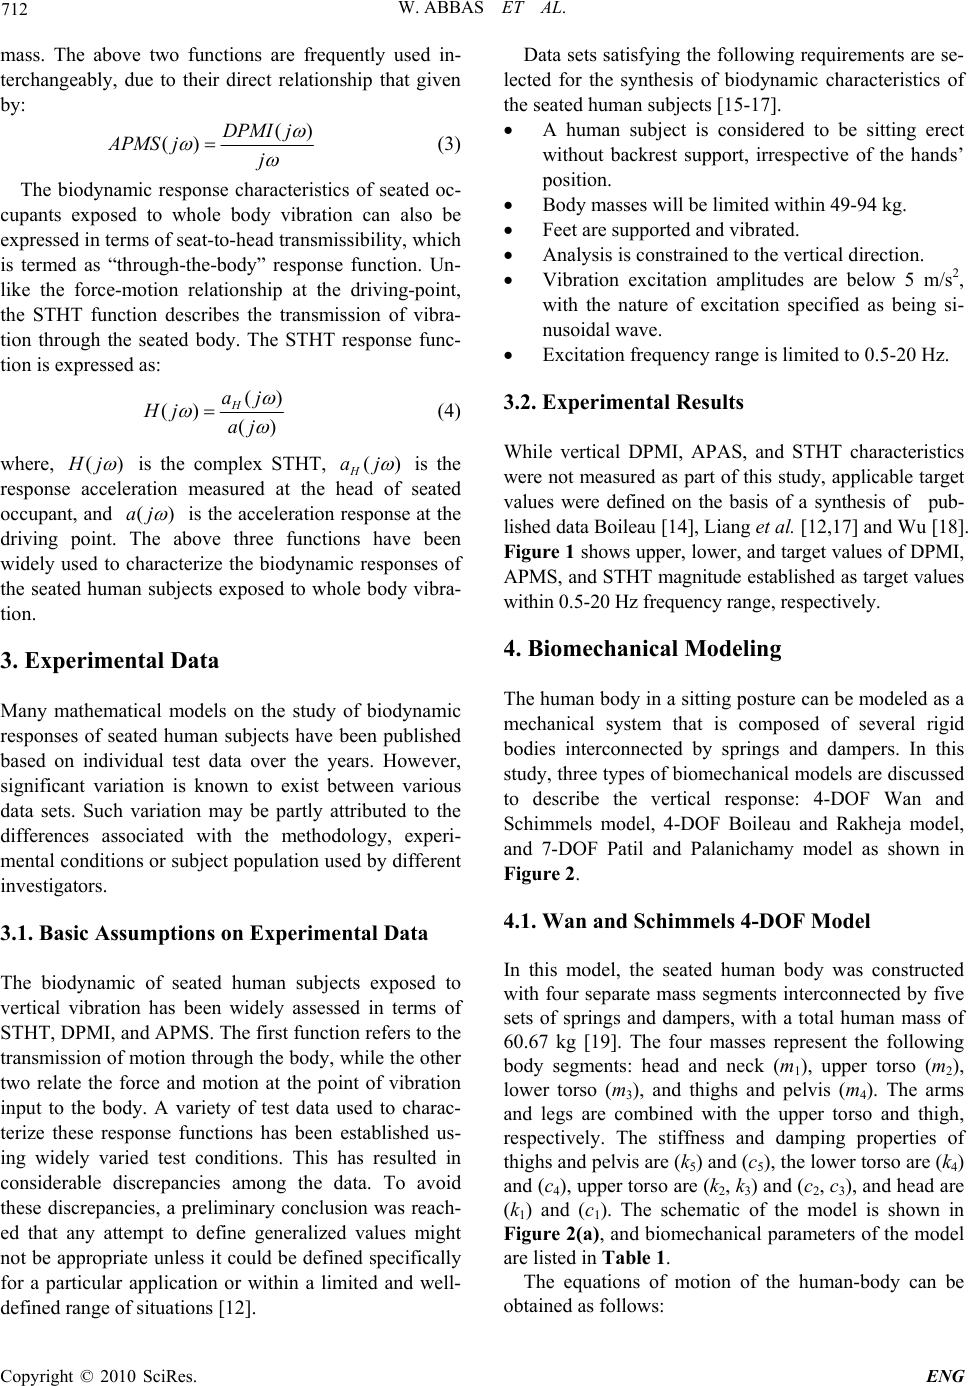 W. ABBAS ET AL. Copyright © 2010 SciRes. ENG 712 mass. The above two functions are frequently used in- terchangeably, due to their direct relationship that given by: () ()DPMI j APMS jj (3) The biodynamic response characteristics of seated oc- cupants exposed to whole body vibration can also be expressed in terms of seat-to-head transmissibility, which is termed as “through-the-body” response function. Un- like the force-motion relationship at the driving-point, the STHT function describes the transmission of vibra- tion through the seated body. The STHT response func- tion is expressed as: () () () H aj Hj aj (4) where, () H j is the complex STHT, () H aj is the response acceleration measured at the head of seated occupant, and ()aj is the acceleration response at the driving point. The above three functions have been widely used to characterize the biodynamic responses of the seated human subjects exposed to whole body vibra- tion. 3. Experimental Data Many mathematical models on the study of biodynamic responses of seated human subjects have been published based on individual test data over the years. However, significant variation is known to exist between various data sets. Such variation may be partly attributed to the differences associated with the methodology, experi- mental conditions or subject population used by different investigators. 3.1. Basic Assumptions on Experimental Data The biodynamic of seated human subjects exposed to vertical vibration has been widely assessed in terms of STHT, DPMI, and APMS. The first function refers to the transmission of motion through the body, while the other two relate the force and motion at the point of vibration input to the body. A variety of test data used to charac- terize these response functions has been established us- ing widely varied test conditions. This has resulted in considerable discrepancies among the data. To avoid these discrepancies, a preliminary conclusion was reach- ed that any attempt to define generalized values might not be appropriate unless it could be defined specifically for a particular application or within a limited and well- defined range of situations [12]. Data sets satisfying the following requirements are se- lected for the synthesis of biodynamic characteristics of the seated human subjects [15-17]. A human subject is considered to be sitting erect without backrest support, irrespective of the hands’ position. Body masses will be limited within 49-94 kg. Feet are supported and vibrated. Analysis is constrained to the vertical direction. Vibration excitation amplitudes are below 5 m/s2, with the nature of excitation specified as being si- nusoidal wave. Excitation frequency range is limited to 0.5-20 Hz. 3.2. Experimental Results While vertical DPMI, APAS, and STHT characteristics were not measured as part of this study, applicable target values were defined on the basis of a synthesis of pub- lished data Boileau [14], Liang et al. [12,17] and Wu [18]. Figure 1 shows upper, lower, and target values of DPMI, APMS, and STHT magnitude established as target values within 0.5-20 Hz frequency range, respectively. 4. Biomechanical Modeling The human body in a sitting posture can be modeled as a mechanical system that is composed of several rigid bodies interconnected by springs and dampers. In this study, three types of biomechanical models are discussed to describe the vertical response: 4-DOF Wan and Schimmels model, 4-DOF Boileau and Rakheja model, and 7-DOF Patil and Palanichamy model as shown in Figure 2. 4.1. Wan and Schimmels 4-DOF Model In this model, the seated human body was constructed with four separate mass segments interconnected by five sets of springs and dampers, with a total human mass of 60.67 kg [19]. The four masses represent the following body segments: head and neck (m1), upper torso (m2), lower torso (m3), and thighs and pelvis (m4). The arms and legs are combined with the upper torso and thigh, respectively. The stiffness and damping properties of thighs and pelvis are (k5) and (c5), the lower torso are (k4) and (c4), upper torso are (k2, k3) and (c2, c3), and head are (k1) and (c1). The schematic of the model is shown in Figure 2(a), and biomechanical parameters of the model are listed in Table 1. The equations of motion of the human-body can be obtained as follows:  W. ABBAS ET AL. Copyright © 2010 SciRes. ENG 713 111 121 12 221 121 12223 22 332 432 4 332 232 23 434434 444 344343 24 32 4 ()() ()()() ()()() ()() ()() ()()() ( mxc xxkxx mxc xxk xxcxx kx xcx xkx x mxc xxkxx cxxkx x mxcx xkxxcxx kx x 54 54 )( )( ) se se cx xkx x (5) 0 24 6 810 1214 16 18 20 0 0.2 0.4 0.6 0.8 1 1.2 1.4 1.6 Frequency (Hz) STHT :Experimental Upper limit :Experimental Lower limit :Experimental Target value (a) 0 2 4 6810 1214 16 1820 0 500 1000 1500 2000 2500 3000 Frequency (Hz) DPMI (N s/m) :Experimental Upper limit :Experimental Lower limit :Experimental Target value (b) 0 24 6 810 12 14 16 18 2 0 0 500 1000 1500 2000 2500 3000 Frequency (Hz) APMS (kg) :Experimental Upper limit :Experimental Lower limit :Experimental Target value (c) Figure 1. Experimental data of (a) STHT; (b) DPMI; and (c) APMS. (a) (b) (c) Figure 2. Biomechanical models. (a) Wan and Schimmels 4-DOF model; (b) Boileau and Rakheja 4-DOF model; and (c) Patil and Palanichamy 7-DOF model. 4.2. Boileau and Rakheja 4-DOF Model The human-body consists of four mass segments inter- connected by four sets of springs and dampers with a total mass of 55.2 kg [7], as shown in Figure 2(b). The four masses represent the following four body segments: the head and neck (m1), the chest and upper torso (m2), the lower torso (m3), and the thighs and pelvis in contact with the seat (m4). The mass due to lower legs and the feet is not included in this representation, assuming their negligible contributions to the biodynamic response of the seated body. The stiffness and damping properties of 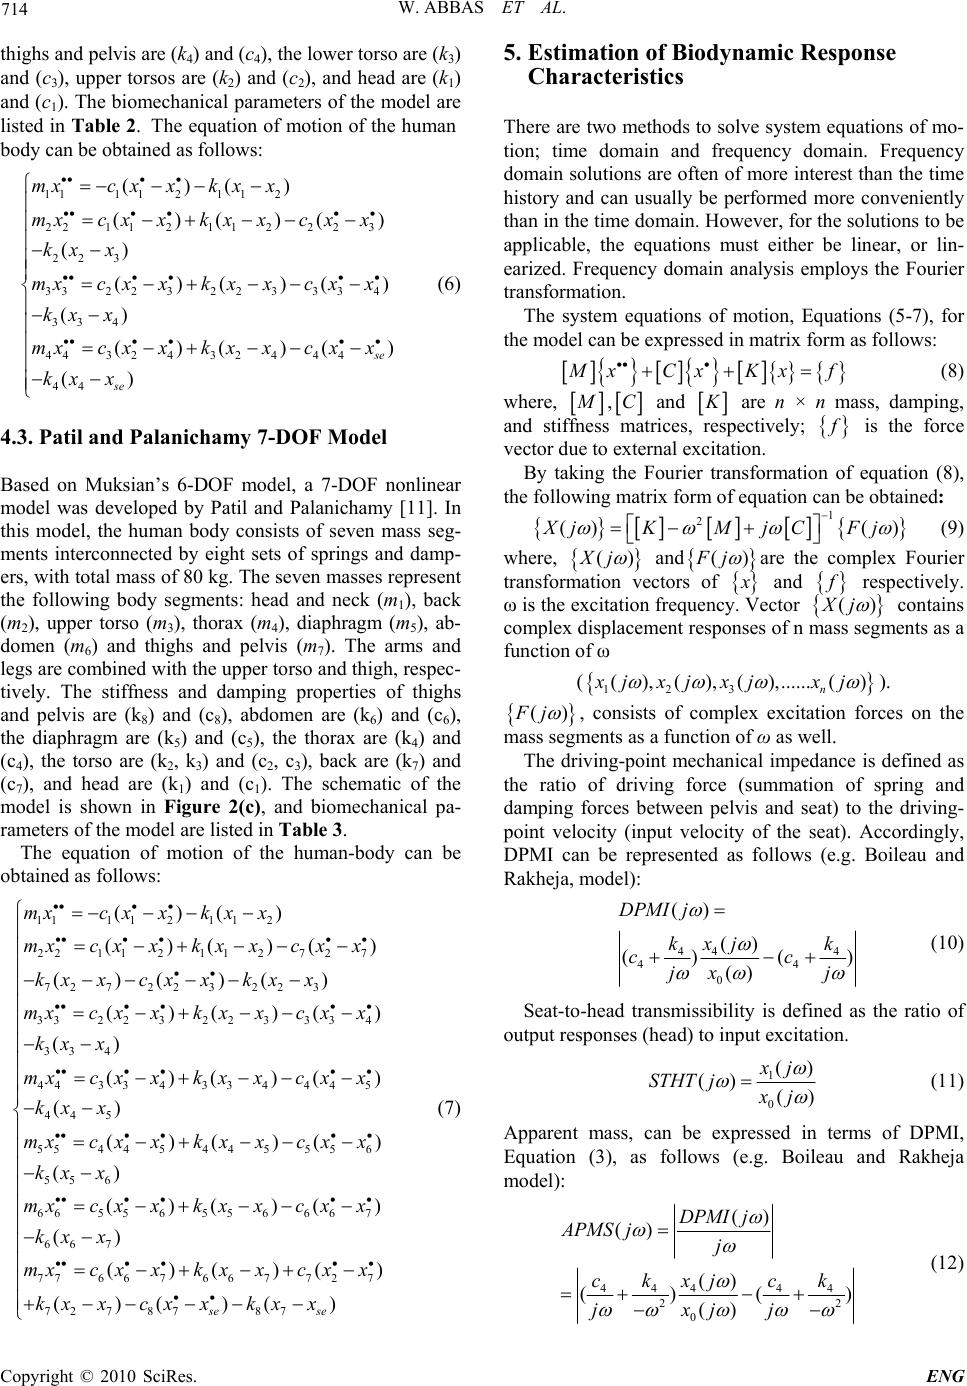 W. ABBAS ET AL. Copyright © 2010 SciRes. ENG 714 thighs and pelvis are (k4) and (c4), the lower torso are (k3) and (c3), upper torsos are (k2) and (c2), and head are (k1) and (c1). The biomechanical parameters of the model are listed in Table 2. The equation of motion of the human body can be obtained as follows: 111 121 12 221 121 12223 22 3 332 232 23334 33 4 443 243 2444 44 ()() ()()() () ()()() () ()()() () s e se mxc xxkxx mxcx xkxxcx x kx x mxcxxkx xcx x kx x mxcx xkx xcx x kx x (6) 4.3. Patil and Palanichamy 7-DOF Model Based on Muksian’s 6-DOF model, a 7-DOF nonlinear model was developed by Patil and Palanichamy [11]. In this model, the human body consists of seven mass seg- ments interconnected by eight sets of springs and damp- ers, with total mass of 80 kg. The seven masses represent the following body segments: head and neck (m1), back (m2), upper torso (m3), thorax (m4), diaphragm (m5), ab- domen (m6) and thighs and pelvis (m7). The arms and legs are combined with the upper torso and thigh, respec- tively. The stiffness and damping properties of thighs and pelvis are (k8) and (c8), abdomen are (k6) and (c6), the diaphragm are (k5) and (c5), the thorax are (k4) and (c4), the torso are (k2, k3) and (c2, c3), back are (k7) and (c7), and head are (k1) and (c1). The schematic of the model is shown in Figure 2(c), and biomechanical pa- rameters of the model are listed in Table 3. The equation of motion of the human-body can be obtained as follows: 111 121 12 221 121 12727 72 722 322 3 332 232 23334 33 4 443343 344 45 445 ()() ()()() ()()() ()()() () ()()() ( mxc xxkxx mxcx xkxxcx x kx xcx xkx x mxcxxkxxcxx kx x mxc xxk xxcxx kx x 554 454 455 56 55 6 665 565566 67 66 7 776 676 67727 72 78787 ) ()()() () ()()() () ()()() ()()( ) sese mxcxxkxxc xx kxx mxcxxk xxc xx kx x mxc xxkxxc xx kx xcx xkx x (7) 5. Estimation of Biodynamic Response Characteristics There are two methods to solve system equations of mo- tion; time domain and frequency domain. Frequency domain solutions are often of more interest than the time history and can usually be performed more conveniently than in the time domain. However, for the solutions to be applicable, the equations must either be linear, or lin- earized. Frequency domain analysis employs the Fourier transformation. The system equations of motion, Equations (5-7), for the model can be expressed in matrix form as follows: M xCxKxf (8) where, M , C and K are n × n mass, damping, and stiffness matrices, respectively; f is the force vector due to external excitation. By taking the Fourier transformation of equation (8), the following matrix form of equation can be obtained: 1 2 () () X jKMjCFj (9) where, () X j and () F j are the complex Fourier transformation vectors of x and f respectively. ω is the excitation frequency. Vector () X j contains complex displacement responses of n mass segments as a function of ω ( 123 ( ),(),( ),......() n x jxjxj xj ). () F j , consists of complex excitation forces on the mass segments as a function of ω as well. The driving-point mechanical impedance is defined as the ratio of driving force (summation of spring and damping forces between pelvis and seat) to the driving- point velocity (input velocity of the seat). Accordingly, DPMI can be represented as follows (e.g. Boileau and Rakheja, model): 44 4 44 0 () () () () () DPMI j kxjk cc jx j (10) Seat-to-head transmissibility is defined as the ratio of output responses (head) to input excitation. 1 0 () () () x j STHTj x j (11) Apparent mass, can be expressed in terms of DPMI, Equation (3), as follows (e.g. Boileau and Rakheja model): 44444 22 0 () () () ()() () DPMI j APMS jj ckxj ck jxjj (12)  W. ABBAS ET AL. Copyright © 2010 SciRes. ENG 715 Table 1. The biomechanical parameters of the Wan and Schimmels model (Before and after optimization). Damping coefficient (N.s/m) Spring constant (N/m) Mass (kg) Before After Before After m1 = 4.17 c1 = 250 c1 =310 k1 = 134400 k1 = 166990 m2 = 15 c2 = 200 c2 =200 k2 = 10000 k2 = 10000 m3 = 5.5 c3 = 909.1 c3 = 909.1 k3 = 192000 k3 = 144000 m4 = 36 c4 = 330 c4 =330 k4 = 20000 k4 = 20000 - c 5 = 2475 c5 =2475 k5 = 49340 k5 =49340 6. Development of Models Many biodynamic models have been derived using trial and error curve-fitting technique, such that the error be- tween the computed and measured biodynamic response functions is minimum. Such curve-fitting methods may lead to a proper fit over a specific frequency range, but rarely provide good results when extended over a broad frequency range. Alternatively, nonlinear programming based optimization techniques may be effectively em- ployed to determine the model parameters, involving the use of a constrained optimization algorithm in conjunc- tion with well defined biodynamic response function [14]. A constrained objective function may be defined to minimize the error between the computed and the target values of specific biodynamic response function over a specific frequency range. Optimization software based on stochastic techniques search methods, Genetic algorithms (GAs), is employed to determine the human model parameters imposing some limit constraints on the model parameters. An ob- jective function is formulated comprising the sum of errors between the computed and of the driving-point mechanical impedance, apparent mass and seat-to-head transmissibility functions. The model thus derived can provide reasonable correlation with the impedance, ap- parent mass and transmissibility characteristics. Starting with an assumed set of model parameters, the differential equations of motion are solved for unit dis- placement excitation to drive the driving-point mechani- cal impedance using Equation (1), apparent mass using Equation (3), and seat-to-head transmissibility using Equation (4). At each iteration of search, the sum of square errors defined by an objective function over the entire frequency range is examined, and the procedure is re-initiated with modified parameter values when the error exceeds that from the previous search. The search is terminated when the computed error approaches the minimum value. 6.1. Objective Function The objective function is selected to comprise the squar- ed sum errors associated with driving-point mechanical impedance 1 ()U apparent mass 2 ()Uand seat-to-head transmissibility functions 3 ()U to minimize the error between the computed and the target values. This study used the classical weighted sum approaches to solve a multi-objective optimization problem as follows: 112 23 3 .( ).().()OBJWUWUWU (13) where, 2 1 1 () (), n iti i UDPMIjDPMIj 2 2 1 () (), n iti i UAPMS jAPMSj 2 3 1 () () n iti i USTHT jSTHTj In the above equations () ti DPMI j , () ti APMS j and () ti STHT j are the target values of driving-point mechanical impedance, apparent mass, and seat-to-head transmissibility, respectively. The target values of DPMI, APMS, and STHT are illustrated in Figure 1. 1 W, 2 W and 3 W are weighting factors to emphasize the relative importance of the terms. The limit constraints are calculated as ±25% variations about the biomechanical parameters of the three models. 6.2. Evaluation of Biodynamic Seated Human Models To evaluate the prediction accuracy of each human mo- del in comparison with experimental results from litera- ture, the ratio of the root-mean-square error to the mean value is calculated with the following equation: Goodness of fit ( ) 2 ()/(2) / ec e N N (14) where e is the test datum, c is the calculated result from each model, and N is the number of test data points used in the comparison. The fit of predicted results to test data is perfect when is equal to 1. The predictions on seat-to-head transmissibility, the driving-point mechani- cal impedance, and apparent mass for each lumped-pa- rameter model will be compared using Equation (14) to obtain prediction accuracy. 7. Results and Discussion 1) Wan and Schimmels modified model The solution of the constrained optimization problem,  W. ABBAS ET AL. Copyright © 2010 SciRes. ENG 716 Equation (5), resulted in an optimized model parameters are listed in Table 1. Figure 3 presents a comparison of the driving-point mechanical impedance, apparent mass, and seat-to-head transmissibility with the target data, respectively. It is obvious that the developed model bet- ter fits target values compared with Wan and Schimmels model. The calculated goodness of fit for seat-to-head transmissibility is 92% compared to 90.9% for Wan and Schimmels model. On the other hand, the developed model matches the target values better with a goodness of fit of 82.1% for 05 10 15 20 0 0.2 0.4 0.6 0.8 1 1.2 1.4 1.6 Frequency (Hz) STHT Wan and Schimmels model ( = 90.9 %) Developed model ( = 92 %) :Wan and Schimmels model :Developed model :Experimental Upper limit :Experimental Lower limit :Experimental Target value (a) 05 10 15 20 0 500 1000 1500 2000 2500 3000 Frequency (Hz) DPMI (N s/m) Wan and Schimmels model ( = 80.1 %) Developed model ( = 82.1 %) :Wan and Schimmels model :Developed model :Experimental Upper limit :Experimental Lower limit :Experimental Target value (b) 05 10 15 20 10 20 30 40 50 60 70 80 90 100 Frequency (Hz) APMS (kg) Wan and Schimmels model ( = 86.8 % ) Developed model ( = 87.1 % ) :Wan and Schimmels model :Developed model :Experimental Upper limit :Experimental Lower limit :Experimental Target value (c) Figure 3. Comparison of biodynamic response characteris- tics for Wan model, and optimized model with the target data. driving-point mechanical impedance and 87.1% apparent mass compared to 80.1% and 86.8%, for Wan and Schimmels model, respectively. In addition, the peak values of the Wan and Schim- mels model occur at 4 Hz for seat-to-head transmissibil- ity, 3.7 Hz for apparent mass, and 7.2 Hz for driving- point mechanical impedance, whereas for the optimized model, they occur at 4.05, 3.8 and 6.9 Hz, respectively. 2) Boileau and Rakheja modified model The solution of the constrained optimization problem, Equation (6), resulted in optimized model parameters which are listed in Table 2. Simulation results are illustrated in Figure 4. This fig- ure presents a comparison of the driving-point mechani- cal impedance, apparent mass and seat-to-head transmis- sibility with the target data, respectively. It is obvious that the optimized model better fits target values than the Boileau and Rakheja model; with a goodness of fit for seat-to-head transmissibility is 80.6%, compared to 76.8% for the Boileau and Rakheja model. In addition, the developed model matches the target values better with a goodness of fit of 84% for driv- ing-point mechanical impedance compared to 80.1% for Boileau and Rakheja model. Optimized model matches the target values better with a goodness of fit of 87% for apparent mass compared to 86.7% for the Boileau and Rakheja model. On the other hand, the peak values of the Boileau and Rakheja model occur at 4.7 Hz for seat-to-head trans- missibility, 4.6 Hz for apparent mass, and 5.5 Hz for driving-point mechanical impedance, whereas for the optimized model, they occur at 4.95, 4.55 and 5.9 Hz, respectively. 3) Patil and Palanichamy modified model In a similar way, the solution of the constrained opti- mization problem, Equation (7), resulted in an optimized of the following model parameters are listed in Table 3. Figure 5 presents a comparison of the driving-point me- chanical impedance, apparent mass, and seat-to-head transmissibility with the target data, respectively. It was observed that the developed model better fits target val- ues compared the Patil and Palanichamy model, with a goodness of fit for seat-to-head transmissibility is 35% compared to 22% for Patil and Palanichamy model. On the other hand, the developed model matches the target values better with a goodness of fit of 13% for driving- point mechanical impedance compared to 1% for Patil and Palanichamy model. The developed model matches the target values with a goodness of fit of 34% for appar- ent mass compared to 0% for Patil and Palanichamy model. 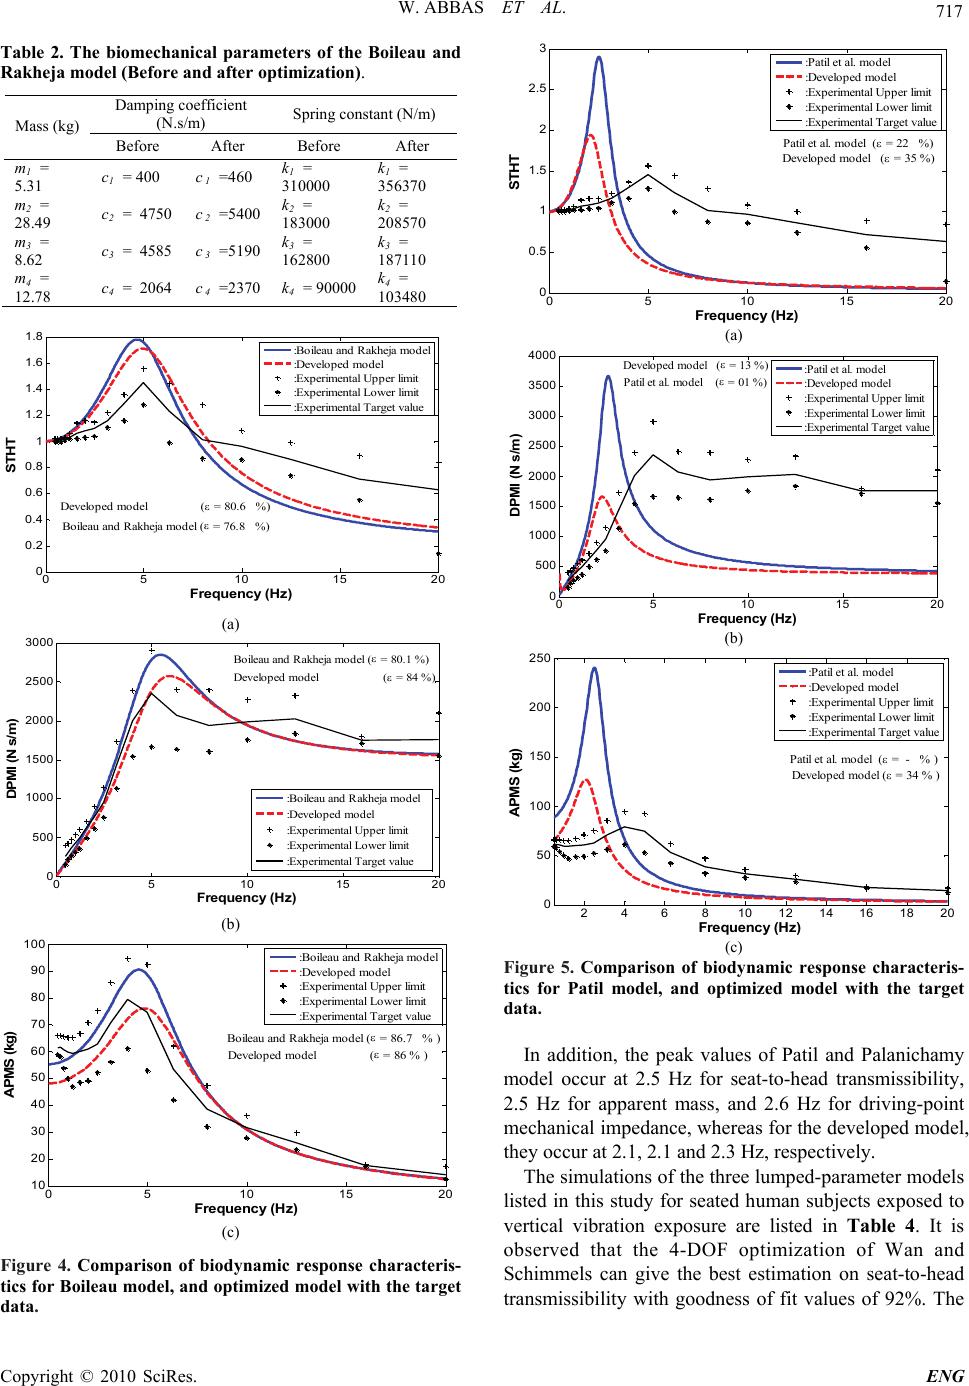 W. ABBAS ET AL. Copyright © 2010 SciRes. ENG 717 Table 2. The biomechanical parameters of the Boileau and Rakheja model (Before and after optimization). Damping coefficient (N.s/m) Spring constant (N/m) Mass (kg) Before After Before After m1 = 5.31 c1 =400 c 1 =460 k1 = 310000 k1 = 356370 m2 = 28.49 c2 = 4750 c 2 =5400 k2 = 183000 k2 = 208570 m3 = 8.62 c3 = 4585 c 3 =5190 k3 = 162800 k3 = 187110 m4 = 12.78 c4 = 2064 c 4 =2370 k4 =90000 k4 = 103480 05 10 15 20 0 0.2 0.4 0.6 0.8 1 1.2 1.4 1.6 1.8 Frequency (Hz) STHT Boileau and Rakheja model ( = 76.8 %) Developed model ( = 80.6 %) :Boileau and Rakheja model :Developed model :Experimental Upper limit :Experimental Lower limit :Experimental Target value (a) 05 10 1520 0 500 1000 1500 2000 2500 3000 Frequency (Hz) DPMI (N s/m) Boileau and Rakheja model ( = 80.1 %) Developed model ( = 84 %) :Boileau and Rakheja model :Developed model :Experimental Upper limit :Experimental Lower limit :Experimental Target value (b) 05 10 15 20 10 20 30 40 50 60 70 80 90 100 Frequency (Hz) APMS (kg) Boileau and Rakheja model ( = 86.7 % ) Developed model ( = 86 % ) :Boileau and Rakheja model :Developed model :Experimental Upper limit :Experimental Lower limit :Experimental Target value (c) Figure 4. Comparison of biodynamic response characteris- tics for Boileau model, and optimized model with the target data. 05 10 15 20 0 0.5 1 1.5 2 2.5 3 Frequency (Hz) STHT Patil et al. model ( = 22 %) Developed model ( = 35 %) :Patil et al. model :Developed model :Experimental Upper limit :Experimental Lower limit :Experimental Target value (a) 05 10 15 20 0 500 1000 1500 2000 2500 3000 3500 4000 Frequency (Hz) DPMI (N s/m) Patil et al. model ( = 01 %) Developed model ( = 13 %):Patil et al. model :Developed model :Experimental Upper limit :Experimental Lower limit :Experimental Target value (b) 2 46 810 12 1416 18 20 0 50 100 150 200 250 Frequency (Hz) APMS (kg) Patil et al. model ( = - % ) Developed model ( = 34 % ) :Patil et al. model :Developed model :Experimental Upper limit :Experimental Lower limit :Experimental Target value (c) Figure 5. Comparison of biodynamic response characteris- tics for Patil model, and optimized model with the target data. In addition, the peak values of Patil and Palanichamy model occur at 2.5 Hz for seat-to-head transmissibility, 2.5 Hz for apparent mass, and 2.6 Hz for driving-point mechanical impedance, whereas for the developed model, they occur at 2.1, 2.1 and 2.3 Hz, respectively. The simulations of the three lumped-parameter models listed in this study for seated human subjects exposed to vertical vibration exposure are listed in Table 4. It is observed that the 4-DOF optimization of Wan and Schimmels can give the best estimation on seat-to-head transmissibility with goodness of fit values of 92%. The 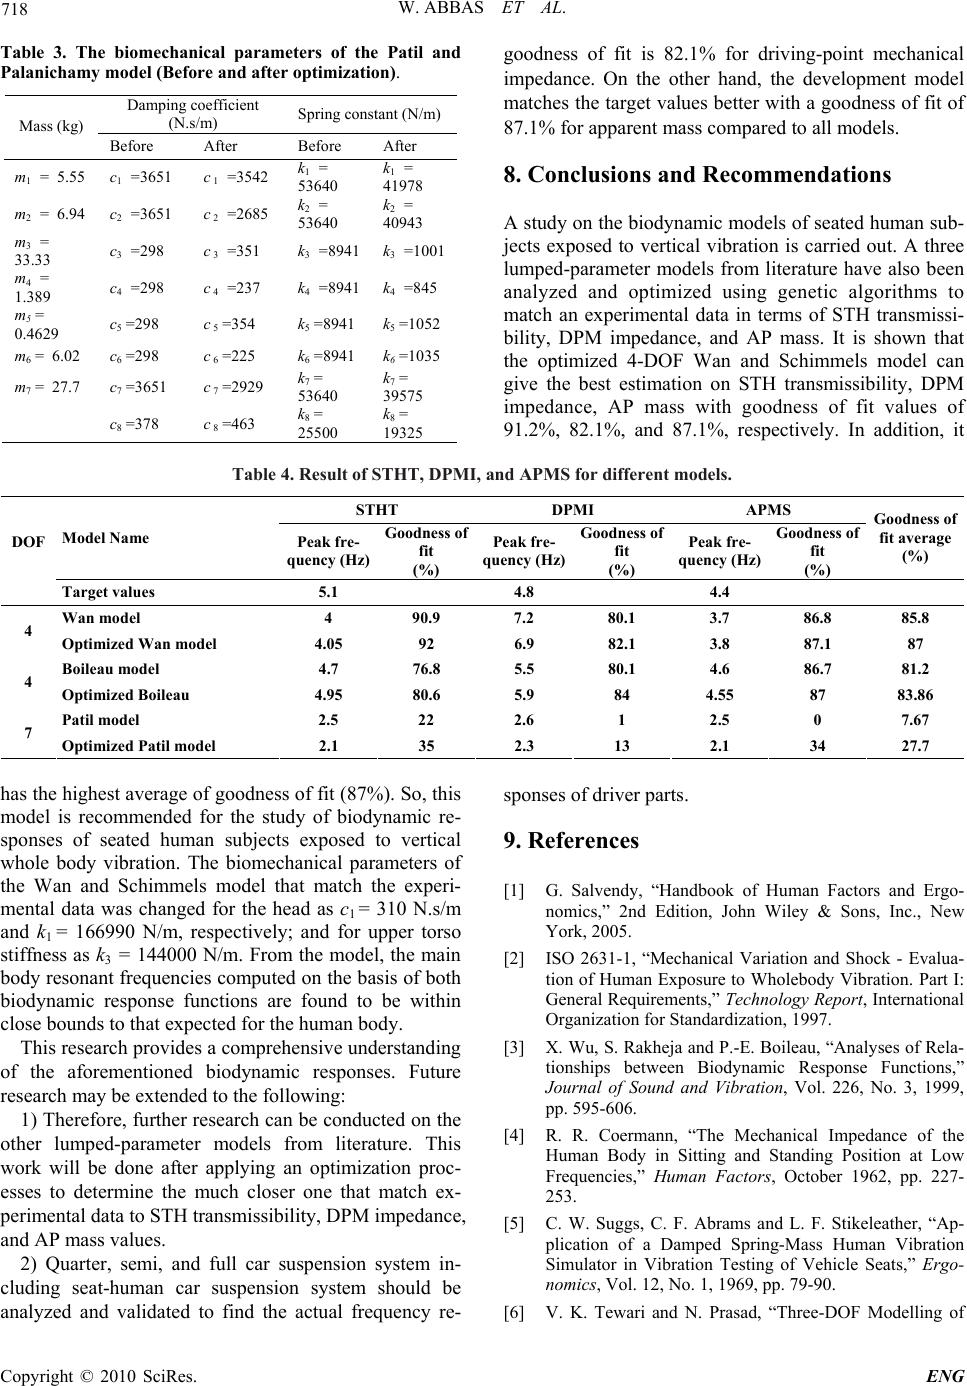 W. ABBAS ET AL. Copyright © 2010 SciRes. ENG 718 Table 3. The biomechanical parameters of the Patil and Palanichamy model (Before and after optimization). Damping coefficient (N.s/m) Spring constant (N/m) Mass (kg) Before After Before After m1 = 5.55 c1 =3651 c 1 =3542 k1 = 53640 k1 = 41978 m2 = 6.94 c2 =3651 c 2 =2685 k2 = 53640 k2 = 40943 m3 = 33.33 c3 =298 c 3 =351 k3 =8941 k3 =1001 m4 = 1.389 c4 =298 c 4 =237 k4 =8941 k4 =845 m5 = 0.4629 c5 =298 c 5 =354 k5 =8941 k5 =1052 m6 = 6.02 c6 =298 c 6 =225 k6 =8941 k6 =1035 m7 = 27.7 c7 =3651 c 7 =2929 k7 = 53640 k7 = 39575 c 8 =378 c 8 =463 k8 = 25500 k8 = 19325 goodness of fit is 82.1% for driving-point mechanical impedance. On the other hand, the development model matches the target values better with a goodness of fit of 87.1% for apparent mass compared to all models. 8. Conclusions and Recommendations A study on the biodynamic models of seated human sub- jects exposed to vertical vibration is carried out. A three lumped-parameter models from literature have also been analyzed and optimized using genetic algorithms to match an experimental data in terms of STH transmissi- bility, DPM impedance, and AP mass. It is shown that the optimized 4-DOF Wan and Schimmels model can give the best estimation on STH transmissibility, DPM impedance, AP mass with goodness of fit values of 91.2%, 82.1%, and 87.1%, respectively. In addition, it Table 4. Result of STHT, DPMI, and APMS for different models. STHT DPMI APMS Model Name Peak fre- quency (Hz) Goodness of fit (%) Peak fre- quency (Hz) Goodness of fit (%) Peak fre- quency (Hz) Goodness of fit (%) Goodness of fit average (%) DOF Target values 5.1 4.8 4.4 Wan model 4 90.9 7.2 80.1 3.7 86.8 85.8 4 Optimized Wan model 4.05 92 6.9 82.1 3.8 87.1 87 Boileau model 4.7 76.8 5.5 80.1 4.6 86.7 81.2 4 Optimized Boileau 4.95 80.6 5.9 84 4.55 87 83.86 Patil model 2.5 22 2.6 1 2.5 0 7.67 7 Optimized Patil model 2.1 35 2.3 13 2.1 34 27.7 has the highest average of goodness of fit (87%). So, this model is recommended for the study of biodynamic re- sponses of seated human subjects exposed to vertical whole body vibration. The biomechanical parameters of the Wan and Schimmels model that match the experi- mental data was changed for the head as c1 = 310 N.s/m and k1 = 166990 N/m, respectively; and for upper torso stiffness as k3 = 144000 N/m. From the model, the main body resonant frequencies computed on the basis of both biodynamic response functions are found to be within close bounds to that expected for the human body. This research provides a comprehensive understanding of the aforementioned biodynamic responses. Future research may be extended to the following: 1) Therefore, further research can be conducted on the other lumped-parameter models from literature. This work will be done after applying an optimization proc- esses to determine the much closer one that match ex- perimental data to STH transmissibility, DPM impedance, and AP mass values. 2) Quarter, semi, and full car suspension system in- cluding seat-human car suspension system should be analyzed and validated to find the actual frequency re- sponses of driver parts. 9. References [1] G. Salvendy, “Handbook of Human Factors and Ergo- nomics,” 2nd Edition, John Wiley & Sons, Inc., New York, 2005. [2] ISO 2631-1, “Mechanical Variation and Shock - Evalua- tion of Human Exposure to Wholebody Vibration. Part I: General Requirements,” Technology Report, International Organization for Standardization, 1997. [3] X. Wu, S. Rakheja and P.-E. Boileau, “Analyses of Rela- tionships between Biodynamic Response Functions,” Journal of Sound and Vibration, Vol. 226, No. 3, 1999, pp. 595-606. [4] R. R. Coermann, “The Mechanical Impedance of the Human Body in Sitting and Standing Position at Low Frequencies,” Human Factors, October 1962, pp. 227- 253. [5] C. W. Suggs, C. F. Abrams and L. F. Stikeleather, “Ap- plication of a Damped Spring-Mass Human Vibration Simulator in Vibration Testing of Vehicle Seats,” Ergo- nomics, Vol. 12, No. 1, 1969, pp. 79-90. [6] V. K. Tewari and N. Prasad, “Three-DOF Modelling of  W. ABBAS ET AL. Copyright © 2010 SciRes. ENG 719 Tractor Seat-Operator System,” Journal of Terramecha- nics, Vol. 36, No. 4, 1999, pp. 207-219. [7] P. E. Boileau and S. Rakheja, “Whole-Body Vertical Biodynamic Response Characteristics of the Seated Ve- hicle Driver: Measurement and Model Development,” International Journal of Industrial Ergonomics, Vol. 22, No. 6, 1998, pp. 449-472. [8] Z. Zong and K. Y. Lam, “Biodynamic Response of Ship- board Sitting Subject to Ship Shock Motion,” Journal of Biomechanics, Vol. 35, No. 1, 2002, pp. 35-43. [9] X. X. Liu, J. Shi and G. H. Li, “Biodynamic Response and Injury Estimation of Ship Personnel to Ship Shock Motion Induced by Underwater Explosion,” Proceeding of 69th Shock and Vibration Symposium, Vol. 18, St. Paul, 1998, pp. 1-18. [10] R. Muksian and C. D. Nash, “A Model for the Response of Seated Humans to Sinusoidal Displacements of the Seat,” Journal of Biomechanics, Vol. 7, No. 3, 1974, pp. 209-215. [11] M. K. Patil, M. S. Palanichamy and N. G. Dhanjoo, “Minimization of the Verticale Vibrations Sustained by a Tractor Operator, By Provision of a Standard-Type Trac- tor Seat Suspension,” ANNALS of Biomedical Engineer- ing, Vol. 6, 1978, pp. 138-153. [12] C. C. Liang and C. F. Chiang, “A Study on Biodynamic Models of Seated Human Subjects Exposed to Vertical Vibration,” International Journal of Industrial Ergonom- ics, Vol. 36, No. 10, 2006, pp. 869-890. [13] A. E. Baumal, J. J. McPhee and P. H. Calamai, “Applica- tion of Genetic Algorithms to the Design Optimization of an Active Vehicle Suspension System,” Computer Meth- ods in Applied Mechanics and Engineering, Vol. 163, No. 1, 1998, pp. 87-94. [14] P.-E. Boileau, “A Study of Secondary Suspensions and Human Drivers Response to Whole-Body Vehicular Vi- bration and Shock,” Ph.D. Thesis, Concordia University, Montreal, Quebec, 1995. [15] W. Wang, “A Study of Force-Motion and Vibration Transmission Properties of Seated Body under Vertical Vibration and Effects of Sitting Posture,” Ph.D. Thesis Concordia University, Montreal, Quebec, 2006. [16] Y. Huang, “Mechanism of Nonlinear Biodynamic Re- sponse of the Human Body Exposed to Whole-Body Vi- bration,” Ph.D. Thesis, University of Southampton, 2008. [17] C. C. Liang and C. F. Chiang, “Modeling of a Seated Human Body Exposed to Vertical Vibrations in Various Automotive Postures,” Industrial Health, Vol. 46, No. 2, 2008, pp. 125-137. [18] X. Wu, “A Study of Driver-Seat Interaction and En- hancement of Vehicular Ride Vibration Environment,” PhD. Thesis Concordia University, Montreal, Quebec, 1998. [19] Y. Wan and J. M. Schimmels, “A Simple Model that Captures the Essential Dynamics of a Seated Human Ex- posed to Whole Body Vibration,” Advances in Bioengi- neering, ASME, Vol. 31, 1995, pp. 333-334. |