Paper Menu >>
Journal Menu >>
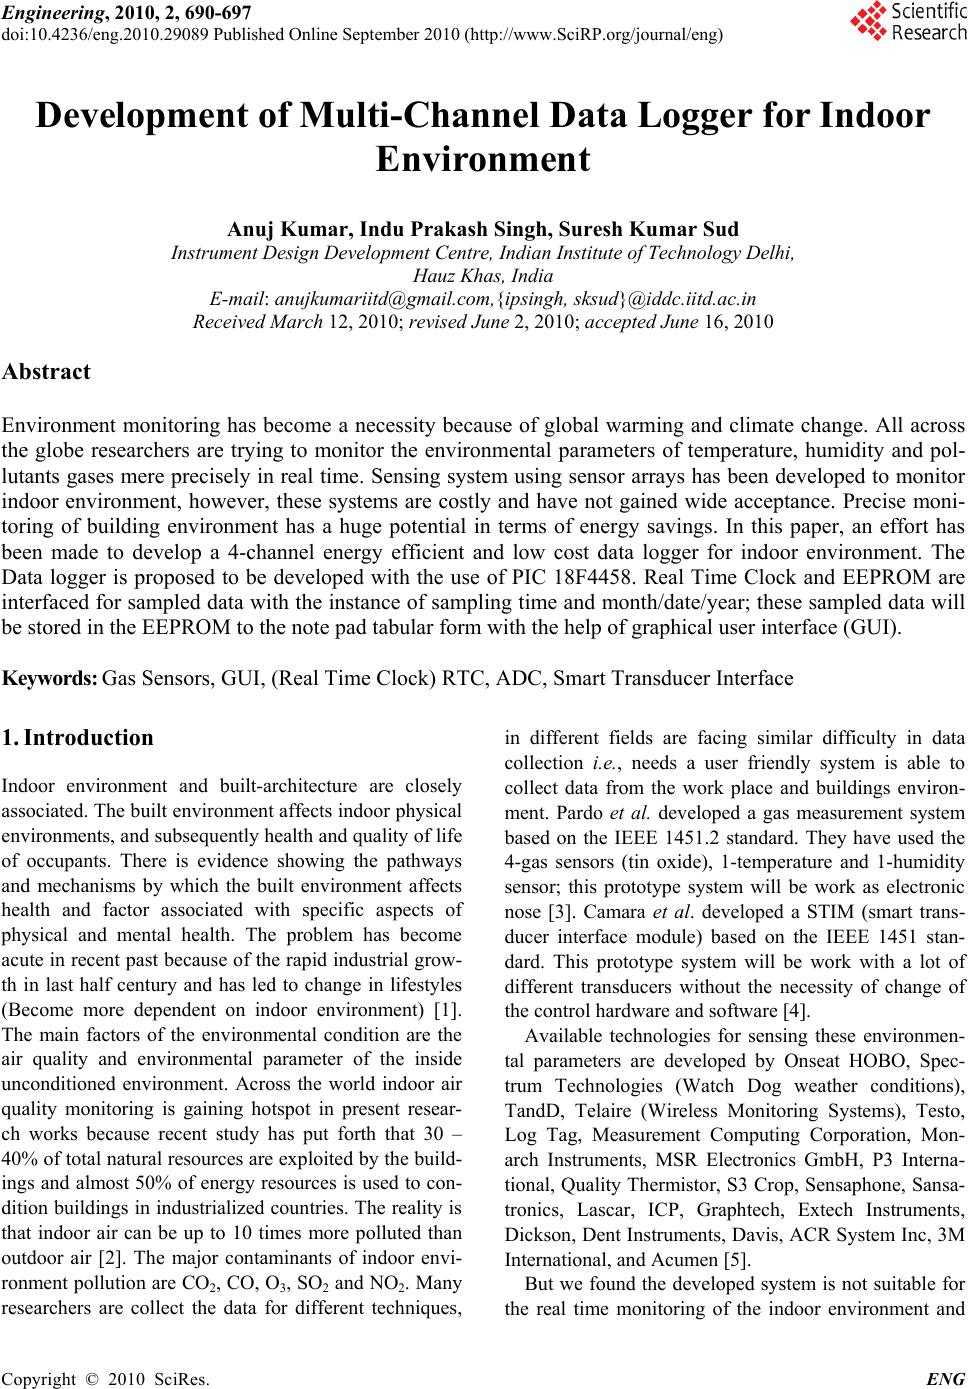 Engineering, 2010, 2, 690-697 doi:10.4236/eng.2010.29089 Published Online September 2010 (http://www.SciRP.org/journal/eng) Copyright © 2010 SciRes. ENG Development of Multi-Channel Data Logger for Indoor Environment Anuj Kumar, Indu Prakash Singh, Suresh Kumar Sud Instrument Design Development Centre, Indian Institute of Technology Delhi, Hauz Khas, India E-mail: anujkumariitd@gmail.com,{ipsingh, sksud}@iddc.iitd.ac.in Received March 12, 2010; revised June 2, 2010; accepted June 16, 2010 Abstract Environment monitoring has become a necessity because of global warming and climate change. All across the globe researchers are trying to monitor the environmental parameters of temperature, humidity and pol- lutants gases mere precisely in real time. Sensing system using sensor arrays has been developed to monitor indoor environment, however, these systems are costly and have not gained wide acceptance. Precise moni- toring of building environment has a huge potential in terms of energy savings. In this paper, an effort has been made to develop a 4-channel energy efficient and low cost data logger for indoor environment. The Data logger is proposed to be developed with the use of PIC 18F4458. Real Time Clock and EEPROM are interfaced for sampled data with the instance of sampling time and month/date/year; these sampled data will be stored in the EEPROM to the note pad tabular form with the help of graphical user interface (GUI). Keywords: Gas Sensors, GUI, (Real Time Clock) RTC, ADC, Smart Transducer Interface 1. Introduction Indoor environment and built-architecture are closely associated. The built environment affects indoor physical environments, and subsequently health and quality of life of occupants. There is evidence showing the pathways and mechanisms by which the built environment affects health and factor associated with specific aspects of physical and mental health. The problem has become acute in recent past because of the rapid industrial grow- th in last half century and has led to change in lifestyles (Become more dependent on indoor environment) [1]. The main factors of the environmental condition are the air quality and environmental parameter of the inside unconditioned environment. Across the world indoor air quality monitoring is gaining hotspot in present resear- ch works because recent study has put forth that 30 – 40% of total natural resources are exploited by the build- ings and almost 50% of energy resources is used to con- dition buildings in industrialized countries. The reality is that indoor air can be up to 10 times more polluted than outdoor air [2]. The major contaminants of indoor envi- ronment pollution are CO2, CO, O3, SO2 and NO2. Many researchers are collect the data for different techniques, in different fields are facing similar difficulty in data collection i.e. , needs a user friendly system is able to collect data from the work place and buildings environ- ment. Pardo et al. developed a gas measurement system based on the IEEE 1451.2 standard. They have used the 4-gas sensors (tin oxide), 1-temperature and 1-humidity sensor; this prototype system will be work as electronic nose [3]. Camara et al. developed a STIM (smart trans- ducer interface module) based on the IEEE 1451 stan- dard. This prototype system will be work with a lot of different transducers without the necessity of change of the control hardware and software [4]. Available technologies for sensing these environmen- tal parameters are developed by Onseat HOBO, Spec- trum Technologies (Watch Dog weather conditions), TandD, Telaire (Wireless Monitoring Systems), Testo, Log Tag, Measurement Computing Corporation, Mon- arch Instruments, MSR Electronics GmbH, P3 Interna- tional, Quality Thermistor, S3 Crop, Sensaphone, Sansa- tronics, Lascar, ICP, Graphtech, Extech Instruments, Dickson, Dent Instruments, Davis, ACR System Inc, 3M International, and Acumen [5]. But we found the developed system is not suitable for the real time monitoring of the indoor environment and 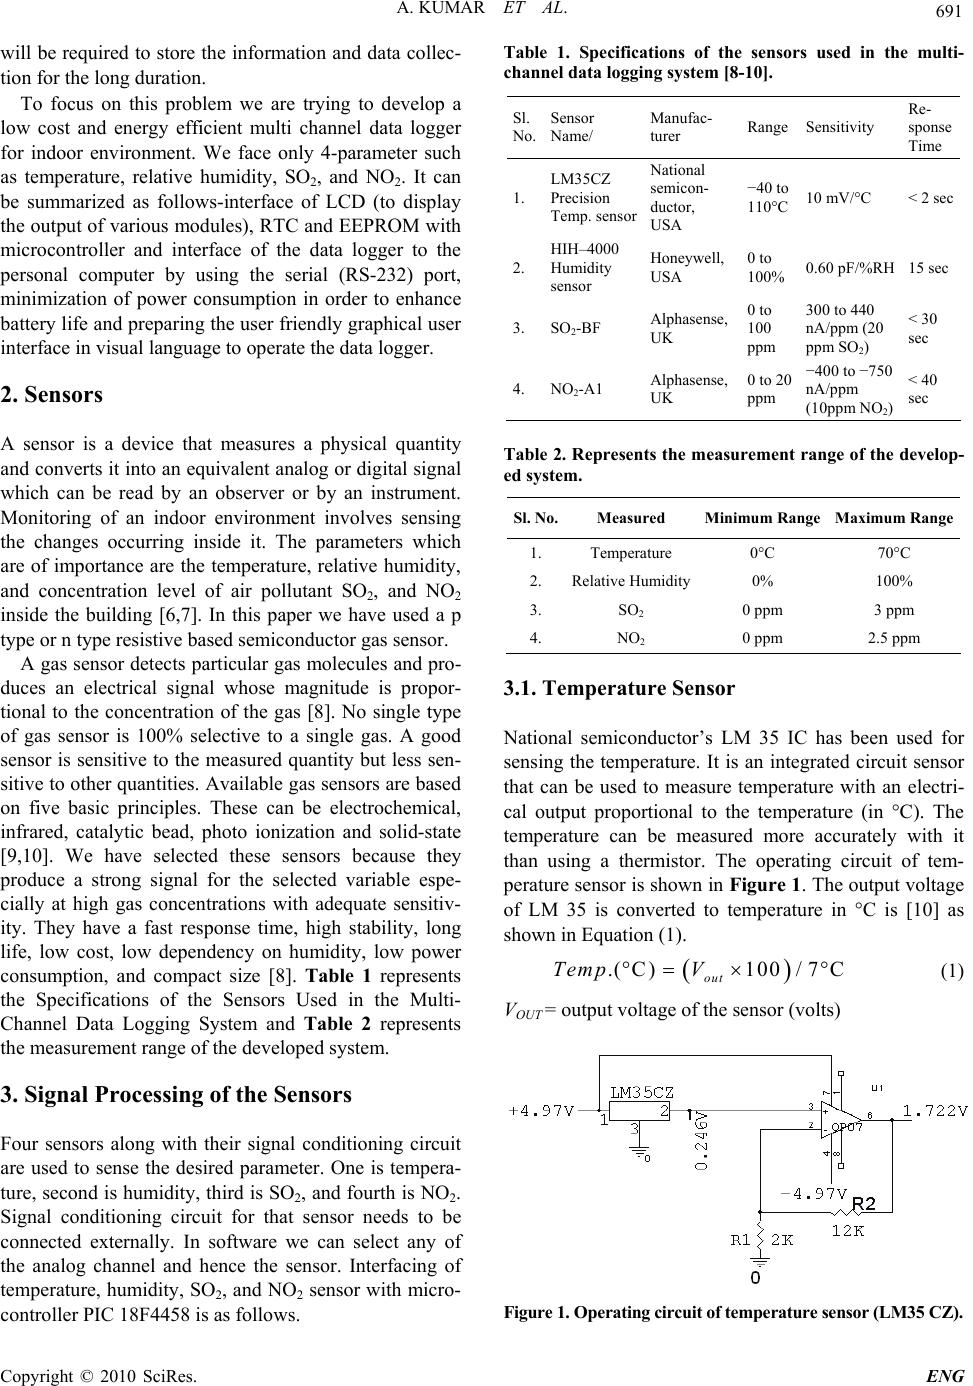 A. KUMAR ET AL. Copyright © 2010 SciRes. ENG 691 will be required to store the information and data collec- tion for the long duration. To focus on this problem we are trying to develop a low cost and energy efficient multi channel data logger for indoor environment. We face only 4-parameter such as temperature, relative humidity, SO2, and NO2. It can be summarized as follows-interface of LCD (to display the output of various modules), RTC and EEPROM with microcontroller and interface of the data logger to the personal computer by using the serial (RS-232) port, minimization of power consumption in order to enhance battery life and preparing the user friendly graphical user interface in visual language to operate the data logger. 2. Sensors A sensor is a device that measures a physical quantity and converts it into an equivalent analog or digital signal which can be read by an observer or by an instrument. Monitoring of an indoor environment involves sensing the changes occurring inside it. The parameters which are of importance are the temperature, relative humidity, and concentration level of air pollutant SO2, and NO2 inside the building [6,7]. In this paper we have used a p type or n type resistive based semiconductor gas sensor. A gas sensor detects particular gas molecules and pro- duces an electrical signal whose magnitude is propor- tional to the concentration of the gas [8]. No single type of gas sensor is 100% selective to a single gas. A good sensor is sensitive to the measured quantity but less sen- sitive to other quantities. Available gas sensors are based on five basic principles. These can be electrochemical, infrared, catalytic bead, photo ionization and solid-state [9,10]. We have selected these sensors because they produce a strong signal for the selected variable espe- cially at high gas concentrations with adequate sensitiv- ity. They have a fast response time, high stability, long life, low cost, low dependency on humidity, low power consumption, and compact size [8]. Table 1 represents the Specifications of the Sensors Used in the Multi- Channel Data Logging System and Table 2 represents the measurement range of the developed system. 3. Signal Processing of the Sensors Four sensors along with their signal conditioning circuit are used to sense the desired parameter. One is tempera- ture, second is humidity, third is SO2, and fourth is NO2. Signal conditioning circuit for that sensor needs to be connected externally. In software we can select any of the analog channel and hence the sensor. Interfacing of temperature, humidity, SO2, and NO2 sensor with micro- controller PIC 18F4458 is as follows. Table 1. Specifications of the sensors used in the multi- channel data logging system [8-10]. Sl. No. Sensor Name/ Manufac- turer Range Sensitivity Re- sponse Time 1. LM35CZ Precision Temp. sensor National semicon- ductor, USA −40 to 110°C 10 mV/°C < 2 sec 2. HIH–4000 Humidity sensor Honeywell, USA 0 to 100% 0.60 pF/%RH15 sec 3. SO2-BF Alphasense, UK 0 to 100 ppm 300 to 440 nA/ppm (20 ppm SO2) < 30 sec 4. NO2-A1 Alphasense, UK 0 to 20 ppm −400 to −750 nA/ppm (10ppm NO2) < 40 sec Table 2. Represents the measurement range of the develop- ed system. Sl. No.Measured Minimum Range Maximum Range 1. Temperature 0°C 70°C 2. Relative Humidity0% 100% 3. SO2 0 ppm 3 ppm 4. NO2 0 ppm 2.5 ppm 3.1. Temperature Sensor National semiconductor’s LM 35 IC has been used for sensing the temperature. It is an integrated circuit sensor that can be used to measure temperature with an electri- cal output proportional to the temperature (in °C). The temperature can be measured more accurately with it than using a thermistor. The operating circuit of tem- perature sensor is shown in Figure 1. The output voltage of LM 35 is converted to temperature in °C is [10] as shown in Equation (1). .(C)100/ 7C out Temp V (1) VOUT = output voltage of the sensor (volts) Figure 1. Operating circuit of temperature sensor (LM35 CZ). 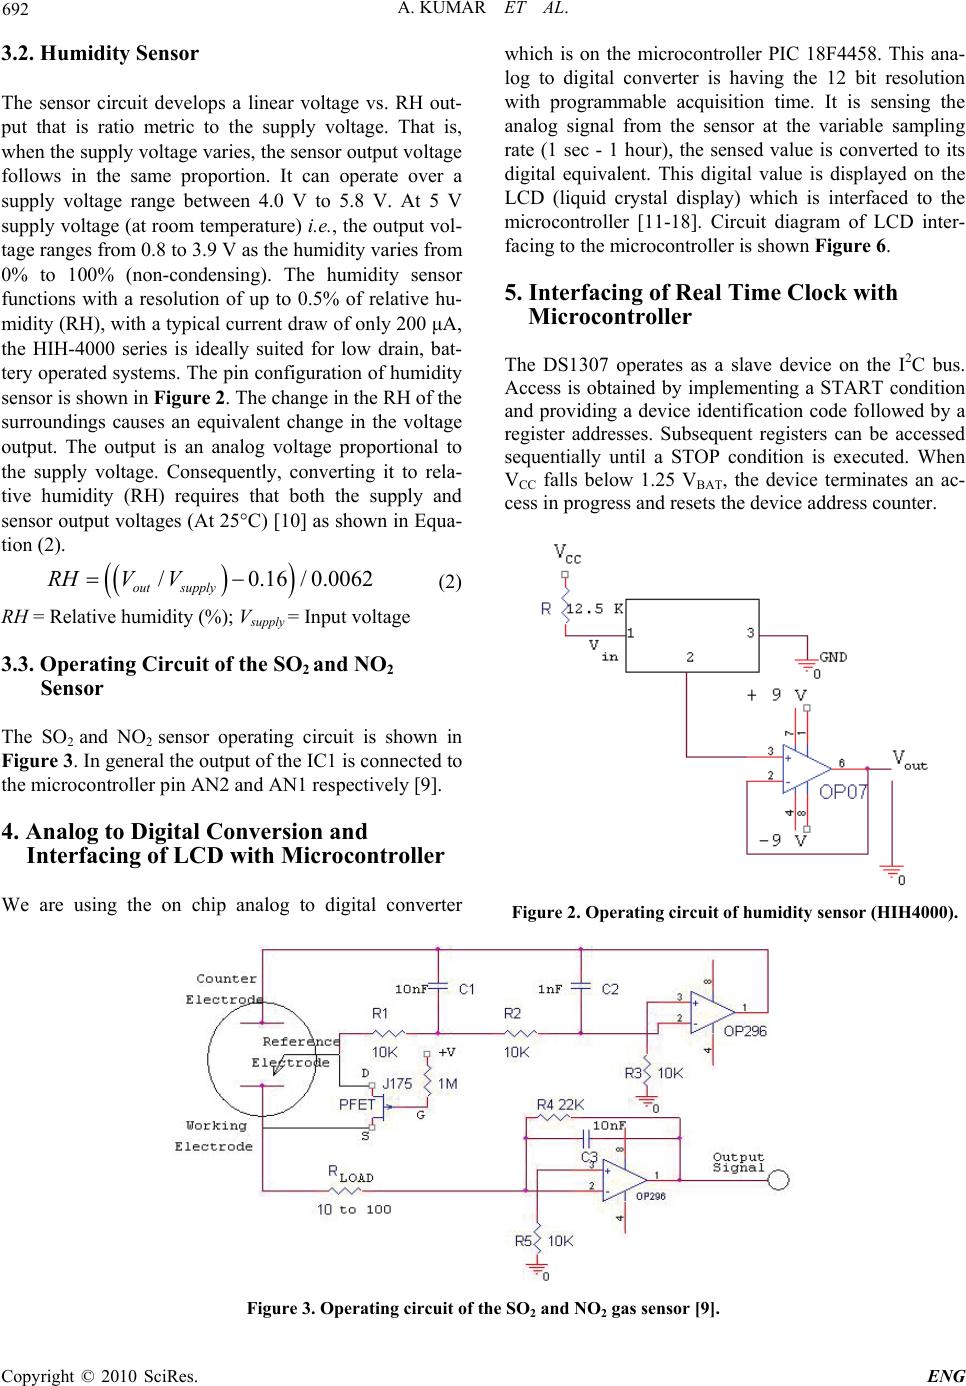 A. KUMAR ET AL. Copyright © 2010 SciRes. ENG 692 3.2. Humidity Sensor The sensor circuit develops a linear voltage vs. RH out- put that is ratio metric to the supply voltage. That is, when the supply voltage varies, the sensor output voltage follows in the same proportion. It can operate over a supply voltage range between 4.0 V to 5.8 V. At 5 V supply voltage (at room temperature) i.e., the output vol- tage ranges from 0.8 to 3.9 V as the humidity varies from 0% to 100% (non-condensing). The humidity sensor functions with a resolution of up to 0.5% of relative hu- midity (RH), with a typical current draw of only 200 μA, the HIH-4000 series is ideally suited for low drain, bat- tery operated systems. The pin configuration of humidity sensor is shown in Figure 2. The change in the RH of the surroundings causes an equivalent change in the voltage output. The output is an analog voltage proportional to the supply voltage. Consequently, converting it to rela- tive humidity (RH) requires that both the supply and sensor output voltages (At 25°C) [10] as shown in Equa- tion (2). /0.16/ 0.0062 out supply RHVV (2) RH = Relative humidity (%); Vsupply = Input voltage 3.3. Operating Circuit of the SO2 and NO2 Sensor The SO2 and NO2 sensor operating circuit is shown in Figure 3. In general the output of the IC1 is connected to the microcontroller pin AN2 and AN1 respectively [9]. 4. Analog to Digital Conversion and Interfacing of LCD with Microcontroller We are using the on chip analog to digital converter which is on the microcontroller PIC 18F4458. This ana- log to digital converter is having the 12 bit resolution with programmable acquisition time. It is sensing the analog signal from the sensor at the variable sampling rate (1 sec - 1 hour), the sensed value is converted to its digital equivalent. This digital value is displayed on the LCD (liquid crystal display) which is interfaced to the microcontroller [11-18]. Circuit diagram of LCD inter- facing to the microcontroller is shown Figure 6. 5. Interfacing of Real Time Clock with Microcontroller The DS1307 operates as a slave device on the I2C bus. Access is obtained by implementing a START condition and providing a device identification code followed by a register addresses. Subsequent registers can be accessed sequentially until a STOP condition is executed. When VCC falls below 1.25 VBAT, the device terminates an ac- cess in progress and resets the device address counter. Figure 2. Operating circuit of humidity sensor (HIH4000). Figure 3. Operating circuit of the SO2 and NO2 gas sensor [9]. 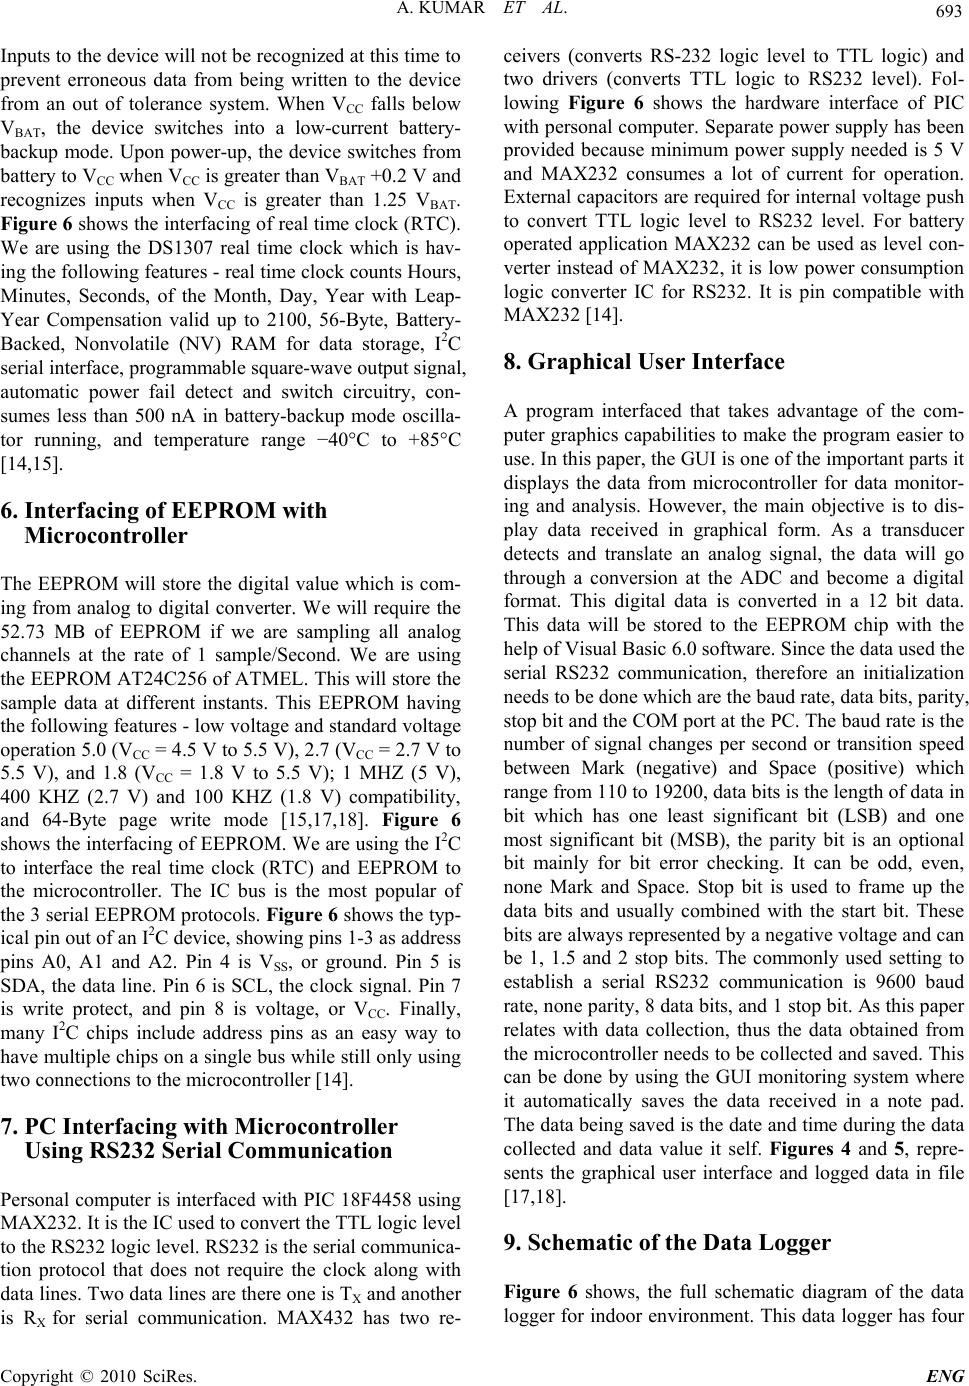 A. KUMAR ET AL. Copyright © 2010 SciRes. ENG 693 Inputs to the device will not be recognized at this time to prevent erroneous data from being written to the device from an out of tolerance system. When VCC falls below VBAT, the device switches into a low-current battery- backup mode. Upon power-up, the device switches from battery to VCC when VCC is greater than VBAT +0.2 V and recognizes inputs when VCC is greater than 1.25 VBAT. Figure 6 shows the interfacing of real time clock (RTC). We are using the DS1307 real time clock which is hav- ing the following features - real time clock counts Hours, Minutes, Seconds, of the Month, Day, Year with Leap- Year Compensation valid up to 2100, 56-Byte, Battery- Backed, Nonvolatile (NV) RAM for data storage, I2C serial interface, programmable square-wave output signal, automatic power fail detect and switch circuitry, con- sumes less than 500 nA in battery-backup mode oscilla- tor running, and temperature range −40°C to +85°C [14,15]. 6. Interfacing of EEPROM with Microcontroller The EEPROM will store the digital value which is com- ing from analog to digital converter. We will require the 52.73 MB of EEPROM if we are sampling all analog channels at the rate of 1 sample/Second. We are using the EEPROM AT24C256 of ATMEL. This will store the sample data at different instants. This EEPROM having the following features - low voltage and standard voltage operation 5.0 (VCC = 4.5 V to 5.5 V), 2.7 (VCC = 2.7 V to 5.5 V), and 1.8 (VCC = 1.8 V to 5.5 V); 1 MHZ (5 V), 400 KHZ (2.7 V) and 100 KHZ (1.8 V) compatibility, and 64-Byte page write mode [15,17,18]. Figure 6 shows the interfacing of EEPROM. We are using the I2C to interface the real time clock (RTC) and EEPROM to the microcontroller. The IC bus is the most popular of the 3 serial EEPROM protocols. Figure 6 shows the typ- ical pin out of an I2C device, showing pins 1-3 as address pins A0, A1 and A2. Pin 4 is VSS, or ground. Pin 5 is SDA, the data line. Pin 6 is SCL, the clock signal. Pin 7 is write protect, and pin 8 is voltage, or VCC. Finally, many I2C chips include address pins as an easy way to have multiple chips on a single bus while still only using two connections to the microcontroller [14]. 7. PC Interfacing with Microcontroller Using RS232 Serial Communication Personal computer is interfaced with PIC 18F4458 using MAX232. It is the IC used to convert the TTL logic level to the RS232 logic level. RS232 is the serial communica- tion protocol that does not require the clock along with data lines. Two data lines are there one is TX and another is RX for serial communication. MAX432 has two re- ceivers (converts RS-232 logic level to TTL logic) and two drivers (converts TTL logic to RS232 level). Fol- lowing Figure 6 shows the hardware interface of PIC with personal computer. Separate power supply has been provided because minimum power supply needed is 5 V and MAX232 consumes a lot of current for operation. External capacitors are required for internal voltage push to convert TTL logic level to RS232 level. For battery operated application MAX232 can be used as level con- verter instead of MAX232, it is low power consumption logic converter IC for RS232. It is pin compatible with MAX232 [14]. 8. Graphical User Interface A program interfaced that takes advantage of the com- puter graphics capabilities to make the program easier to use. In this paper, the GUI is one of the important parts it displays the data from microcontroller for data monitor- ing and analysis. However, the main objective is to dis- play data received in graphical form. As a transducer detects and translate an analog signal, the data will go through a conversion at the ADC and become a digital format. This digital data is converted in a 12 bit data. This data will be stored to the EEPROM chip with the help of Visual Basic 6.0 software. Since the data used the serial RS232 communication, therefore an initialization needs to be done which are the baud rate, data bits, parity, stop bit and the COM port at the PC. The baud rate is the number of signal changes per second or transition speed between Mark (negative) and Space (positive) which range from 110 to 19200, data bits is the length of data in bit which has one least significant bit (LSB) and one most significant bit (MSB), the parity bit is an optional bit mainly for bit error checking. It can be odd, even, none Mark and Space. Stop bit is used to frame up the data bits and usually combined with the start bit. These bits are always represented by a negative voltage and can be 1, 1.5 and 2 stop bits. The commonly used setting to establish a serial RS232 communication is 9600 baud rate, none parity, 8 data bits, and 1 stop bit. As this paper relates with data collection, thus the data obtained from the microcontroller needs to be collected and saved. This can be done by using the GUI monitoring system where it automatically saves the data received in a note pad. The data being saved is the date and time during the data collected and data value it self. Figures 4 and 5, repre- sents the graphical user interface and logged data in file [17,18]. 9. Schematic of the Data Logger Figure 6 shows, the full schematic diagram of the data logger for indoor environment. This data logger has four  A. KUMAR ET AL. Copyright © 2010 SciRes. ENG 694 embedded sensor module and other four channels are open to be used for the measurement of other environ- mental parameters. 10. Software Design of Data Logger This subsection includes the software design for all the modules interfaced with PIC 18F4458. It covers com- plete software design for data logger. The programs have been written to the environmental parameters and con- centration level of SO2 and NO2 gases are monitored for 24 hours and save the data of EEPROM corresponding to the time and date. 10.1. Programming Steps for I2C Interface I2C is also bi-directional. This is implemented by an “Acknowledge” system or “ACK” system allows data to Figure 4. GUI for the data logger. Figure 5. Representation of the logged data in file. be sent in one direction to one item on the I2C bus, than, that item will “ACK” to indicate the data was received. Normally, the master device controls the clock line, SCL. This line dictates the timing of all transfers on the I2C bus. Other devices can manipulate this line, but they can only force the line low. This action means that item on the bus cannot deal with more data in to any device. 10.1.1. Writing to a I2C Chip The function of writing to the EEPROM is shown here as “Control IN”, which represents putting the EEPROM in an “input” mode. Since we are only sending data to the EEPROM, we use the “Control IN” byte. We will use “Control OUT” later. Figure 7 shows the display of data saver memory (data writing of the memory). Next, the EEPROM acknowledges this byte; this is shown by the “A” after the byte. It is put on the next line to indicate this is transmitted by the EEPROM. Next the PIC microcontroller sends the address byte. The address byte contains the address of the location of the EEPROM; we want to write data. Since the address is valid the data is acknowledged by the EEPROM. Finally, we send the data we want to write. The data is then acknowledged by the EEPROM. When that finishes, we send a stop condi- tion to complete the transfer. Remember the “STOP” is represented as the “T” block on the end. Once the EEPROM gets the “STOP” condition it will begin writ- ing to its memory. The write will not occur until it re- ceives the “STOP” condition. 10.1.2. Reading from an I2C Chip The transfer will use the “Control IN” byte to load the address into the EEPROM. This sends data to the EEPROM which is why we use the “Control IN” byte. Once the address is loaded, we want to retrieve the data. So, we send a “Control OUT” byte to indicate to the EEPROM that we want data from it. The EEPROM will acknowledge this and then send the data we requested. When we are done getting data, we send a “NACK” to tell the EEPROM that we do not want more data. If we were to send an ACK at this point, we could get the next byte of data from the EEPROM. Since we only want to read one byte, we send a “NACK”. This is detailed in the specifications for the EEPROM. Figure 8 shows the dis- play of outcome data saver memory (data reading and save outcome data in note pad form). 10.2. Programming Steps for LCD Interface 10.2.1. LCD Module is Initialization and Configuration to Work in 4 Bit Module Set RS = 0 to send command; send 0b0010 to data lines  A. KUMAR ET AL. Copyright © 2010 SciRes. ENG 695 Figure 6. Full schematic of the data logger. Figure 7. Display of data saver memory. three times with a delay of 2 ms; to send a byte on 4 data line. Send higher nibble first and give a RE pulse of 100 us at RE. Send a set of instruction one after another with a delay of 2 ms between each command to configure various setting as given in instruction set of LCD data- sheet. Send instruction set again. Figure 8. Display of outcome data saver memory. 10.2.2. Display a Character Set RS = 1; send higher nibble at 4 data lines. Send 100uS RE pulse; send lower nibble at data lines. Send RE pulse; keep track of number of character already dis-  A. KUMAR ET AL. Copyright © 2010 SciRes. ENG 696 played on display panel using LCD count up. Go to line 2 or line 1 according to that. 10.3. Programming Steps for Sensor Data Collection There are connected four sensors temperature, humidity, SO2, and NO2. Data is collected by the ADC inbuilt in PIC. ADC provides 10 bit of data after the conversion is completed. 10.3.1. Data Collection of Temperature Sensor Select the analog channel AN0, alignment of bits for ADRESH and ADRESL, sampling frequency, Vref, power on the ADC module by setting ADCON0, AD- CON1 and ADCON2 registers. Start A to D conversion by setting ADGO bit high and wait till ADIF flag will not indicate the completion of conversion and copy the results from ADRESH and ADRESL to variables. 10.3.2. Data Collection of Humidity Sensor Select the AN3 and set other features of ADC as tem- perature sensor and after completion of conversion cop- ies the result in variable. 10.3.3. Data Collection of NO2 and SO2 Sensor Data collection from the NO2 sensor needs following actions to be carried out 1) Selecting the analog channel AN1, sampling frequency, and alignment of bits for ADRESH and ADRESL, 2) Vref and power on the ADC module by setting ADCON0, ADCON1 and ADCON2 registers, 3) starting analog to digital conversion by set- ting ADGO bit high (wait till ADIF flag will not indicate the completion of conversion), and 4) copy of results from ADRESH and ADRESL to variables. Now repeat the same process to collect the SO2 data on the channel number AN2. 11. Results and Discussion Sensors module, EEPROM, RTC, and LCD have been successfully interfaced to the microcontroller. EEPROM is successfully storing the logged data with time and date tag. The sensors data is being displayed on LCD module. A simple GUI has been designed to store a logged data to a text file, so that it can be analyzed further. The devel- oped system is lowest cost and energy efficient system. The power consumption of the developed system is minimum (< 250 mA). 12. Conclusions We have developed a low cost, 12 bit resolution data logger and successfully measured temperature, humidity, and concentration of SO2 and NO2 gases. The GUI de- signed gives a lucratively look to the functioning of data logger. Initial results of the data logger are encouraging and we are working on to improve the GUI model as well as the accuracy of data logger. 13. Future Scope We can improve the data logger by incorporating the wireless communication in it. There fore, by combining the term data acquisition and wireless communication, it becomes wireless data acquisition. This new innovation technology has become the trend for most industries and companies around the world to gather information due to its reliability and outstanding outcome. The advantage of this technology is that it did not use any physical com- ponents or wires to transfer the data obtained from sensor at transmitter side to the receiver side. As a result, an effective system is developed where it is not only re- moves all the conventional hardware and replace with a transceiver modem for data transfer but also a cost effec- tive system as well. Moreover, the data transmission range can be extended into longer range depending on the transceiver modem capability. With this feature, in- formation from the transducer could be transmitted faster and acts as an early alert in case of accident or disaster such as fire, food and earthquake. By modifying the GUI we can display the waveforms of the data on the com- puter console where as presently we are logging the data to the file. We also can incorporate the USB communica- tion so that we can transfer the data at high data rates. 14. References [1] E. Samakovlis, A. Huhtale, T. Bellander and M. Svarten- gren, “Valuinghealth Effects of Air Pollution Focus on Concentration-Response Functions,” Journal of Urban Economics, Vol. 58, No. 2, 2005, pp. 230-249. [2] J. D. Richard and G. S. Brager, “Thermal Comfort in Naturally Ventilated Buildings: Revisions to ASHRAE Standard 55,” Energy and Buildings, Vol. 34, No. 6, 2002, pp. 549-561. [3] A. Pardo, L. Camara, J. Cabre, A. Perera, X. Cano, S. Marco and J. Bosch, “Gas Measurement System Based on IEEE 1451.2 Standard,” Sensors and Actuators B, Vol. 116, No. 1, 2006, pp. 11-16. [4] L. Camara, O. Ruiz, A. Herms, J. Samitier and J. Bosch, “Automatic Generation of Intelligent Instruments for IEEE1451,” Measurement, Vol. 35, No. 1, 2004, pp. 3-9. [5] Microdaq, 3 March 2009. http://www.microdaq.com/data- logger/ [6] N. Ulivieri, C. Distante, T. Luca, S. Rocchi and P. Sicili- ano, “IEEE 1451.4: A Way to Standardize Gas Sensor,”  A. KUMAR ET AL. Copyright © 2010 SciRes. ENG 697 Sensors and Actuators B, Vol. 114, No. 1, 2006, pp. 141-151. [7] D. D. Lee and D. S. Lee, “Environment Gas Sensors,” IEEE Sensors Journal, Vol. 1, No. 3, 2001, pp. 214-215. [8] N. Kularatna and B. H. Sudantha, “An Environmental Air Pollution Monitoring System Based on the IEEE 1451 Standard for Low Cost Requirements,” IEEE Sensors Journal, Vol. 8, No. 4, 2008, pp. 415-422. [9] http://www.alphasense.com [10] http://be02.rsonline.com/web/search/searchBrowseAction. html?method=searchProducts&searchTerm [11] G. Song, A. Song and W. Huang, “Distributed Measure- ment System Based on Network Smart Sensors with Standardize Interface,” Sensors and Actuators A, Vol. 120, No. 1, 2005, pp. 147-153. [12] T. Schneider, D. Richter, S. Doerner, H. Fritze and P. Hauptmann, “Novel Impedence Interface for Resonant High-Temperature Gas Sensors,” Sensors and Actuators A, Vol. 111-112, No. 11, 2005, pp. 187-192. [13] R. Luharuka and R. X. Gao, “A Microcontroller-Based Data Logger for Physiological Sensing,” IEEE Proceed- ing IMTCi 2002, pp. 175-180. [14] Data Acquisition Logging Circuits. http://www.hobby- projects.com/A/acquistions_data_circuits [15] Data Sheet of Real Time Clock DS1307. http://www.gla- cialwanderer.com/_blog/blog2008/04_April/DS1307.pdf [16] www.microchip.com [17] Introduction to Data Acquisition. http://zone.ni.com/dev- zone/cocepted.nsf/webmain/AE2A7B85BD4785D586256 F620066EFF4 [18] G. Mason, “A Handheld Data Acquisition System for Use in an Undergraduate Data Acquisition Course,” IEEE Transaction on Education, Vol. 45, No. 4, 2008, pp. 388- 393. |