Paper Menu >>
Journal Menu >>
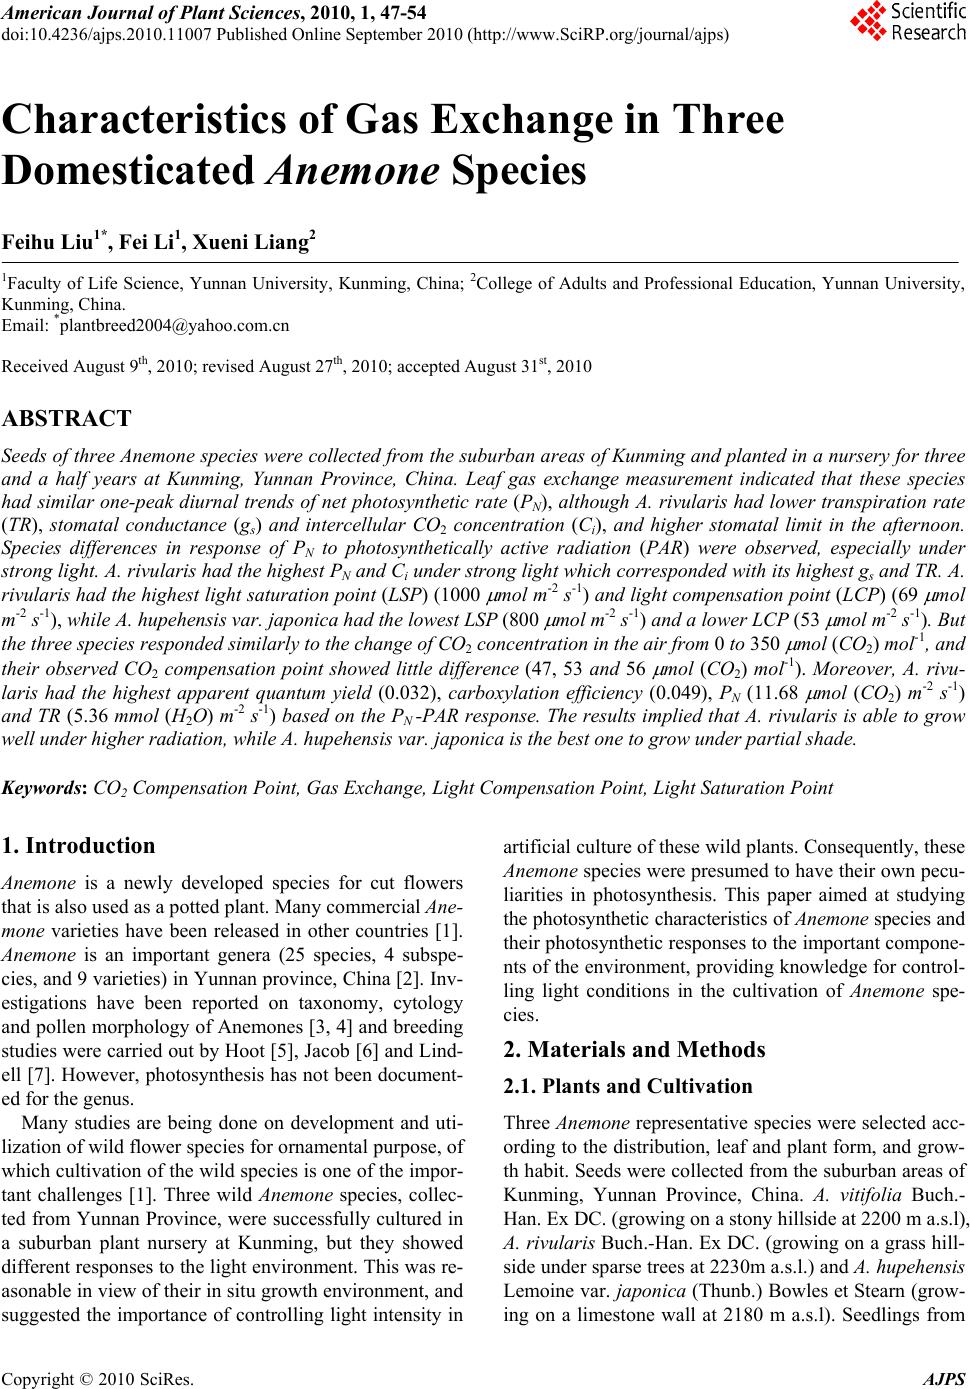 American Journal of Plant Sciences, 2010, 1, 47-54 doi:10.4236/ajps.2010.11007 Published Online September 2010 (http://www.SciRP.org/journal/ajps) Copyright © 2010 SciRes. AJPS 47 Characteristics of Gas Exchange in Three Domesticated Anemone Species Feihu Liu1*, Fei Li1, Xueni Liang2 1Faculty of Life Science, Yunnan University, Kunming, China; 2College of Adults and Professional Education, Yunnan University, Kunming, China. Email: *plantbreed2004@yahoo.com.cn Received August 9th, 2010; revised August 27th, 2010; accepted August 31st, 2010 ABSTRACT Seeds of three Anemone species were collected from the suburban areas of Kunming and planted in a nursery for three and a half years at Kunming, Yunnan Province, China. Leaf gas exchange measurement indicated that these species had similar one-peak diurnal trends of net photosynthetic rate (PN), although A. rivularis had lower transpiration rate (TR), stomatal conductance (gs) and intercellular CO2 concentration (Ci), and higher stomatal limit in the afternoon. Species differences in response of PN to photosynthetically active radiation (PAR) were observed, especially under strong light. A. rivularis had the highest PN and Ci under strong light which correspon ded with its h ighest gs and TR. A. rivularis had the highest light saturation point (LS P) (1000 mol m-2 s-1) and light compensa tion point (LCP) (69 mol m-2 s-1), while A. hupehensis var. japonica had the lowest LSP (800 mol m-2 s-1) and a lower LCP (53 mol m-2 s-1). But the three species responded similarly to the change of CO2 concentration in the air from 0 to 350 mol (CO2) mol-1, and their observed CO2 compensation point showed little difference (47, 53 and 56 mol (CO2) mol-1). Moreover, A. rivu- laris had the highest apparent quantum yield (0.032), carboxylation efficiency (0.049), PN (11.68 mol (CO2) m-2 s-1) and TR (5.36 mmol (H2O) m-2 s-1) based on the PN -PAR response. The results implied that A. rivularis is able to grow well under higher radiation, while A. hupehensis var. japonica is the best one to grow under partial shade. Keywords: CO2 Compensation Point, Gas Exchange, Light Compensation Point, Light Saturation Point 1. Introduction Anemone is a newly developed species for cut flowers that is also used as a potted plant. Many commercial Ane- mone varieties have been released in other countries [1]. Anemone is an important genera (25 species, 4 subspe- cies, and 9 varieties) in Yunnan province, China [2]. Inv- estigations have been reported on taxonomy, cytology and pollen morphology of Anemones [3, 4] and breeding studies were carried out by Hoot [5], Jacob [6] and Lind- ell [7]. However, photosynthesis has not been document- ed for the genus. Many studies are being done on development and uti- lization of wild flower species for ornamental purpose, of which cultivation of the wild species is one of the impor- tant challenges [1]. Three wild Anemone species, collec- ted from Yunnan Province, were successfully cultured in a suburban plant nursery at Kunming, but they showed different responses to the light environment. This was re- asonable in view of their in situ growth environment, and suggested the importance of controlling light intensity in artificial culture of these wild plants. Consequently, these Anemone species were presumed to have their own pecu- liarities in photosynthesis. This paper aimed at studying the photosynthetic characteristics of Anemone species and their photosynthetic responses to the important compone- nts of the environment, providing knowledge for control- ling light conditions in the cultivation of Anemone spe- cies. 2. Materials and Methods 2.1. Plants and Cultivation Three Anemone representative species were selected acc- ording to the distribution, leaf and plant form, and grow- th habit. Seeds were collected from the suburban areas of Kunming, Yunnan Province, China. A. vitifolia Buch.- Han. Ex DC. (growing on a stony hillside at 2200 m a.s.l), A. rivularis Buch.-Han. Ex DC. (growing on a grass hill- side under sparse trees at 2230m a.s.l.) and A. hupehensis Lemoine var. japonica (Thunb.) Bowles et Stearn (grow- ing on a limestone wall at 2180 m a.s.l). Seedlings from 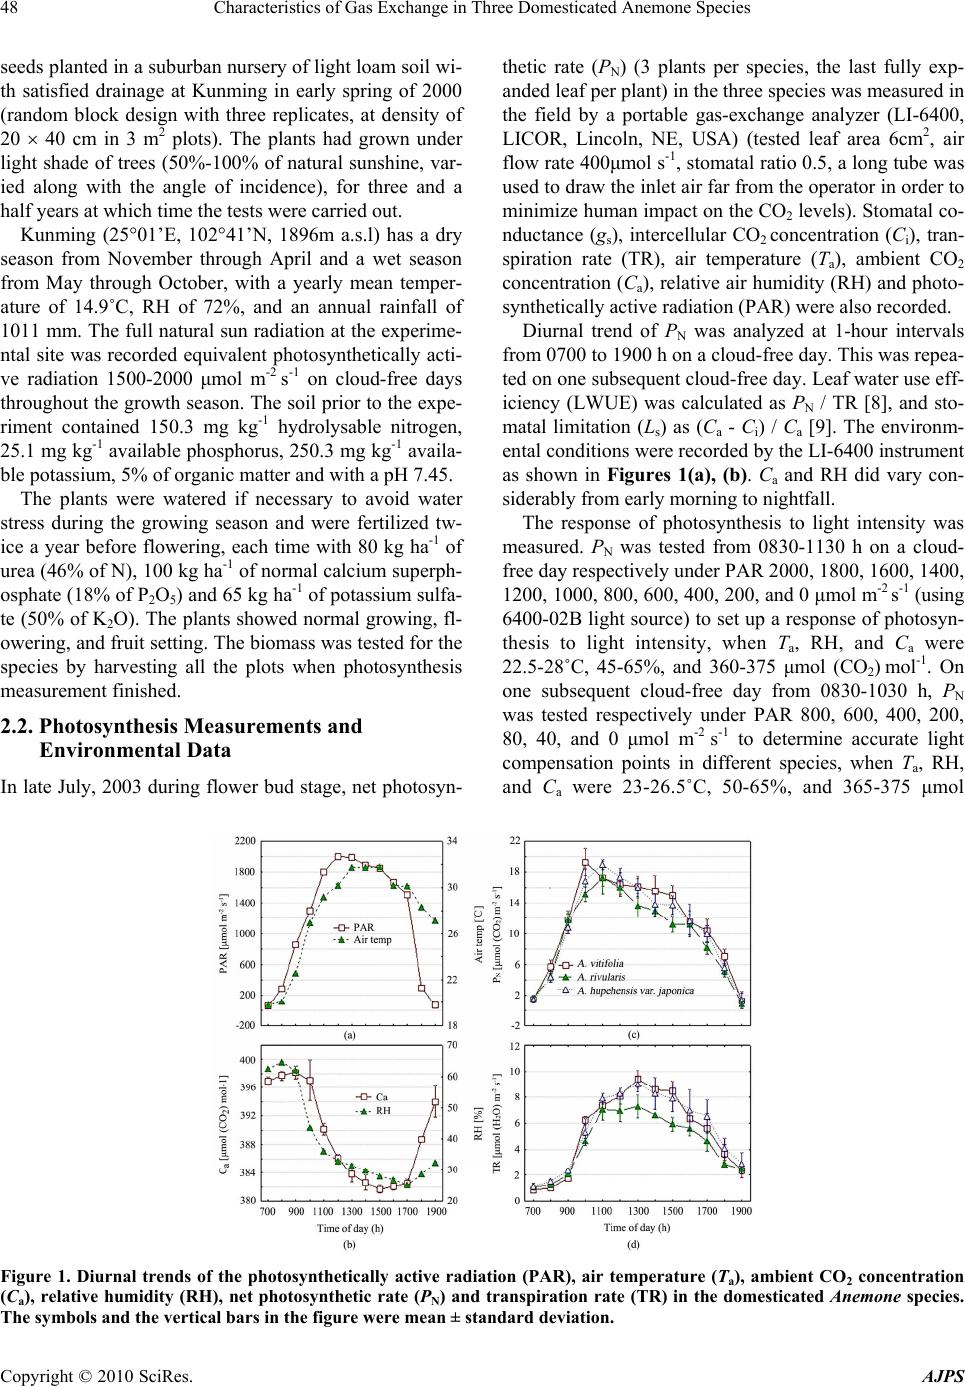 Characteristics of Gas Exchange in Three Domesticated Anemone Species Copyright © 2010 SciRes. AJPS 48 seeds planted in a suburban nursery of light loam soil wi- th satisfied drainage at Kunming in early spring of 2000 (random block design with three replicates, at density of 20 40 cm in 3 m2 plots). The plants had grown under light shade of trees (50%-100% of natural sunshine, var- ied along with the angle of incidence), for three and a half years at which time the tests were carried out. Kunming (2501’E, 10241’N, 1896m a.s.l) has a dry season from November through April and a wet season from May through October, with a yearly mean temper- ature of 14.9˚C, RH of 72%, and an annual rainfall of 1011 mm. The full natural sun radiation at the experime- ntal site was recorded equivalent photosynthetically acti- ve radiation 1500-2000 μmol m-2 s-1 on cloud-free days throughout the growth season. The soil prior to the expe- riment contained 150.3 mg kg-1 hydrolysable nitrogen, 25.1 mg kg-1 available phosphorus, 250.3 mg kg-1 availa- ble potassium, 5% of organic matter and with a pH 7.45. The plants were watered if necessary to avoid water stress during the growing season and were fertilized tw- ice a year before flowering, each time with 80 kg ha-1 of urea (46% of N), 100 kg ha-1 of normal calcium superph- osphate (18% of P2O5) and 65 kg ha-1 of potassium sulfa- te (50% of K2O). The plants showed normal growing, fl- owering, and fruit setting. The biomass was tested for the species by harvesting all the plots when photosynthesis measurement finished. 2.2. Photosynthesis Measurements and Environmental Data In late July, 2003 during flower bud stage, net photosyn- thetic rate (PN) (3 plants per species, the last fully exp- anded leaf per plant) in the three species was measured in the field by a portable gas-exchange analyzer (LI-6400, LICOR, Lincoln, NE, USA) (tested leaf area 6cm2, air flow rate 400μmol s-1, stomatal ratio 0.5, a long tube was used to draw the inlet air far from the operator in order to minimize human impact on the CO2 levels). Stomatal co- nductance (gs), intercellular CO2 concentration (Ci), tran- spiration rate (TR), air temperature (Ta), ambient CO2 concentration (Ca), relative air humidity (RH) and photo- synthetically active radiation (PAR) were also recorded. Diurnal trend of PN was analyzed at 1-hour intervals from 0700 to 1900 h on a cloud-free day. This was repea- ted on one subsequent cloud-free day. Leaf water use eff- iciency (LWUE) was calculated as PN / TR [8], and sto- matal limitation (Ls) as (Ca - Ci) / Ca [9]. The environm- ental conditions were recorded by the LI-6400 instrument as shown in Figures 1(a), (b). Ca and RH did vary con- siderably from early morning to nightfall. The response of photosynthesis to light intensity was measured. PN was tested from 0830-1130 h on a cloud- free day respectively under PAR 2000, 1800, 1600, 1400, 1200, 1000, 800, 600, 400, 200, and 0 μmol m-2 s-1 (using 6400-02B light source) to set up a response of photosyn- thesis to light intensity, when Ta, RH, and Ca were 22.5-28˚C, 45-65%, and 360-375 μmol (CO2) mol-1. On one subsequent cloud-free day from 0830-1030 h, PN was tested respectively under PAR 800, 600, 400, 200, 80, 40, and 0 μmol m-2 s-1 to determine accurate light compensation points in different species, when Ta, RH, and Ca were 23-26.5˚C, 50-65%, and 365-375 μmol Figure 1. Diurnal trends of the photosynthetically active radiation (PAR), air temperature (Ta), ambient CO2 concentration (Ca), relative humidity (RH), net photosynthetic rate (PN) and transpiration rate (TR) in the domesticated Anemone species. The symbols and the vertical bars in the figure were mean ± standard deviation. 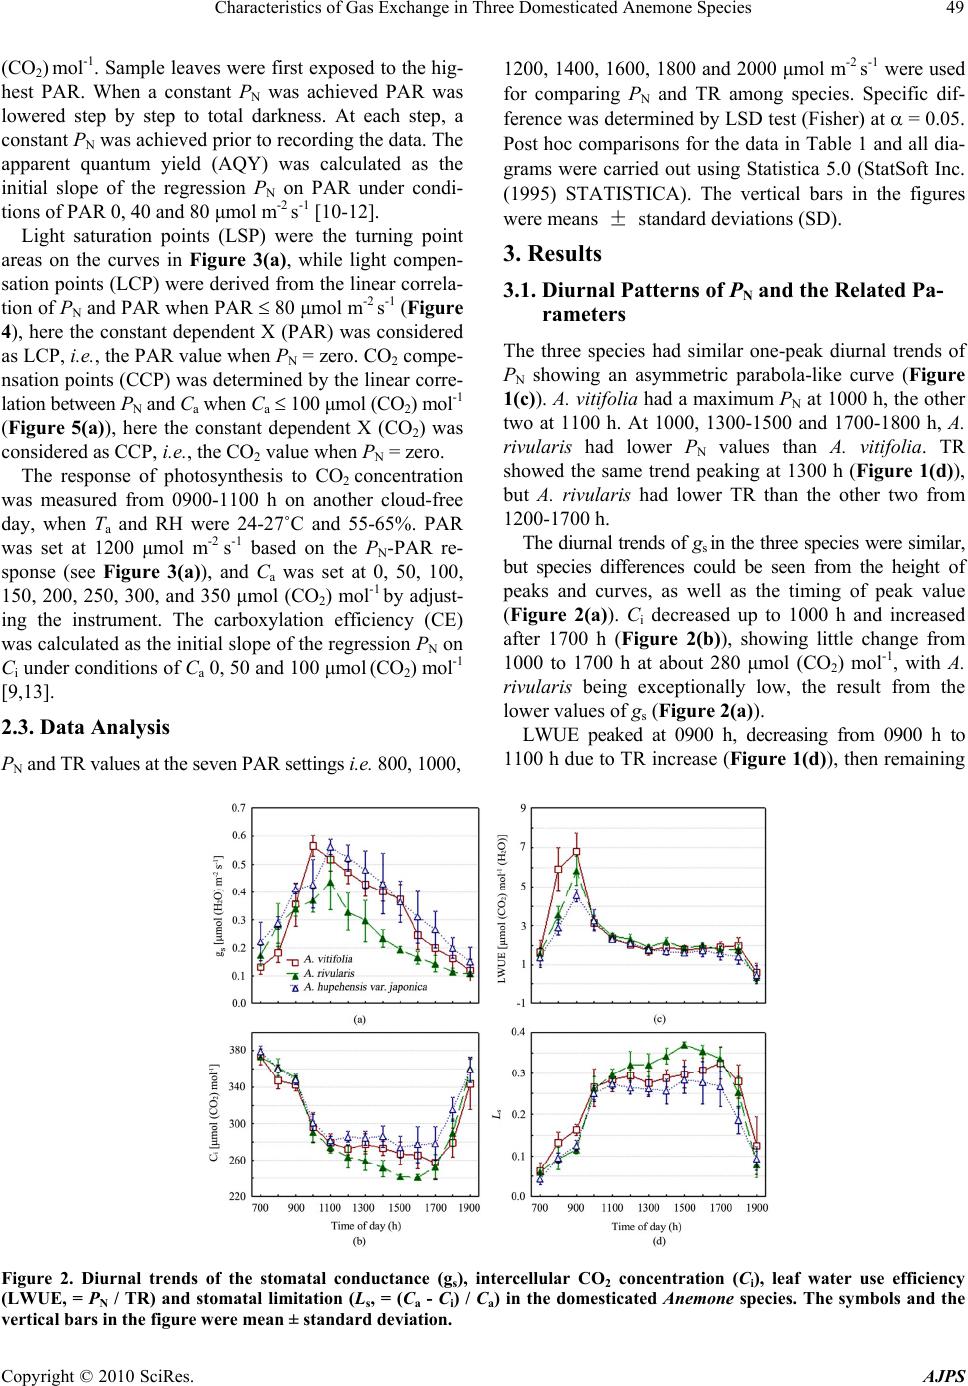 Characteristics of Gas Exchange in Three Domesticated Anemone Species Copyright © 2010 SciRes. AJPS 49 (CO2) mol-1. Sample leaves were first exposed to the hig- hest PAR. When a constant PN was achieved PAR was lowered step by step to total darkness. At each step, a constant PN was achieved prior to recording the data. The apparent quantum yield (AQY) was calculated as the initial slope of the regression PN on PAR under condi- tions of PAR 0, 40 and 80 μmol m-2 s-1 [10-12]. Light saturation points (LSP) were the turning point areas on the curves in Figure 3(a), while light compen- sation points (LCP) were derived from the linear correla- tion of PN and PAR when PAR 80 μmol m-2 s-1 (Figure 4), here the constant dependent X (PAR) was considered as LCP, i.e., the PAR value when PN = zero. CO2 compe- nsation points (CCP) was determined by the linear corre- lation between PN and Ca when Ca 100 μmol (CO2) mol-1 (Figure 5(a)), here the constant dependent X (CO2) was considered as CCP, i.e., the CO2 value when PN = zero. The response of photosynthesis to CO2 concentration was measured from 0900-1100 h on another cloud-free day, when Ta and RH were 24-27˚C and 55-65%. PAR was set at 1200 μmol m-2 s-1 based on the PN-PAR re- sponse (see Figure 3(a)), and Ca was set at 0, 50, 100, 150, 200, 250, 300, and 350 μmol (CO2) mol-1 by adjust- ing the instrument. The carboxylation efficiency (CE) was calculated as the initial slope of the regression PN on Ci under conditions of Ca 0, 50 and 100 μmol (CO2) mol-1 [9,13]. 2.3. Data Analysis PN and TR values at the seven PAR settings i.e. 800, 1000, 1200, 1400, 1600, 1800 and 2000 μmol m-2 s-1 were used for comparing PN and TR among species. Specific dif- ference was determined by LSD test (Fisher) at = 0.05. Post hoc comparisons for the data in Table 1 and all dia- grams were carried out using Statistica 5.0 (StatSoft Inc. (1995) STATISTICA). The vertical bars in the figures were means ± standard deviations (SD). 3. Results 3.1. Diurnal Patterns of PN and the Related Pa- rameters The three species had similar one-peak diurnal trends of PN showing an asymmetric parabola-like curve (Figure 1(c)). A. vitifolia had a maximum PN at 1000 h, the other two at 1100 h. At 1000, 1300-1500 and 1700-1800 h, A. rivularis had lower PN values than A. vitifolia. TR showed the same trend peaking at 1300 h (Figure 1(d)), but A. rivularis had lower TR than the other two from 1200-1700 h. The diurnal trends of gs in the three species were similar, but species differences could be seen from the height of peaks and curves, as well as the timing of peak value (Figure 2(a)). Ci decreased up to 1000 h and increased after 1700 h (Figure 2(b)), showing little change from 1000 to 1700 h at about 280 μmol (CO2) mol-1, with A. rivularis being exceptionally low, the result from the lower values of gs (Figure 2(a)). LWUE peaked at 0900 h, decreasing from 0900 h to 1100 h due to TR increase (Figure 1(d)), then remaining Figure 2. Diurnal trends of the stomatal conductance (gs), intercellular CO2 concentration (Ci), leaf water use efficiency (LWUE, = PN / TR) and stomatal limitation (Ls, = (Ca - Ci) / Ca) in the domesticated Anemone species. The symbols and the vertical bars in the figure were mean ± standard deviation. 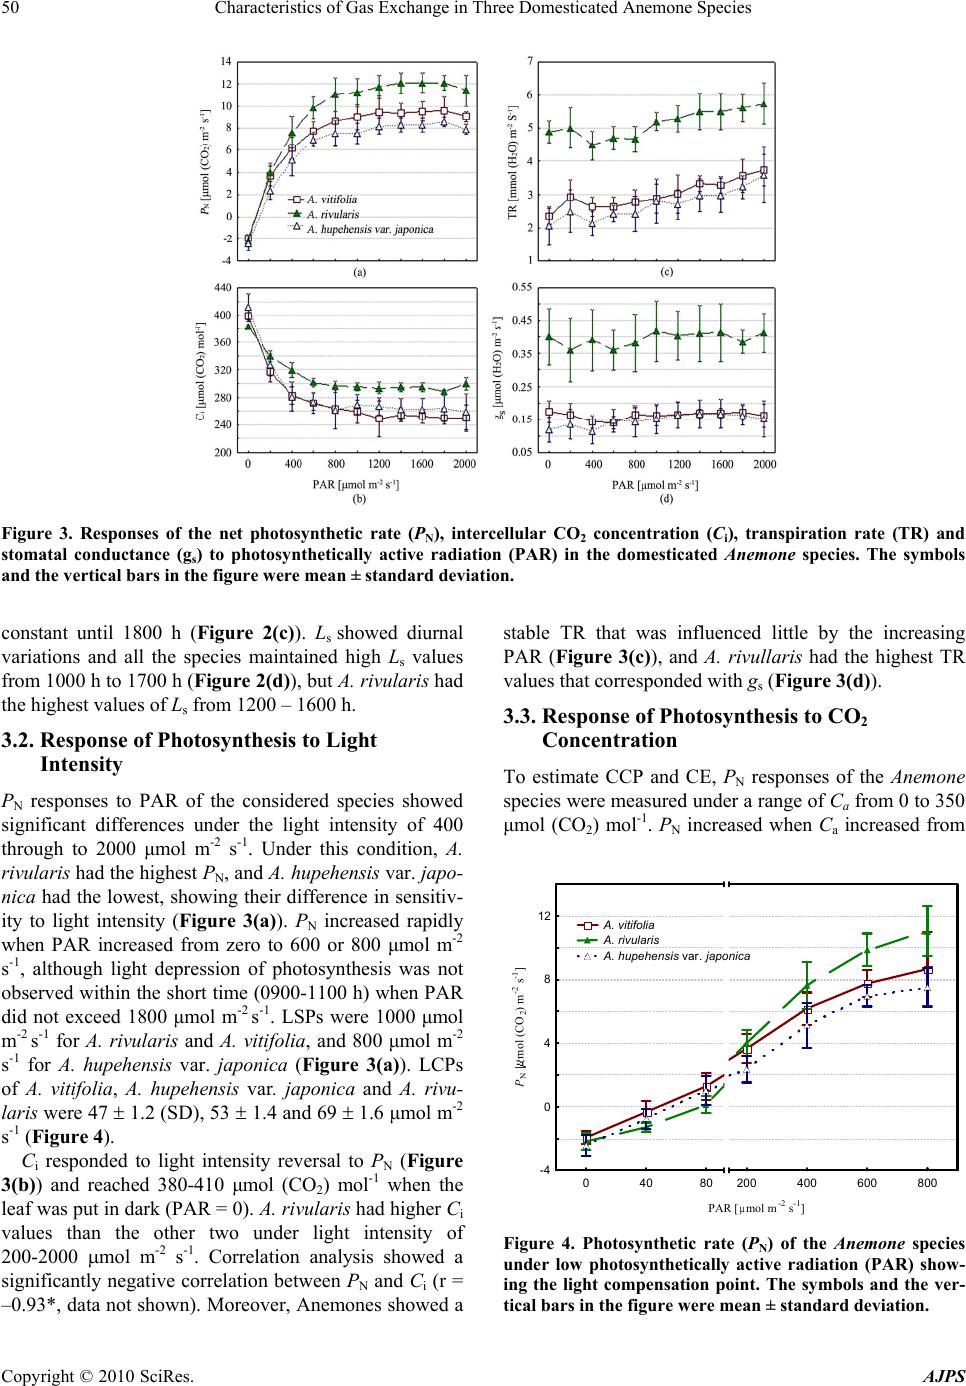 Characteristics of Gas Exchange in Three Domesticated Anemone Species Copyright © 2010 SciRes. AJPS 50 Figure 3. Responses of the net photosynthetic rate (PN), intercellular CO2 concentration (Ci), transpiration rate (TR) and stomatal conductance (gs) to photosynthetically active radiation (PAR) in the domesticated Anemone species. The symbols and the vertical bars in the figure were mean ± standard deviation. constant until 1800 h (Figure 2(c)). Ls showed diurnal variations and all the species maintained high Ls values from 1000 h to 1700 h (Figure 2(d)), but A. rivularis had the highest values of Ls from 1200 – 1600 h. 3.2. Response of Photosynthesis to Light Intensity PN responses to PAR of the considered species showed significant differences under the light intensity of 400 through to 2000 μmol m-2 s -1. Under this condition, A. rivularis had the highest PN, and A. hupehensis var. japo- nica had the lowest, showing their difference in sensitiv- ity to light intensity (Figure 3(a)). PN increased rapidly when PAR increased from zero to 600 or 800 μmol m-2 s-1, although light depression of photosynthesis was not observed within the short time (0900-1100 h) when PAR did not exceed 1800 μmol m-2 s-1. LSPs were 1000 μmol m-2 s-1 for A. rivularis and A. vitifolia, and 800 μmol m-2 s-1 for A. hupehensis var. japonica (Figure 3(a)). LCPs of A. vitifolia, A. hupehensis var. japonica and A. rivu- laris were 47 1.2 (SD), 53 1.4 and 69 1.6 μmol m-2 s-1 (Figure 4). Ci responded to light intensity reversal to PN (Figure 3(b)) and reached 380-410 μmol (CO2) mol-1 when the leaf was put in dark (PAR = 0). A. rivularis had higher Ci values than the other two under light intensity of 200-2000 mol m-2 s -1. Correlation analysis showed a significantly negative correlation between PN and Ci (r = –0.93*, data not shown). Moreover, Anemones showed a stable TR that was influenced little by the increasing PAR (Figure 3(c)), and A. rivullaris had the highest TR values that corresponded with gs (Figure 3(d)). 3.3. Response of Photosynthesis to CO2 Concentration To estimate CCP and CE, PN responses of the Anemone species were measured under a range of Ca from 0 to 350 μmol (CO2) mol-1. PN increased when Ca increased from 04080200 400 600 800 PAR [ mol m -2 s -1 ] -4 0 4 8 12 PN [mol (CO2) m-2 s-1] A. vitifolia A. rivularis A. hupehensis var. japonica Figure 4. Photosynthetic rate (PN) of the Anemone species under low photosynthetically active radiation (PAR) show- ing the light compensation point. The symbols and the ver- tical bars in the figure were mean ± standard deviation.  Characteristics of Gas Exchange in Three Domesticated Anemone Species Copyright © 2010 SciRes. AJPS 51 Figure 5. Responses of the net photosynthetic rate (PN) and intercellular CO2 concentration (Ci) to ambient CO2 con- centration (Ca) in the domesticated Anemone species. The symbols and the vertical bars in the figure were mean± standard deviation. 0 to 350 μmol (CO2) mol-1, showing insignificant differe- nces among the considered species (Figure 5(a)). Ci sho- wed same response to the change of Ca (Figure 5(b)). CCP was 47 1.0 (SD) μmol (CO2) mol-1 for A. vitifolia, 53 1.1 for A. rivularis and 56 1.4 for A. hupehensis var. japonica (Figure 5( a )). 3.4. Differences in PN, TR, CE, AQY and Biomass PN and TR were compared according to the data of PN / TR-PAR responses within PAR 800-2000 μmol m-2 s-1 and showed significant specific difference (Table 1). A. rivularis had the highest PN and TR, while A. hupehensis var. japonica had the lowest. The specific difference was observed in biomass that showed a close correlation with PN (r = 0.991*, Table 1). CE varied from 0.036 to 0.049 among the species with A. rivularis having the highest CE. The specific differ- ence in CE showed a close correlation with PN values (r = 0.999*, Table 1). AQY was in the range 0.023 to 0.032; A. rivularis again had the highest value. AQY was also closely associated with PN values (r = 0.999*, Table 1). 4. Discussion 4.1. Diurnal Trend of Photosynthetic Rate In this experiment, the major environmental factors, PAR, Ta and air RH changed remarkably during the day as shown in Figures 1(a), (b). This situation is normal at our experimental site and is the driver of PN daily change. No increase of PN was observed in the afternoon while a midday depression in photosynthesis was found in Anemone species collected from the alpine region in suburban areas of Kunming (1896 m a.s.l.). PN increased before 1000 or 1100 h and decreased from 1000 or 1100 h (dependent on species) onwards. The increase of PN in the morning was driven by the increase of PAR and gs (Fig- ures 1(a), (c); Figure 2(a)), and decrease of PN from the late morning to the afternoon was caused by the decrease of gs (Figure 1(c); Figure 2(a)). A close link between PN and gs and/or PAR (only in the morning) was observed in the investigation of the diurnal trends of photosynthetic rate for Ginkgo biloba, Paspalum notatum, and Enkleia malaccensis [14-16]. Whereas gs decrease in this ex- periment resulted from the integrative action of adverse ecological factors such as the rise of Ta (> 30˚C), de- crease of air RH (< 35%) and Ca (< 386 μmol (CO2) mol-1), and strong light (> 1500 μmol m-2 s-1) (Figures 1(a), (b)). A strong light of no more than 1800 μmol m-2 s-1 did not depress the photosynthesis of the Anemones in the field (Figure 3(a)). This may reflect the intrinsic adaptation of the Anemone species to the mild ecological environments in their native habitats of moderate Ta, higher air RH but strong light. The decrease of gs from 1000 or 1100 h on- wards and the decrease of TR in the afternoon were caused by the increase of stomatal limitation (Ls) Table 1. Carboxylation efficiency (CE), apparent quantum yield (AQY), Photosynthetic rate (PN), transpiration rate (TR) and biomass of the Anemone species. Taxon CE AQY PN TR Biomass (kg m-2) A. rivularis 0.0491 0.0014a 0.0317 0.0005a 11.68 0.448a 5.36 0.354a 1.02 0.055a A. vitifolia 0.0417 0.0011b 0.0275 0.0007b 9.25 0.346b 3.22 0.351b 0.83 0.071b A. hupehensis var. japonica 0.0355 0.0013c 0.0229 0.0009c 8.05 0.420c 2.96 0.372b 0.78 0.069b PN and TR values at the seven PAR settings i.e. 800, 1000, 1200, 1400, 1600, 1800 and 2000μmol m-2 s-1 were used for comparing PN and TR among species. Numbers in the table are means SD. Same letters show no statistical difference among species by LSD test (Fisher) at = 0.05. Correlation coefficients of PN –AQY and PN–Biomass were 0.999* and 0.991*.  Characteristics of Gas Exchange in Three Domesticated Anemone Species Copyright © 2010 SciRes. AJPS 52 (Figure 1(d); Figures 2(a), (d)). Here TR seemed to have a delayed response to the change of Ls, but in fact TR was tightly linked to the increasing Ta, PAR and va- por pressure deficit based on leaf temperature (VpdL), and decreasing RH (Correlation coefficients of TR with PAR, Ta, VpdL and RH were derived as 0.89*, 0.86*, 0.61* and –0.72*, respectively) (data not shown). This led to a high level of TR around noon even though at this time gs decreased and/or Ls increased. Therefore, PAR, Ta and RH were the major drivers of TR (Figures 1(a), (b) and (d)), as VpdL negatively correlated with RH (r = –0.94*) (data not shown). The decrease of Ci is the major criterion for verifying Ls if PN decreased or stayed at a low level [17]. In our experiment, Ci obviously decreased in the morning be- fore 1100 h that reflected the normal changes from night (where Ci increased over time because of respiration) to daytime from increased intercellular CO2 use resulting from increasing photosynthesis. The decrease of Ci in A. rivularis from 1100 h until 1600 h (Figure 2(b)) was likely caused by the decrease of gs (Figure 2(a)) since PN decreased as well during this period (Figure 1(c)) and water stress was avoided by watering. Based on the above argument, the decrease of PN from the late morn- ing to the afternoon was mainly caused by a shortage of CO2 resulted from an increase of Ls and decrease of gs (Figure 1(c); Figures 2(a), (d)). It is well known that the increase of Ci is the reason for non-stomatal limitation of photosynthesis when PN is at a low level [18]. Therefore, the rapid decrease of PN after 1700 h was caused by an increase of non-stomatal limitation (e.g., carboxylation resistance) that quite likely resulted from the decrease of PAR (Figure 1(a)), for even if gs was at a low level, Ci increased and Ls decreased rapidly during this time. There is a strong correlation between PN and gs because stomata respond to the changes in assimilation via Ci. Correlation analysis revealed a significantly positive correlation between PN and gs (r = 0.77*), and a negative correlation between PN and Ci (r = –0.73*) (data not shown). When PAR was set to zero, the PN values of –2.5- –2.0 μmol (CO2) m-2 s-1 might reflected the respiration rates of the Anemones under the experimental conditions (Figure 4). 4.2. Response of Photosynthesis to Light Intensity In lettuce [19], tobacco [20], and Phaseolus vulgaris [21], PN along with the increase of light intensity increased to a peak, then decreased if the light intensity increased further. However, in ramie (Boehmeria nivea (L.) Gaud.) [22], tomato [23], cucumber [17], and cotton [24], as lig- ht intensity increased, PN increased and kept on at a high level within a wide range of light intensity. The depres- sion of photosynthesis in tobacco when PAR > 600 μmol m-2 s-1 was due to the reduction in activities of PSI and PSII, carbonic anhydrase and electron transfer speed [20]. A large decrease in stomatal conductance to water va- pour in Phaseolus vulgaris leaves exposed to strong light was found [21]. In our experiments, strong light of no more than PAR 1800 μmol m-2 s-1 did not depress photosynthesis, althou- gh differences were observed in utilization of light ene- rgy under high light intensity (Figure 3(a)) with ade- quate soil water, Ta 23-30˚C and RH 45-65%. Further- more, the sample leaf was put under a strong light for a few minutes for achieving a constant PN before going to a lower PAR. Therefore, it needs more investigations to uncover whether or not the Anemone species have a photosystem insensitive to the change of light intensity. The experiment results, based on single leaf test, sug- gested that PAR 800-1000 μmol m-2 s -1 is enough for a satisfactory PN and meets the needs for photosynthetic products for normal growth and development of Anem- one cultivation. Among the three species, A. rivularis was from a grass hillside under sparse trees with good sunshine and had a different response to light from other species, showing a high LCP and LSP. Whereas, A. hupehensis var. japonica was from a limestone wall with only intermittent sunshi- ne and is probably less well adapted to continuous strong light. The light response data, low LCP and LSP, and low maximum PN value all indicated that this species is the best one to grow under partial shade. 4.3. Response of Photosynthesis to CO2 Among PN, TR, gs, and Ci, only PN and Ci were observed to increase regularly as Ca increased, and the response of PN and Ci to the change of Ca showed little difference am- ong the species (Figures 5(a), (b)). When Ca was set to zero, PN was –3 μmol (CO2) m-2 s-1 (Figure 5(a)) which was roughly considered as the sum of respiration and photorespiration under the experimental conditions. This was unlike the PN values at PAR = 0 μmol m-2 s-1 where the minus PN values just presented the respiration rates. The CO2 saturation curve of photosynthesis in the con- sidered species is still in need of study. A higher CCP (60-75 μmol (CO2) mol-1), but a much lower LCP (13-28 μmol m-2 s -1), and similar diurnal curves of PN and TR were observed in domesticated Pri- mula species collected from an alpine area of north-wes- tern Yunnan Province, China [25]. This reflected the si- milarity in photosynthetic daily patterns of Anemones and Primulas as alpine plants, and the dissimilarity in light and CO2 utilization qualities of plants of the two genera, which should be taken into consideration for their cultivation.  Characteristics of Gas Exchange in Three Domesticated Anemone Species Copyright © 2010 SciRes. AJPS 53 5. Conclusions The Anemone species described here showed similar one- peak diurnal trends of PN, although A. rivularis had lo- wer TR, gs, and Ci, and higher Ls in the afternoon. Spec- ific differences in response of PN to PAR were observed, especially under strong light. A. rivularis had the highest PN and Ci under strong light which corresponded with its high gs and TR. A. rivularis had the highest LSP (1000 mol m-2 s-1) and LCP (69 mol m-2 s-1), while A. hupe- hensis var. japonica had the lowest LSP (800 mol m-2 s-1) and a lower LCP (53 mol m-2 s-1). All these species responded similarly to the change of Ca from 0 to 350 mol (CO2) mol-1, and their CCP showed little difference. Moreover, A. rivularis had the highest AQY, CE, PN and TR based on the PN-PAR response. In conclusion, A. rivularis is able to grow well under higher radiation, while A. hupehensis var. japonica is the best one to grow under partial shade. 6. Acknowledgements The authors are grateful to the reading and comments given by Gordon Rowland, University of Saskatchewan. Thanks are expressed to Su WH of Yunnan University for his kind help in the equipment operation. REFERENCES [1] Y. L. Yuan, J. L. Zhao and W. P. XU, “Anemone of Mor- phology Characteristic and Introduction Apply Study,” Acta Botanica Boreali-Occidentalia Sinica, Vol. 17, No. 5, 1997, pp. 134-136. [2] Botanical Institute of Kunming CAoS, “Flora Yunna- nica,” Science Press, Beijing, Vol. 11, 2000, pp. 183-204. [3] M. Y. Fang and M. Y. Yang, “A Study on Pollen Morph- ology and Evolution of the Genus Anemone from Sichu- an,” Journal of Sichuan University, Vol. 31, No. 2, 1994, pp. 246-258. [4] Q. E. Yang, “Cytology of Ten Species in Anemone, One in Anemoclema and Six in Clematis (Trib. Anemoneae, Ranunc ulace ae) form China,” Acta Phytotaxonomica Sinica, Vol. 40, No. 5, 2002, pp. 396-405. [5] S. B. Hoot, “Phylogenetic Relationships in Anemone (Ranu- culaceae) Based on Morphology and Chloroplast DNA,” Systematic Botany, Vol. 19, No. 1, 1994, pp. 169-200. [6] Y. Jacob, “Breeding of Anemone Coronaria Tetraploid Hybrids,” Proceedings of the Seventh International Sym- posium on Flower Bulbs, Vol. II, Herzliya, Israel. Acta Horticulturae, Vol. 430, 1997, pp. 503-508. [7] T. Lindell, “Breeding Systems and Crossing Experiments in Anemone Patens and in the Anemone Pulsatilla Group (Ranunculaceae),” Nordic Journal of Botany, Vol. 18, No. 5, 1998, pp. 549-561. [8] J. J. Vacher, “Responses of Two Main Andean Crops, Quinoa (Chenopodium quinoa Willd) and Papa Amarga (Solanum juzepczukii Buk.) to Drought on the Bolivian Altiplano: Significance of Local Adaptation,” Agriculture, Ecosystems & Environment, Vol. 68, No. 1-2, 1998, pp. 99-108. [9] G. D. Farquhar and T. D. Sharkey, “Stomatal Conduc- tance and Photosynthesis,” Annual Review of Plant Phys- iology, Vol. 33, 1982, pp. 317-345. [10] J. Ehleringer and O. Björkman, “Quantum Yields for CO2 Uptake in C3 and C4 Plants,” Plant Physiology, Vol. 59, No. 1, 1977, pp. 86-90. [11] J. Ehleringer and R. W. Pearcy, “Variation in Quantum Yield for CO2 Uptake among C3 and C4 Plants,” Plant Physiology, Vol. 73, No. 3, 1983, pp. 555-559. [12] Z. Y. Tao and Q. Zou, “Effect of Strong Irradiance and Shortly Elevated CO2 Concentrations on Photosynthetic Efficiencies in Maize and Soybean Leaves,” Acta Botanica Boreali-Occidentalia Sinica, Vol. 25, No. 2, 2005, pp. 244-249. [13] Z. J. Wang, T. C. Guo, Y. J. Zhu, Y. H. Wang, J. H. Wang and M. Zhao, “Comparison of CO2 Assimilation Capacity in Flag Leaf for Super High Yield Wheat with Different Spike Type,” Acta Agronomica Sinica, Vol. 30, No. 8, 2004, pp. 739-744. [14] S. Pandey, S. Kumar and P. K. Nagar, “Photosynthetic Performance of Ginkgo Biloba L. Grown under High and Low Irradiance,” Photosynthetica, Vol. 41, No. 4, 2003, pp. 505- 511. [15] R. V. Ribeiro, G. B. Lyra, A. V. Santiago, A. R. Pereira, E. C. Machado and R. F. Oliveira, “Diurnal and Seasonal Patterns of Leaf Gas Exchange in Bahiagrass (Paspalum Notatum Flugge) Growing in A Subtropical Climate,” Grass and Forage Science, Vol. 61, No. 3, 2006, pp. 293 -303. [16] A. C. Tay, A. M. Abdullah, M. Awang and A. Furukawa, “Midday Depression of Photosynthesis in Enkleia Ma- laccensis, a Woody Climber in a Tropical Rainforest,” Photosynthetica, Vol. 45, No. 2, 2007, pp. 189-193. [17] D. H. Ma, J. A. Pang, Z. R. He and S. J. Li, “Effect of Environmental Factors on the Photosynthetic Characteris- tics of Cucumber Seedlings,” Acta Botanica Boreali-Occ- identalia Sinica, Vol. 12, No. 4, 1997, pp. 97-100. [18] D. Q. Xu, “Some Problems in Stomatal Limitation Analy- sis of Photosynthesis,” Plant Physiology Communications, Vol. 33, No. 4, 1997, pp. 241-244. [19] P. P. Li, Y. G. Hu, Y. G. Zhao, X. J. Ying and H. P. Mao, “Comprehensive Model on the Effect of CO2 Enrichment on Lettuce Photosynthesis in Greenhouse,” Transaction of the CSAE, Vol. 17, No. 3, 2001, pp. 75-79. [20] L. Jiang, S. Q. Cao, X. Dai and X. M. Xu, “Effect of Dif- ferent Light Intensity on Photosynthesis of Tobacco,” Journal of Chinese Tobacco, Vol. 6, No. 4, 2000, pp. 17-20. [21] L. Guidi, M. Tonini and G. F. Soldatini, “Effects of High Light and Ozone Fumigation on Photosynthesis in Phase- olus Vulgaris,” Plant Physiology and Biochemistry, Vol. 38, No. 9, 2000, pp. 717-725.  Characteristics of Gas Exchange in Three Domesticated Anemone Species Copyright © 2010 SciRes. AJPS 54 [22] Q. Q. Guo, “Study on the Photosynthetic Characteristics of Ramie Leaves in Different Varieties and Their Rela- tionship with Yield Formation of Ramie. II. The Physiol- Ecological Characteristics of Leaf in Photosynthesis,” Journal of Hunan Agricultural College, Vol. 17, No. 3, 1993, pp. 76-79. [23] C. Stanghellini and J. A. Bunce, “Response of Photosyn- thesis and Conductance to Light, CO2, Temperature and Humidity in Tomato Plants Acclimated to Ambient and Elevated CO2,” Photosynthetica, Vol. 29, 1993, pp. 487 -497. [24] H. Z. Dong, W. J. Li, W. Tang and Z. H. Li, “Photosyn- thetic Characteristics of Field Grown Cotton Leaves,” Sh- angdong Agricultural Science, No. 6, 2000, pp. 7-10. [25] F. H. Liu, S. M. Hou and X. N. Liang, “Gas Exchange Characteristics of Four Domesticated Primula Species,” New Zealand Journal of Crop and Horticultural Science, Vol. 34, 2006, pp. 403-411. |