Paper Menu >>
Journal Menu >>
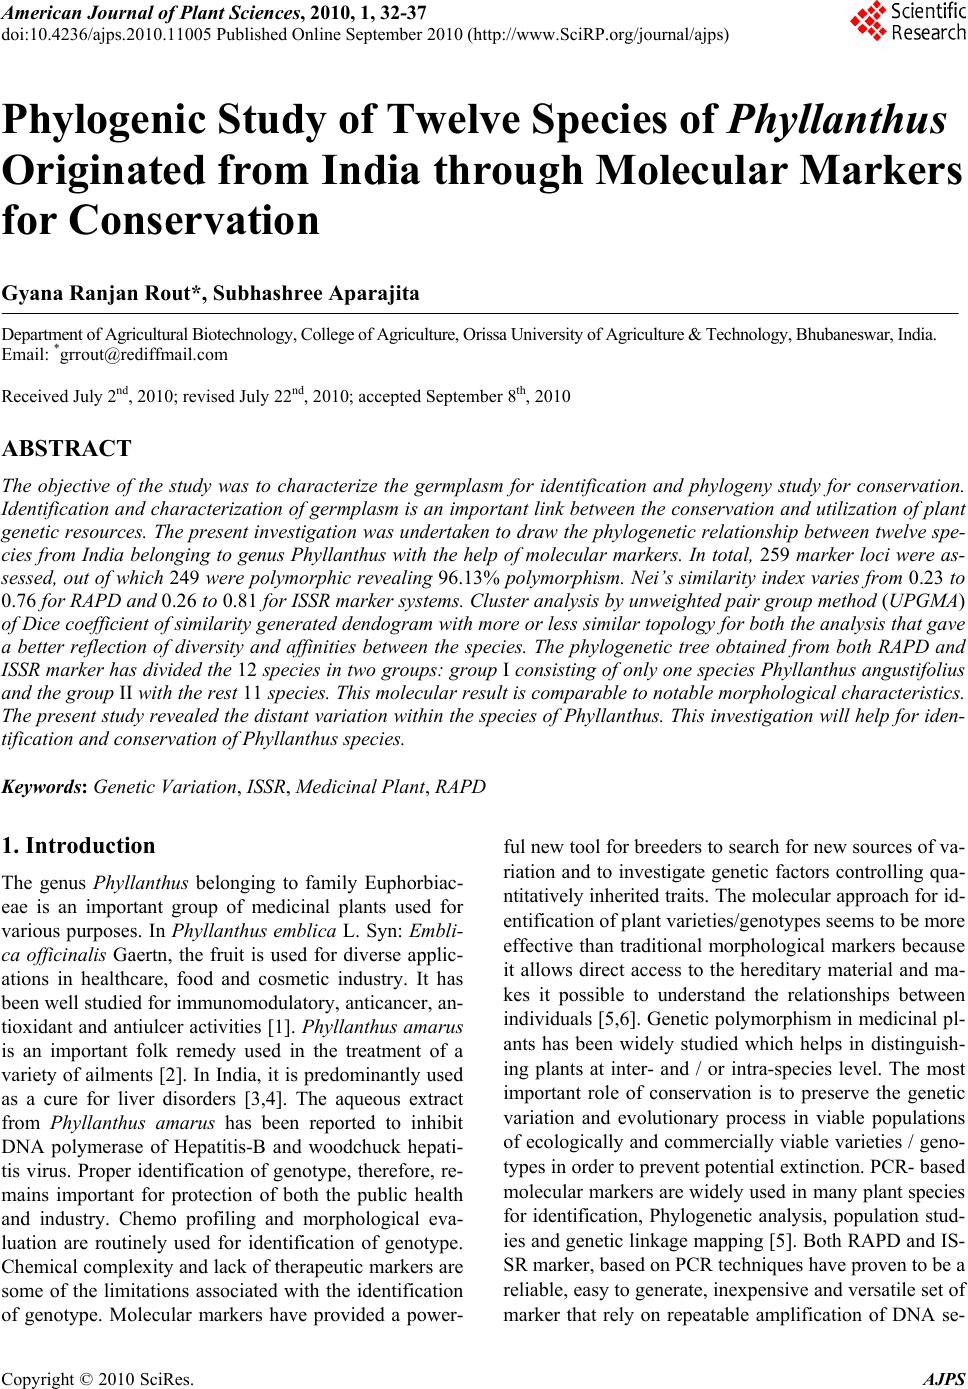 American Journal of Plant Sciences, 2010, 1, 32-37 doi:10.4236/ajps.2010.11005 Published Online September 2010 (http://www.SciRP.org/journal/ajps) Copyright © 2010 SciRes. AJPS Phylogenic Study of Twelve Species of Phyllanthus Originated from India through Molecular Markers for Conservation Gyana Ranjan Rout*, Subhashree Aparajita Department of Agricultural Biotechnology, College of Agriculture, Orissa University of Agriculture & Technology, Bhubaneswar, India. Email: *grrout@rediffmail.com Received July 2nd, 2010; revised July 22nd, 2010; accepted September 8th, 2010 ABSTRACT The objective of the study was to characterize the germplasm for identification and phylogeny study for conservation. Identification and characterization of germplasm is an important link b etween the conservation and utilization o f plant genetic resources. The present investigation was undertaken to draw the phylogenetic relationship between twelve spe- cies from India belonging to genus Phyllanthus with the help of molecular markers. In total, 259 marker loci were as- sessed, out of which 249 were polymorphic revealing 96.13% polymorphism. Nei’s similarity index varies from 0.23 to 0.76 for RAPD and 0.26 to 0.81 for ISSR marker systems. Cluster analysis by unweighted pair group method (UPGMA) of Dice coefficient of similarity genera ted dendogram with more or less similar topo logy for both the analysis that gave a better reflection of diversity and affinities between the species. The phylogenetic tree obtained from both RAPD and ISSR marker has divided the 12 species in two groups: group I consisting of only one species Phyllanthus angu stifolius and the group II with the rest 11 species. This molecular result is comparable to notable morpholog ical charac teristics. The present study revealed th e distant variation within the species of Phyllan thus. This investigation will help for iden- tification and conservation of Phyllanthus species. Keywords: Genetic Variation, ISSR, Medicinal Plant, RAPD 1. Introduction The genus Phyllanthus belonging to family Euphorbiac- eae is an important group of medicinal plants used for various purposes. In Phyllanthus emblica L. Syn: Embli- ca officinalis Gaertn, the fruit is used for diverse applic- ations in healthcare, food and cosmetic industry. It has been well studied for immunomodulatory, anticancer, an- tioxidant and antiulcer activities [1]. Phyllanthus amarus is an important folk remedy used in the treatment of a variety of ailments [2]. In India, it is predominantly used as a cure for liver disorders [3,4]. The aqueous extract from Phyllanthus amarus has been reported to inhibit DNA polymerase of Hepatitis-B and woodchuck hepati- tis virus. Proper identification of genotype, therefore, re- mains important for protection of both the public health and industry. Chemo profiling and morphological eva- luation are routinely used for identification of genotype. Chemical complexity and lack of therapeutic markers are some of the limitations associated with the identification of genotype. Molecular markers have provided a power- ful new tool for breeders to search for new sources of va- riation and to investigate genetic factors controlling qua- ntitatively inherited traits. The molecular approach for id- entification of plant varieties/genotypes seems to be more effective than traditional morphological markers because it allows direct access to the hereditary material and ma- kes it possible to understand the relationships between individuals [5,6]. Genetic polymorphism in medicinal pl- ants has been widely studied which helps in distinguish- ing plants at inter- and / or intra-species level. The most important role of conservation is to preserve the genetic variation and evolutionary process in viable populations of ecologically and commercially viable varieties / geno- types in order to prevent potential extinction. PCR- based molecular markers are widely used in many plant species for identification, Phylogenetic analysis, population stud- ies and genetic linkage mapping [5]. Both RAPD and IS- SR marker, based on PCR techniques have proven to be a reliable, easy to generate, inexpensive and versatile set of marker that rely on repeatable amplification of DNA se- 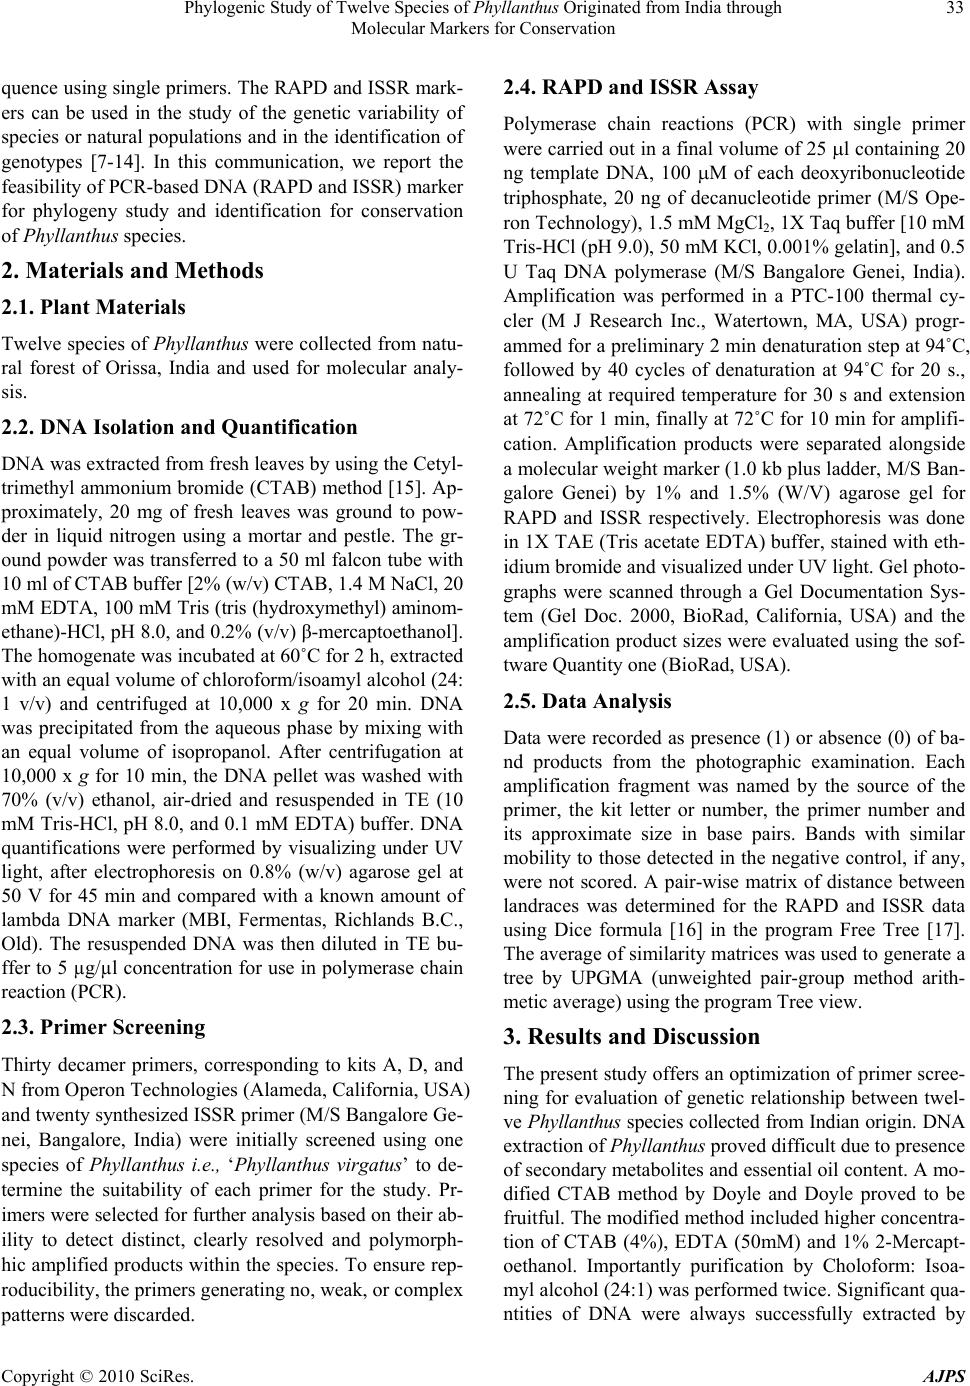 Phylogenic Study of Twelve Species of Phyllanthus Originated from India through Molecular Markers for Conservation Copyright © 2010 SciRes. AJPS 33 quence using single primers. The RAPD and ISSR mark- ers can be used in the study of the genetic variability of species or natural populations and in the identification of genotypes [7-14]. In this communication, we report the feasibility of PCR-based DNA (RAPD and ISSR) marker for phylogeny study and identification for conservation of Phyllanthus species. 2. Materials and Methods 2.1. Plant Materials Twelve species of Phyllanthus were collected from natu- ral forest of Orissa, India and used for molecular analy- sis. 2.2. DNA Isolation and Quantification DNA was extracted from fresh leaves by using the Cetyl- trimethyl ammonium bromide (CTAB) method [15]. Ap- proximately, 20 mg of fresh leaves was ground to pow- der in liquid nitrogen using a mortar and pestle. The gr- ound powder was transferred to a 50 ml falcon tube with 10 ml of CTAB buffer [2% (w/v) CTAB, 1.4 M NaCl, 20 mM EDTA, 100 mM Tris (tris (hydroxymethyl) aminom- ethane)-HCl, pH 8.0, and 0.2% (v/v) β-mercaptoethanol]. The homogenate was incubated at 60˚C for 2 h, extracted with an equal volume of chloroform/isoamyl alcohol (24: 1 v/v) and centrifuged at 10,000 x g for 20 min. DNA was precipitated from the aqueous phase by mixing with an equal volume of isopropanol. After centrifugation at 10,000 x g for 10 min, the DNA pellet was washed with 70% (v/v) ethanol, air-dried and resuspended in TE (10 mM Tris-HCl, pH 8.0, and 0.1 mM EDTA) buffer. DNA quantifications were performed by visualizing under UV light, after electrophoresis on 0.8% (w/v) agarose gel at 50 V for 45 min and compared with a known amount of lambda DNA marker (MBI, Fermentas, Richlands B.C., Old). The resuspended DNA was then diluted in TE bu- ffer to 5 µg/µl concentration for use in polymerase chain reaction (PCR). 2.3. Primer Screening Thirty decamer primers, corresponding to kits A, D, and N from Operon Technologies (Alameda, California, USA) and twenty synthesized ISSR primer (M/S Bangalore Ge- nei, Bangalore, India) were initially screened using one species of Phyllanthus i.e., ‘Phyllanthus virgatus’ to de- termine the suitability of each primer for the study. Pr- imers were selected for further analysis based on their ab- ility to detect distinct, clearly resolved and polymorph- hic amplified products within the species. To ensure rep- roducibility, the primers generating no, weak, or complex patterns were discarded. 2.4. RAPD and ISSR Assay Polymerase chain reactions (PCR) with single primer were carried out in a final volume of 25 l containing 20 ng template DNA, 100 M of each deoxyribonucleotide triphosphate, 20 ng of decanucleotide primer (M/S Ope- ron Technology), 1.5 mM MgCl2, 1X Taq buffer [10 mM Tris-HCl (pH 9.0), 50 mM KCl, 0.001% gelatin], and 0.5 U Taq DNA polymerase (M/S Bangalore Genei, India). Amplification was performed in a PTC-100 thermal cy- cler (M J Research Inc., Watertown, MA, USA) progr- ammed for a preliminary 2 min denaturation step at 94˚C, followed by 40 cycles of denaturation at 94˚C for 20 s., annealing at required temperature for 30 s and extension at 72˚C for 1 min, finally at 72˚C for 10 min for amplifi- cation. Amplification products were separated alongside a molecular weight marker (1.0 kb plus ladder, M/S Ban- galore Genei) by 1% and 1.5% (W/V) agarose gel for RAPD and ISSR respectively. Electrophoresis was done in 1X TAE (Tris acetate EDTA) buffer, stained with eth- idium bromide and visualized under UV light. Gel photo- graphs were scanned through a Gel Documentation Sys- tem (Gel Doc. 2000, BioRad, California, USA) and the amplification product sizes were evaluated using the sof- tware Quantity one (BioRad, USA). 2.5. Data Analysis Data were recorded as presence (1) or absence (0) of ba- nd products from the photographic examination. Each amplification fragment was named by the source of the primer, the kit letter or number, the primer number and its approximate size in base pairs. Bands with similar mobility to those detected in the negative control, if any, were not scored. A pair-wise matrix of distance between landraces was determined for the RAPD and ISSR data using Dice formula [16] in the program Free Tree [17]. The average of similarity matrices was used to generate a tree by UPGMA (unweighted pair-group method arith- metic average) using the program Tree view. 3. Results and Discussion The present study offers an optimization of primer scree- ning for evaluation of genetic relationship between twel- ve Phyllanthus species collected from Indian origin. DNA extraction of Phyllanthus proved difficult due to presence of secondary metabolites and essential oil content. A mo- dified CTAB method by Doyle and Doyle proved to be fruitful. The modified method included higher concentra- tion of CTAB (4%), EDTA (50mM) and 1% 2-Mercapt- oethanol. Importantly purification by Choloform: Isoa- myl alcohol (24:1) was performed twice. Significant qua- ntities of DNA were always successfully extracted by  Phylogenic Study of Twelve Species of Phyllanthus Originated from India through Molecular Markers for Conservation Copyright © 2010 SciRes. AJPS 34 this modified method that varied from 200 to 1000ng in different Phyllanthus species. The reproducibility of both RAPD and ISSR primer amplification were detected by performing separate runs of PCR with DNA extraction from different preparation. No significant differences were observed in different experiments although occa- sional variation in the intensities of individual bands was detected. Bands with same mobility were considered as identical fragments receiving equal values regardless of their staining ability. When multiple bands in a region were difficult to resolve, data of that region were not inc- luded for the analysis. As a result ten RAPD and eight ISSR primers were selected out of thirty RAPD and tw- enty ISSR primers screened, as they generated clear and scorable bands with considerable polymorphism. Using ten RAPD primers, 157 bands were produced with an average of ~ 16 bands per primer out of which 150 were polymorphic revealing 95.54% polymorphism. The size of the RAPD fragments ranged from 0.2 to 2.4 Kilo base pairs (Table 1). The banding profile by RAPD primer OPA-01 and OPD-18 has been shown in the Fig- ure 1. The primer OPA-01 amplified a maximum of 24 fragments whereas OPD-02 produced least number of am- plified bands (08). Similarly 102 amplified ISSR produ- cts were scored across 12 species of Phyllanthus by eight selected custom synthesized ISSR primers with 97.05% polymorphism. The average number of amplification pr- oducts per ISSR primer was ~ 13. The size of ISSR amp- lified fragments varied from 0.3-2.5 Kilo base pair (Ta- ble 2). The banding pattern by ISSR primer IG-10 and IG-14 are presented in Figure 2. The genetic variation through RAPD and ISSR markers has been highlighted in a nu- mber of medicinal plants [18-21]. The result shows that both the marker systems are efficient enough to distin- guish 12 species of Phyllanthus and in revealing mo- lecular relationship among them. The resolution of ISSR markers (97.08%) is high in comparison to RAPD mark- ers (95.54%). The similarity matrix of RAPD and ISSR data after multivariant analysis using Nei and Li’s coef- ficient has been presented in Tables 3 & 4 respectively. The similarity value ranged from 0.23 to 0.76 in case of RAPD and from 0.26 to 0.81 for ISSR. The similarity matrix obtained in the present study was used to con- struct a dendrogram with the UPGMA method by both RAPD and ISSR data (Figures 3 & 4). The dendograms generated by both the approaches (RAPD and ISSR) were with broad agreement with each other and also with accepted taxonomy; two major groups were obtained and most of the related species were found to be grouped together. Phyllanthus angustifolia, morphologically dis- tinct from the rest 11 species had been grouped isolated in group-I by both the molecular approaches. At the mo- lecular level Phyllanthus angustifolia is having six un- ique RAPD bands and five unique ISSR bands. The remaining eleven species positioned in group II are differentiated into two clad by both the marker sys- tem. The first clad having six species (Phyllanthus spp “Acc No-1”, Phyllanthus reticulus, Phyllanthus nivosus, Phyllanthus nivosus “varigata”, Phyllanthus acidus, Phy- llanthus emblica ) and other clad having five species (Ph- yllanthus flatarnus, Phyllanthus urinaria, Phyllanthus ro- tundifolius, Phyllanthus virgatus and Phyllanthus ama- rus). Phyllanthus acidus and Phyllanthus emblica as well as Phyllanthus nivosus and Phyllanthus nivosus “vari- gata” are grouped together by both the approaches, where Table 1. Total number of amplified fragments and number of polymorphic fragments generated by PCR using selected RAPD primers. Primer Primer sequence Total no. of bands No. of Polymorphic bands Polymorphism percentage No. of Unique bands Band range (kbp) OPA-01 5’-TGCCGAGCTG-3’ 24 24 100 3 0.4-2.1 OPA-04 5’-AATCGGGCTG-3’ 18 18 100 2 0.25-2.4 OPA-10 5’-GTGATCGCAG-3’ 20 20 100 3 0.3-2.3 OPD-02 5’-GGACCCAACC-3’ 8 7 87.4 2 0.5-1.8 OPD-11 5’-AGCGCCATTG-3’ 12 10 83.3 1 0.3-2.3 OPD-18 5’-GAGAGCCAAC-3’ 15 15 100 1 0.2-2.1 OPD-20 5’-ACCCGGTCAC-3’ 11 11 100 0 0.3-2.2 OPN-06 5’-GAGACGCACA-3’ 20 20 100 3 0.3-2.5 OPN-15 5’-GGTGAGGTCA-3’ 14 11 78.5 2 0.4-2.4 OPN-16 5’-AAGCGACCTG-3’ 15 14 93 2 0.2-3.0 TOTAL ---------------- 157 150 95.5 11 0.2-3.0  Phylogenic Study of Twelve Species of Phyllanthus Originated from India through Molecular Markers for Conservation Copyright © 2010 SciRes. AJPS 35 Figure 1. RAPD banding patterns of twelve species of Phyl- lanthus generated by the primer s OPA- 01 (A) and OPD-18 (B) M – Molecular weight ladder (kb). 1-Phyllanthus nivo- sus, 2-Phyllanthus flaternus, 3-Phyllanthus reticulus, 4-Ph- yllanthus acidus, 5-Phyllanthus nivosus “Varigata”, 6-Phy- llanthus spp “Àcc No.1”, 7-Phyllanthus rotundifolius, 8-Phy- llanthus angustifolius, 9-Phyllanthus emblica, 10-Phyllant- hus uninaria, 11-Phyllanthus virgatus, 12-Phyllanthus ama- rus. Figure 2. ISSR banding pattern in 12 species of Phyllanthus obtained from PCR amplification by ISSR primer IG-10(A) and IG-14(B). M indicates DNA size marker; 1-Phyllanthus nivosus, 2-Phyllanthus flaternus, 3-Phyllanthus reticulus, 4- Phyllanthus acidus, 5-Phyllanthus nivosus “Varigata”, 6-Ph- yllanthus spp “Àcc No.1”, 7-Phyllanthus rotundifolius, 8-Ph- yllanthus angustifolius, 9-Phyllanthus emblica, 10-Phyllan- thus uninaria, 11-Phyllanthus virgatus, 12-Phyllanthus am- arus. Table 2. Total number of amplified fragments and number of polymorphic fragments ge nerated by PCR using selected ISSR Primers. Primer Primer sequence Total no. of bands No. of Polymorphic bands Polymorphism percentage No. of Unique bands Band range (kbp) IG-01 5’AGGGCTGAGGAGGGC-3’ 12 12 100 1 0.5-1.6 IG-03 5’GAGGGTGGAGGATCT-3’ 8 08 100 1 0.5-1.6 IG-10 3’- (AG)8T-5’ 12 12 100 0 0.3-1.8 IG-11 3’- (AG) 8C-5’ 12 12 100 1 0.3-1.6 IG-13 3’- (AC) 8G-5’ 11 11 100 1 0.4-2.2 IG-14 3’- (GA) 88A-5’ 18 17 94.4 2 0.3-2.5 IG-15 3’- (GA) 8T-5’ 15 14 93.33 0 0.4-2.0 IG-23 3’- (GA) 8C-5’ 14 13 92.85 1 0.3-2.1 TOTAL -------------- 102 99 97.05 7 0.3-2.5 Table 3. Similarity matrix of 12 species of Phyllanthus generated by RAPD markers. P1 P2 P3 P4 P5 P6 P7 P8 P9 P10 P11 P12 P1 1.00 P2 0.31 1.00 P3 0.53 0.40 1.00 P4 0.57 0.43 0.50 1.00 P5 0.74 0.25 0.52 0.54 1.00 P6 0.45 0.49 0.51 0.48 0.50 1.00 P7 0.55 0.54 0.43 0.52 0.44 0.41 1.00 P8 0.41 0.23 0.41 0.33 0.39 0.29 0.36 1.00 P9 0.58 0.50 0.56 0.76 0.50 0.56 0.56 0.40 1.00 P10 0.38 0.37 0.43 0.46 0.38 0.46 0.54 0.35 0.45 1.00 P11 0.45 0.54 0.42 0.59 0.46 0.51 0.63 0.35 0.58 0.51 1.00 P12 0.41 0.41 0.35 0.47 0.45 0.44 0.52 0.36 0.45 0.55 0.72 1.00 P1-Phyllanthus nivosus, P2-Phyllanthus flaternus, P3-Phyllanthus reticulus, P4-Phyllanthus acidus, P5-Phyllanthus nivosus “Varigata”, P6-Phyllanthus spp “Àcc No.1”, P7-Phyllanthus rotundifolius, P8-Phyllanthus angustifolius, P9-Phyllanthus emblica, P10-Phyllanthus uninaria, P11-Phyllanthus virgatus, P12- Phyllanthus amarus.  Phylogenic Study of Twelve Species of Phyllanthus Originated from India through Molecular Markers for Conservation Copyright © 2010 SciRes. AJPS 36 Table 4. Similarity matrix of 12 species of Phyllanthus generated by ISSR markers. P1 P2 P3 P4 P5 P6 P7 P8 P9 P10 P11 P12 P1 1.00 P2 0.32 1.00 P3 0.37 0.29 1.00 P4 0.56 0.50 0.42 1.00 P5 0.81 0.36 0.32 0.64 1.00 P6 0.46 0.50 0.53 0.57 0.43 1.00 P7 0.47 0.41 0.42 0.39 0.55 0.46 1.00 P8 0.29 0.44 0.26 0.44 0.36 0.33 0.32 1.00 P9 0.57 0.50 0.48 0.72 0.55 0.52 0.47 0.38 1.00 P10 0.36 0.69 0.29 0.54 0.48 0.46 0.57 0.47 0.43 1.00 P11 0.43 0.48 0.28 0.45 0.53 0.41 0.57 0.37 0.41 0.57 1.00 P12 0.44 0.46 0.27 0.38 0.56 0.32 0.49 0.33 0.42 0.52 0.64 1.00 P1-Phyllanthus nivosus, P2-Phyllanthus flaternus, P3-Phyllanthus reticulus, P4-Phyllanthus acidus, P5-Phyllanthus nivosus “Varigata”, P6-Phyllanthus spp “Àcc No.1”, P7-Phyllanthus rotundifolius, P8-Phyllanthus angustifolius, P9-Phyllanthus emblica, P10-Phyllanthus uninaria, P11-Phyllanthus virgatus, P12- Phyllanthus amarus. Figure 3. Dendogram showing the cluster analysis of 12 spe- cies of Phyllanthus using RAPD markers. 1-Phyllanthus ni- vosus, 2-Phyllanthus flaternus, 3-Phyllanthus reticulus, 4- Phyllanthus acidus, 5-Phyllanthus nivosus “Varigata”, 6-Ph- yllanthus spp “Àcc No.1”, 7-Phyllanthus rotundifolius, 8- Phyllanthus angustifolius, 9-Phyllanthus emblica, 10-Phyll- anthus uninaria, 11-Phyllanthus virgatus, 12-Phyllanthus amarus. Figure 4. Dendrogram showing the cluster analysis of 12 sp- ecies of Phyllanthus using ISSR markers. 1-Phyllanthus ni- vosus, 2-Phyllanthus flaternus, 3-Phyllanthus reticulus, 4- Phyllanthus acidus, 5-Phyllanthus nivosus “Varigata”, 6-Ph- yllanthus spp “Àcc No.1”, 7-Phyllanthus rotundifolius, 8-Ph- yllanthus angustifolius, 9-Phyllanthus emblica, 10-Phyllant- hus uninaria, 11-Phyllanthus virgatus, 12-Phyllanthus ama- rus. as Phyllanthus spp “Acc No-1” and Phyllanthus reticulus forming single cluster in case of ISSR are grouped sepa- rately in RAPD approach. Phyllanthus amarus and Phy- llanthus virgatus in clad II is always grouped together in both the approaches. The differences in number of indi- viduals estimated by RAPD markers in this study are similar to the result obtained by Rajaseger et al. [22] in RAPD studies of the Ixora coccinea and Ixora. javanica. They also found that the taxa-specific RAPD and ISSR bands could be utilized to define the identification. The present findings include the identification and ge- netic variation within twelve species of Phyllanthus. The dendogram shows the distant variation within the species. The genetic relation through RAPD and ISSR markers provides a reliable method for identification of species than morphological characters. This investigation as an understanding of the level and partitioning of genetic variation within the species would provide an important input into determining efficient management strategies. The genetic variability in a gene pool is normally con- sidered as being the major resource available to breeders for improvement program. REFERENCES [1] W. Dnyaneshwar, C. Preeti, J. Kalpana and P. Bhushan, “Development and Application of RAPD-SCAR Marker 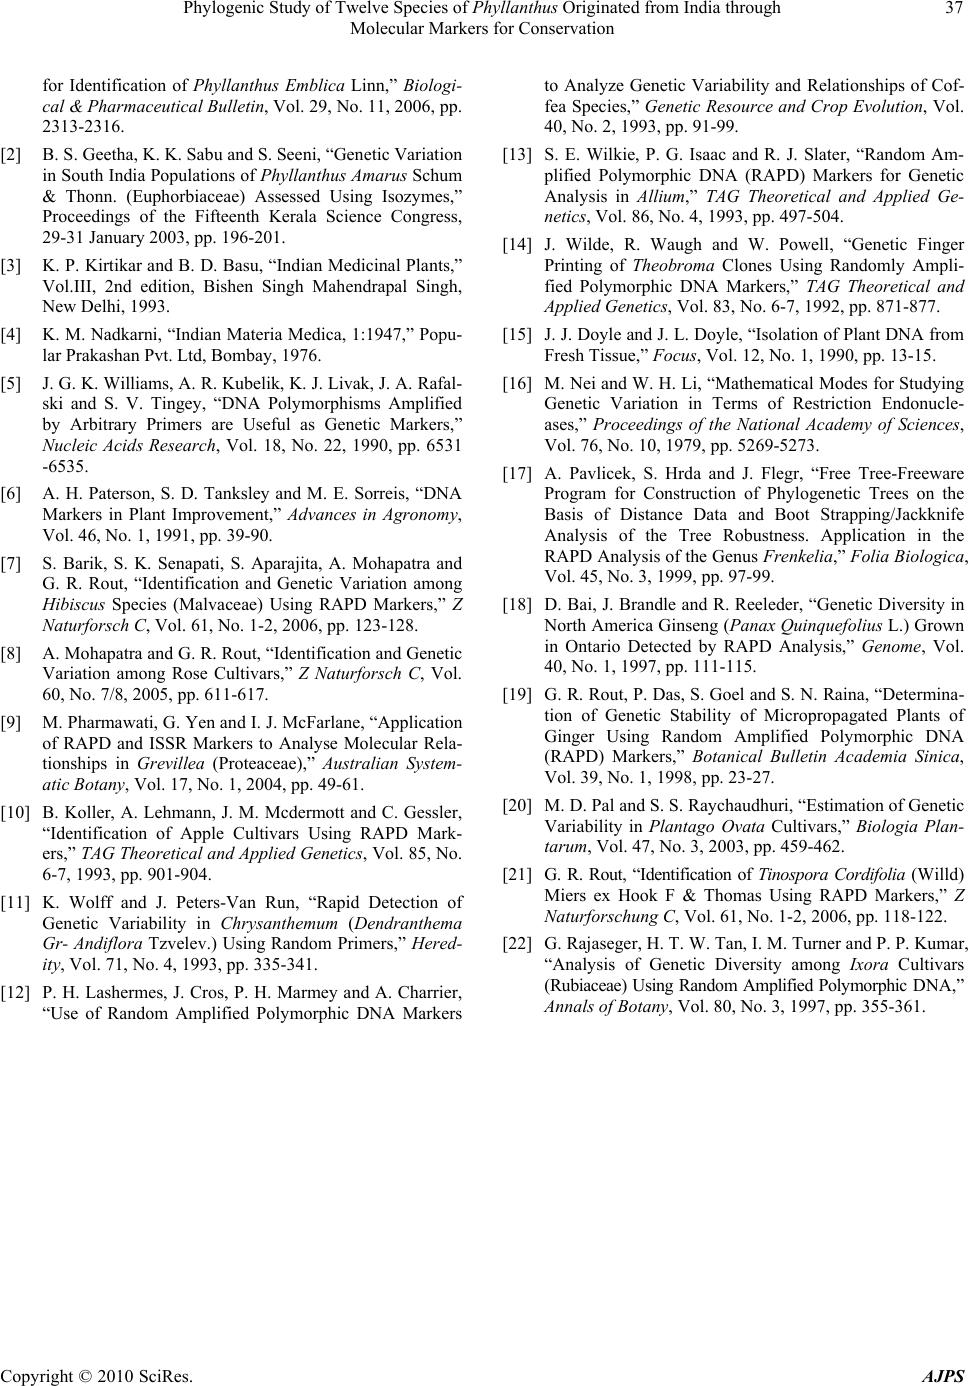 Phylogenic Study of Twelve Species of Phyllanthus Originated from India through Molecular Markers for Conservation Copyright © 2010 SciRes. AJPS 37 for Identification of Phyllanthus Emblica Linn,” Biologi- cal & Pharmaceutical Bulletin, Vol. 29, No. 11, 2006, pp. 2313-2316. [2] B. S. Geetha, K. K. Sabu and S. Seeni, “Genetic Variation in South India Populations of Phyllanthus Amarus Schum & Thonn. (Euphorbiaceae) Assessed Using Isozymes,” Proceedings of the Fifteenth Kerala Science Congress, 29-31 January 2003, pp. 196-201. [3] K. P. Kirtikar and B. D. Basu, “Indian Medicinal Plants,” Vol.III, 2nd edition, Bishen Singh Mahendrapal Singh, New Delhi, 1993. [4] K. M. Nadkarni, “Indian Materia Medica, 1:1947,” Popu- lar Prakashan Pvt. Ltd, Bombay, 1976. [5] J. G. K. Williams, A. R. Kubelik, K. J. Livak, J. A. Rafal- ski and S. V. Tingey, “DNA Polymorphisms Amplified by Arbitrary Primers are Useful as Genetic Markers,” Nucleic Acids Research, Vol. 18, No. 22, 1990, pp. 6531 -6535. [6] A. H. Paterson, S. D. Tanksley and M. E. Sorreis, “DNA Markers in Plant Improvement,” Advances in Agronomy, Vol. 46, No. 1, 1991, pp. 39-90. [7] S. Barik, S. K. Senapati, S. Aparajita, A. Mohapatra and G. R. Rout, “Identification and Genetic Variation among Hibiscus Species (Malvaceae) Using RAPD Markers,” Z Naturforsch C, Vol. 61, No. 1-2, 2006, pp. 123-128. [8] A. Mohapatra and G. R. Rout, “Identification and Genetic Variation among Rose Cultivars,” Z Naturforsch C, Vol. 60, No. 7/8, 2005, pp. 611-617. [9] M. Pharmawati, G. Yen and I. J. McFarlane, “Application of RAPD and ISSR Markers to Analyse Molecular Rela- tionships in Grevillea (Proteaceae),” Australian System- atic Botany, Vol. 17, No. 1, 2004, pp. 49-61. [10] B. Koller, A. Lehmann, J. M. Mcdermott and C. Gessler, “Identification of Apple Cultivars Using RAPD Mark- ers,” TAG Theoretical and Applied Genetics, Vol. 85, No. 6-7, 1993, pp. 901-904. [11] K. Wolff and J. Peters-Van Run, “Rapid Detection of Genetic Variability in Chrysanthemum (Dendranthema Gr- Andiflora Tzvelev.) Using Random Primers,” Hered- ity, Vol. 71, No. 4, 1993, pp. 335-341. [12] P. H. Lashermes, J. Cros, P. H. Marmey and A. Charrier, “Use of Random Amplified Polymorphic DNA Markers to Analyze Genetic Variability and Relationships of Cof- fea Species,” Genetic Resource and Crop Evolution, Vol. 40, No. 2, 1993, pp. 91-99. [13] S. E. Wilkie, P. G. Isaac and R. J. Slater, “Random Am- plified Polymorphic DNA (RAPD) Markers for Genetic Analysis in Allium,” TAG Theoretical and Applied Ge- netics, Vol. 86, No. 4, 1993, pp. 497-504. [14] J. Wilde, R. Waugh and W. Powell, “Genetic Finger Printing of Theobroma Clones Using Randomly Ampli- fied Polymorphic DNA Markers,” TAG Theoretical and Applied Genetics, Vol. 83, No. 6-7, 1992, pp. 871-877. [15] J. J. Doyle and J. L. Doyle, “Isolation of Plant DNA from Fresh Tissue,” Focus, Vol. 12, No. 1, 1990, pp. 13-15. [16] M. Nei and W. H. Li, “Mathematical Modes for Studying Genetic Variation in Terms of Restriction Endonucle- ases,” Proceedings of the National Academy of Sciences, Vol. 76, No. 10, 1979, pp. 5269-5273. [17] A. Pavlicek, S. Hrda and J. Flegr, “Free Tree-Freeware Program for Construction of Phylogenetic Trees on the Basis of Distance Data and Boot Strapping/Jackknife Analysis of the Tree Robustness. Application in the RAPD Analysis of the Genus Frenkelia,” Folia Biologica, Vol. 45, No. 3, 1999, pp. 97-99. [18] D. Bai, J. Brandle and R. Reeleder, “Genetic Diversity in North America Ginseng (Panax Quinquefolius L.) Grown in Ontario Detected by RAPD Analysis,” Genome, Vol. 40, No. 1, 1997, pp. 111-115. [19] G. R. Rout, P. Das, S. Goel and S. N. Raina, “Determina- tion of Genetic Stability of Micropropagated Plants of Ginger Using Random Amplified Polymorphic DNA (RAPD) Markers,” Botanical Bulletin Academia Sinica, Vol. 39, No. 1, 1998, pp. 23-27. [20] M. D. Pal and S. S. Raychaudhuri, “Estimation of Genetic Variability in Plantago Ovata Cultivars,” Biologia Plan- tarum, Vol. 47, No. 3, 2003, pp. 459-462. [21] G. R. Rout, “Identification of Tinospora Cordifolia (Willd) Miers ex Hook F & Thomas Using RAPD Markers,” Z Naturforschung C, Vol. 61, No. 1-2, 2006, pp. 118-122. [22] G. Rajaseger, H. T. W. Tan, I. M. Turner and P. P. Kumar, “Analysis of Genetic Diversity among Ixora Cultivars (Rubiaceae) Using Random Amplified Polymorphic DNA,” Annals of Botany, Vol. 80, No. 3, 1997, pp. 355-361. |