Paper Menu >>
Journal Menu >>
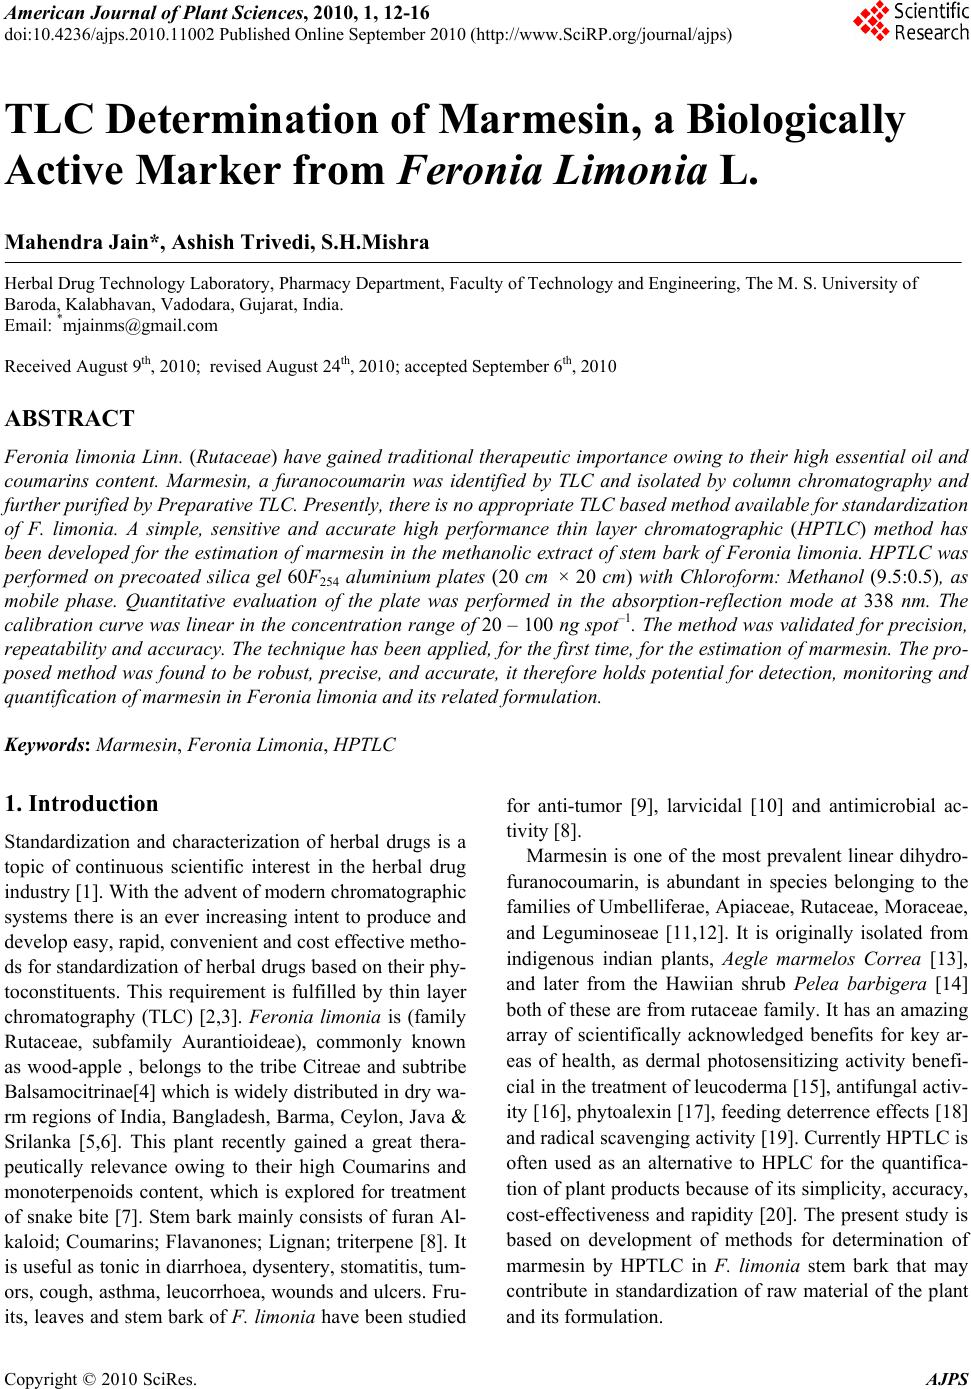 American Journal of Plant Sciences, 2010, 1, 12-16 doi:10.4236/ajps.2010.11002 Published Online September 2010 (http://www.SciRP.org/journal/ajps) Copyright © 2010 SciRes. AJPS TLC Determination of Marmesin, a Biologically Active Marker from Feronia Limonia L. Mahendra Jain*, Ashish Trivedi, S.H.Mishra Herbal Drug Technology Laboratory, Pharmacy Department, Faculty of Technology and Engineering, The M. S. University of Baroda, Kalabhavan, Vadodara, Gujarat, India. Email: *mjainms@gmail.com Received August 9th, 2010; revised August 24th, 2010; accepted September 6th, 2010 ABSTRACT Feronia limonia Linn. (Rutaceae) have gained traditiona l therapeutic importance owing to their high essential oil and coumarins content. Marmesin, a furanocoumarin was identified by TLC and isolated by column chromatography and further purified by Preparative TLC. Presently, there is no app ropriate TLC based method available for standardization of F. limonia. A simple, sensitive and accurate high performance thin layer chromatographic (HPTLC) method has been developed for the estimation of marmesin in the methanolic extract of stem bark of Feronia limonia. HPTLC was performed on precoated silica gel 60F254 aluminium plates (20 cm × 20 cm) with Chloroform: Methanol (9.5:0.5), as mobile phase. Quantitative evaluation of the plate was performed in the absorption-reflection mode at 338 nm. The calibratio n curve was linear in the concentra tion range of 20 – 100 ng spo t–1. The method was validated for precision, repeatability an d accuracy. The tech nique has been app lied, for the first time, for the estimation of marmesin. The pro- posed method was found to be robust, precise, and accurate, it therefore holds potential for detection, monitoring and quantification of ma rmesin in Feronia limonia and its related formulation. Keywords: Marmesin, Feronia Limonia, HP TLC 1. Introduction Standardization and characterization of herbal drugs is a topic of continuous scientific interest in the herbal drug industry [1]. With the advent of modern chromatographic systems there is an ever increasing intent to produce and develop easy, rapid, convenient and cost effective metho- ds for standardization of herbal drugs based on their phy- toconstituents. This requirement is fulfilled by thin layer chromatography (TLC) [2,3]. Feronia limonia is (family Rutaceae, subfamily Aurantioideae), commonly known as wood-apple , belongs to the tribe Citreae and subtribe Balsamocitrinae[4] which is widely distributed in dry wa- rm regions of India, Bangladesh, Barma, Ceylon, Java & Srilanka [5,6]. This plant recently gained a great thera- peutically relevance owing to their high Coumarins and monoterpenoids content, which is explored for treatment of snake bite [7]. Stem bark mainly consists of furan Al- kaloid; Coumarins; Flavanones; Lignan; triterpene [8]. It is useful as tonic in diarrhoea, dysentery, stomatitis, tum- ors, cough, asthma, leucorrhoea, wounds and ulcers. Fru- its, leaves and stem bark of F. limonia have been studied for anti-tumor [9], larvicidal [10] and antimicrobial ac- tivity [8]. Marmesin is one of the most prevalent linear dihydro- furanocoumarin, is abundant in species belonging to the families of Umbelliferae, Apiaceae, Rutaceae, Moraceae, and Leguminoseae [11,12]. It is originally isolated from indigenous indian plants, Aegle marmelos Correa [13], and later from the Hawiian shrub Pelea barbigera [14] both of these are from rutaceae family. It has an amazing array of scientifically acknowledged benefits for key ar- eas of health, as dermal photosensitizing activity benefi- cial in the treatment of leucoderma [15], antifungal activ- ity [16], phytoalexin [17], feeding deterrence effects [18] and radical scavenging activity [19]. Currently HPTLC is often used as an alternative to HPLC for the quantifica- tion of plant products because of its simplicity, accuracy, cost-effectiveness and rapidity [20]. The present study is based on development of methods for determination of marmesin by HPTLC in F. limonia stem bark that may contribute in standardization of raw material of the plant and its formulation. 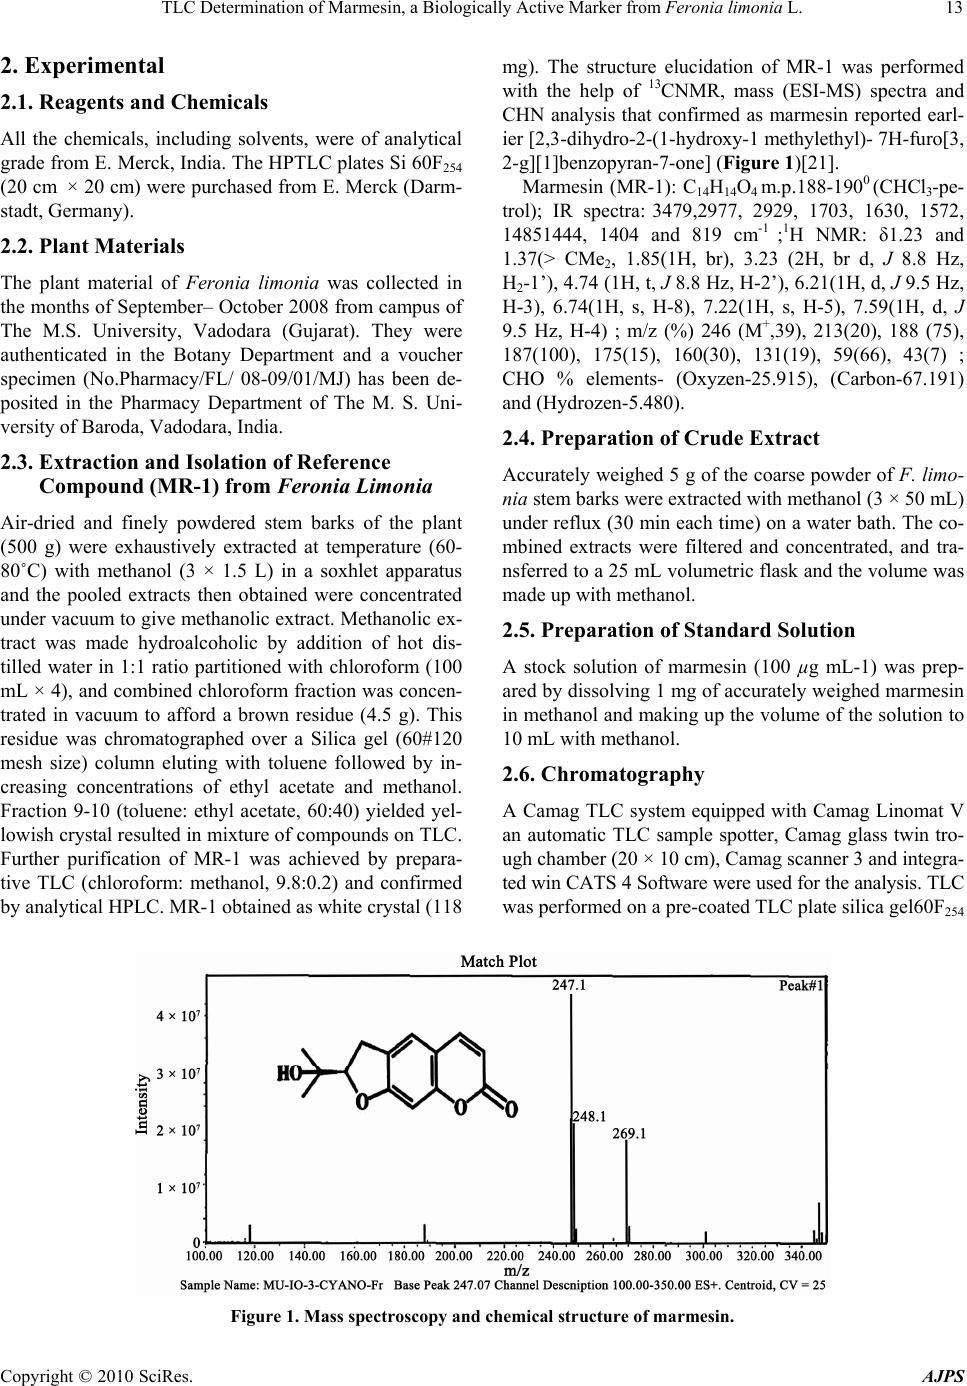 TLC Determination of Marmesin, a Biologically Active Marker from Feronia limonia L. Copyright © 2010 SciRes. AJPS 13 2. Experimental 2.1. Reagents and Chemicals All the chemicals, including solvents, were of analytical grade from E. Merck, India. The HPTLC plates Si 60F254 (20 cm × 20 cm) were purchased from E. Merck (Darm- stadt, Germany). 2.2. Plant Materials The plant material of Feronia limonia was collected in the months of September– October 2008 from campus of The M.S. University, Vadodara (Gujarat). They were authenticated in the Botany Department and a voucher specimen (No.Pharmacy/FL/ 08-09/01/MJ) has been de- posited in the Pharmacy Department of The M. S. Uni- versity of Baroda, Vadodara, India. 2.3. Extraction and Isolation of Reference Compound (MR-1) from Feronia Limonia Air-dried and finely powdered stem barks of the plant (500 g) were exhaustively extracted at temperature (60- 80˚C) with methanol (3 × 1.5 L) in a soxhlet apparatus and the pooled extracts then obtained were concentrated under vacuum to give methanolic extract. Methanolic ex- tract was made hydroalcoholic by addition of hot dis- tilled water in 1:1 ratio partitioned with chloroform (100 mL × 4), and combined chloroform fraction was concen- trated in vacuum to afford a brown residue (4.5 g). This residue was chromatographed over a Silica gel (60#120 mesh size) column eluting with toluene followed by in- creasing concentrations of ethyl acetate and methanol. Fraction 9-10 (toluene: ethyl acetate, 60:40) yielded yel- lowish crystal resulted in mixture of compounds on TLC. Further purification of MR-1 was achieved by prepara- tive TLC (chloroform: methanol, 9.8:0.2) and confirmed by analytical HPLC. MR-1 obtained as white crystal (118 mg). The structure elucidation of MR-1 was performed with the help of 13CNMR, mass (ESI-MS) spectra and CHN analysis that confirmed as marmesin reported earl- ier [2,3-dihydro-2-(1-hydroxy-1 methylethyl)- 7H-furo[3, 2-g][1]benzopyran-7-one] (Figure 1)[21]. Marmesin (MR-1): C14H14O4 m.p.188-1900 (CHCl3-pe- trol); IR spectra: 3479,2977, 2929, 1703, 1630, 1572, 14851444, 1404 and 819 cm-1 ;1H NMR: δ1.23 and 1.37(> CMe2, 1.85(1H, br), 3.23 (2H, br d, J 8.8 Hz, H2-1’), 4.74 (1H, t, J 8.8 Hz, H-2’), 6.21(1H, d, J 9.5 Hz, H-3), 6.74(1H, s, H-8), 7.22(1H, s, H-5), 7.59(1H, d, J 9.5 Hz, H-4) ; m/z (%) 246 (M+,39), 213(20), 188 (75), 187(100), 175(15), 160(30), 131(19), 59(66), 43(7) ; CHO % elements- (Oxyzen-25.915), (Carbon-67.191) and (Hydrozen-5.480). 2.4. Preparation of Crude Extract Accurately weighed 5 g of the coarse powder of F. limo- nia stem barks were extracted with methanol (3 × 50 mL) under reflux (30 min each time) on a water bath. The co- mbined extracts were filtered and concentrated, and tra- nsferred to a 25 mL volumetric flask and the volume was made up with methanol. 2.5. Preparation of Standard Solution A stock solution of marmesin (100 µg mL-1) was prep- ared by dissolving 1 mg of accurately weighed marmesin in methanol and making up the volume of the solution to 10 mL with methanol. 2.6. Chromatography A Camag TLC system equipped with Camag Linomat V an automatic TLC sample spotter, Camag glass twin tro- ugh chamber (20 × 10 cm), Camag scanner 3 and integra- ted win CATS 4 Software were used for the analysis. TLC was performed on a pre-coated TLC plate silica gel60F254 Figure 1. Mass spectroscopy and chemical structure of marmesin. 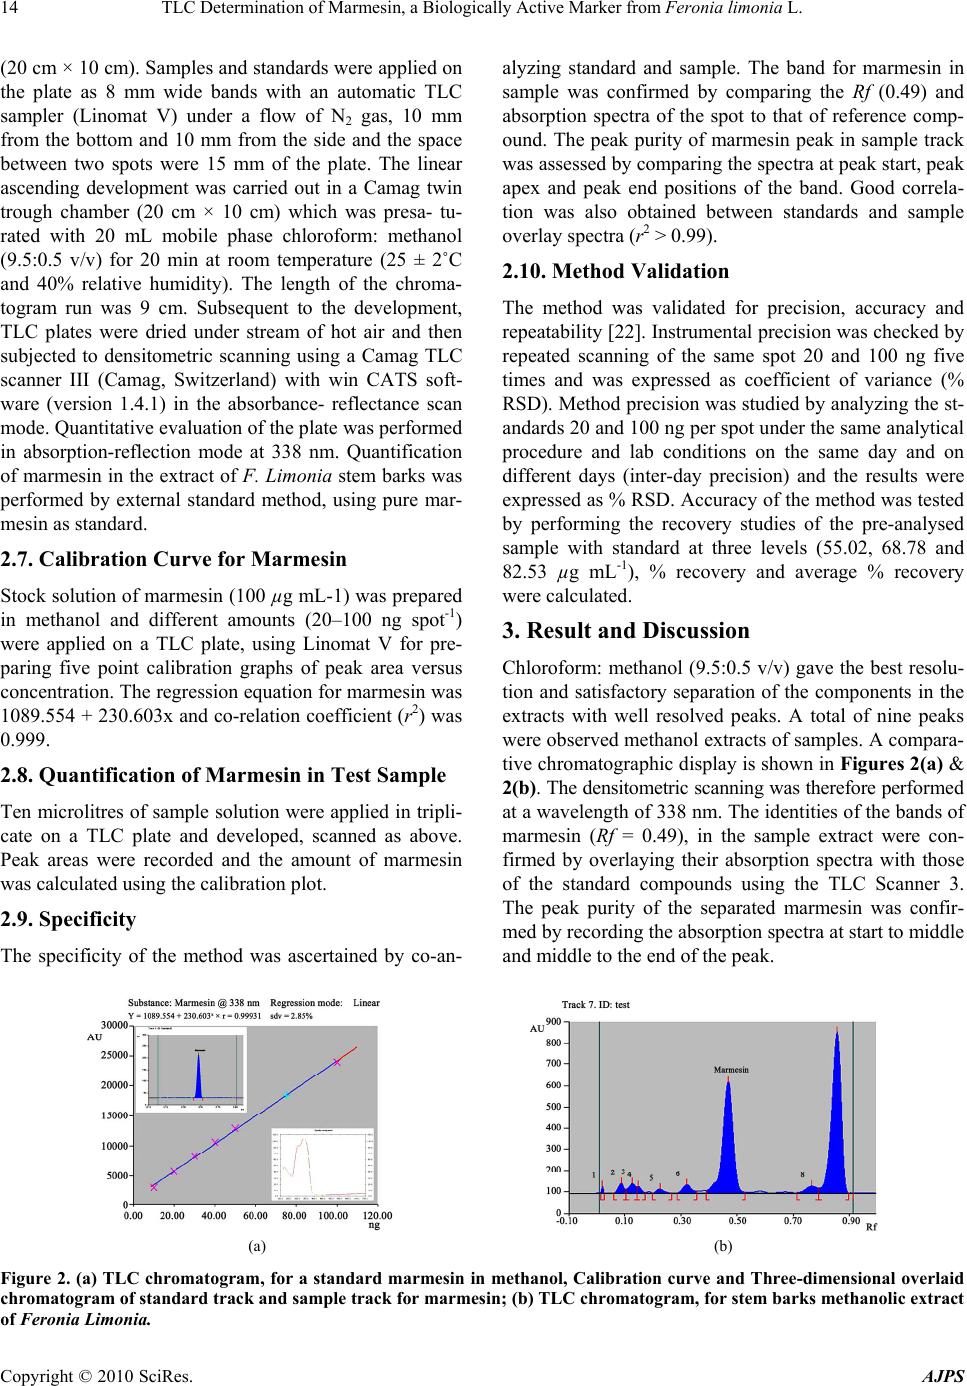 TLC Determination of Marmesin, a Biologically Active Marker from Feronia limonia L. Copyright © 2010 SciRes. AJPS 14 (20 cm × 10 cm). Samples and standards were applied on the plate as 8 mm wide bands with an automatic TLC sampler (Linomat V) under a flow of N2 gas, 10 mm from the bottom and 10 mm from the side and the space between two spots were 15 mm of the plate. The linear ascending development was carried out in a Camag twin trough chamber (20 cm × 10 cm) which was presa- tu- rated with 20 mL mobile phase chloroform: methanol (9.5:0.5 v/v) for 20 min at room temperature (25 ± 2˚C and 40% relative humidity). The length of the chroma- togram run was 9 cm. Subsequent to the development, TLC plates were dried under stream of hot air and then subjected to densitometric scanning using a Camag TLC scanner III (Camag, Switzerland) with win CATS soft- ware (version 1.4.1) in the absorbance- reflectance scan mode. Quantitative evaluation of the plate was performed in absorption-reflection mode at 338 nm. Quantification of marmesin in the extract of F. Limonia stem barks was performed by external standard method, using pure mar- mesin as standard. 2.7. Calibration Curve for Marmesin Stock solution of marmesin (100 µg mL-1) was prepared in methanol and different amounts (20–100 ng spot-1) were applied on a TLC plate, using Linomat V for pre- paring five point calibration graphs of peak area versus concentration. The regression equation for marmesin was 1089.554 + 230.603x and co-relation coefficient (r2) was 0.999. 2.8. Quantification of Marmesin in Test Sample Ten microlitres of sample solution were applied in tripli- cate on a TLC plate and developed, scanned as above. Peak areas were recorded and the amount of marmesin was calculated using the calibration plot. 2.9. Specificity The specificity of the method was ascertained by co-an- alyzing standard and sample. The band for marmesin in sample was confirmed by comparing the Rf (0.49) and absorption spectra of the spot to that of reference comp- ound. The peak purity of marmesin peak in sample track was assessed by comparing the spectra at peak start, peak apex and peak end positions of the band. Good correla- tion was also obtained between standards and sample overlay spectra (r2 > 0.99). 2.10. Method Validation The method was validated for precision, accuracy and repeatability [22]. Instrumental precision was checked by repeated scanning of the same spot 20 and 100 ng five times and was expressed as coefficient of variance (% RSD). Method precision was studied by analyzing the st- andards 20 and 100 ng per spot under the same analytical procedure and lab conditions on the same day and on different days (inter-day precision) and the results were expressed as % RSD. Accuracy of the method was tested by performing the recovery studies of the pre-analysed sample with standard at three levels (55.02, 68.78 and 82.53 µg mL-1), % recovery and average % recovery were calculated. 3. Result and Discussion Chloroform: methanol (9.5:0.5 v/v) gave the best resolu- tion and satisfactory separation of the components in the extracts with well resolved peaks. A total of nine peaks were observed methanol extracts of samples. A compara- tive chromatographic display is shown in Figures 2(a) & 2(b). The densitometric scanning was therefore performed at a wavelength of 338 nm. The identities of the bands of marmesin (Rf = 0.49), in the sample extract were con- firmed by overlaying their absorption spectra with those of the standard compounds using the TLC Scanner 3. The peak purity of the separated marmesin was confir- med by recording the absorption spectra at start to middle and middle to the end of the peak. (a) (b) Figure 2. (a) TLC chromatogram, for a standard marmesin in methanol, Calibration curve and Three-dimensional overlaid chromatogram of standard track and sample track for marmesin; (b) TLC chromatogram, for stem barks methanolic extract of Feronia Limonia. 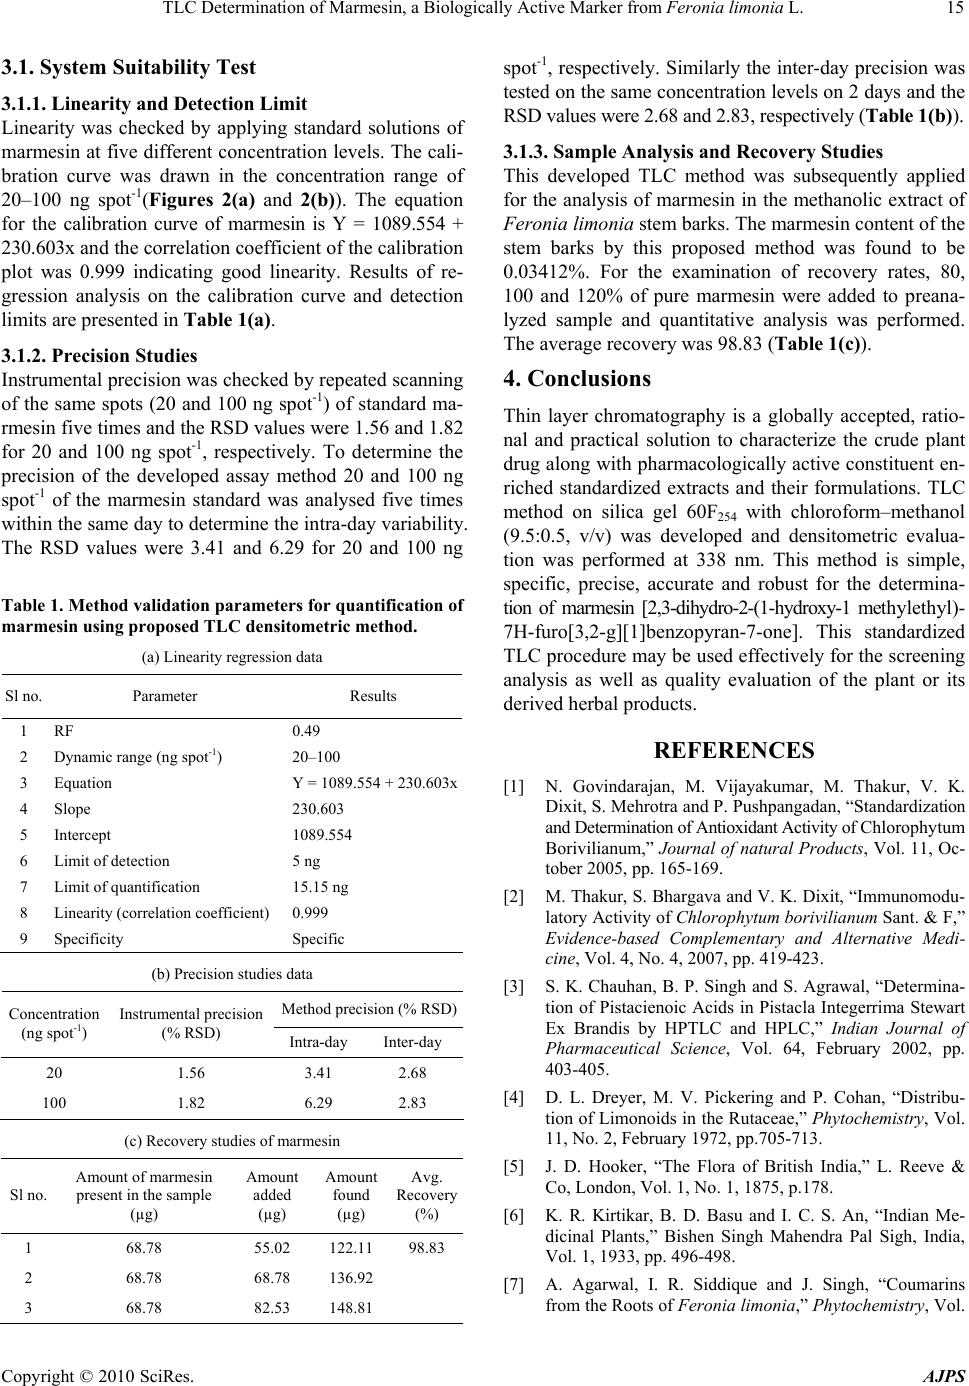 TLC Determination of Marmesin, a Biologically Active Marker from Feronia limonia L. Copyright © 2010 SciRes. AJPS 15 3.1. System Suitability Test 3.1.1. Linearity and Detection Limit Linearity was checked by applying standard solutions of marmesin at five different concentration levels. The cali- bration curve was drawn in the concentration range of 20–100 ng spot-1(Figures 2(a) and 2(b)). The equation for the calibration curve of marmesin is Y = 1089.554 + 230.603x and the correlation coefficient of the calibration plot was 0.999 indicating good linearity. Results of re- gression analysis on the calibration curve and detection limits are presented in Table 1(a). 3.1.2. Precision Studies Instrumental precision was checked by repeated scanning of the same spots (20 and 100 ng spot-1) of standard ma- rmesin five times and the RSD values were 1.56 and 1.82 for 20 and 100 ng spot-1, respectively. To determine the precision of the developed assay method 20 and 100 ng spot-1 of the marmesin standard was analysed five times within the same day to determine the intra-day variability. The RSD values were 3.41 and 6.29 for 20 and 100 ng Table 1. Method validation parameters for quantification of marmesin using proposed TLC densitometric method. (a) Linearity regression data Sl no. Parameter Results 1 RF 0.49 2 Dynamic range (ng spot-1) 20–100 3 Equation Y = 1089.554 + 230.603x 4 Slope 230.603 5 Intercept 1089.554 6 Limit of detection 5 ng 7 Limit of quantification 15.15 ng 8 Linearity (correlation coefficient) 0.999 9 Specificity Specific (b) Precision studies data Method precision (% RSD) Concentration (ng spot-1) Instrumental precision (% RSD) Intra-day Inter-day 20 1.56 3.41 2.68 100 1.82 6.29 2.83 (c) Recovery studies of marmesin Sl no. Amount of marmesin present in the sample (µg) Amount added (µg) Amount found (µg) Avg. Recovery (%) 1 68.78 55.02 122.11 98.83 2 68.78 68.78 136.92 3 68.78 82.53 148.81 spot-1, respectively. Similarly the inter-day precision was tested on the same concentration levels on 2 days and the RSD values were 2.68 and 2.83, respectively (Table 1(b)). 3.1.3. Sampl e Analysis and Recovery Studie s This developed TLC method was subsequently applied for the analysis of marmesin in the methanolic extract of Feronia limonia stem barks. The marmesin content of the stem barks by this proposed method was found to be 0.03412%. For the examination of recovery rates, 80, 100 and 120% of pure marmesin were added to preana- lyzed sample and quantitative analysis was performed. The average recovery was 98.83 (Table 1(c)). 4. Conclusions Thin layer chromatography is a globally accepted, ratio- nal and practical solution to characterize the crude plant drug along with pharmacologically active constituent en- riched standardized extracts and their formulations. TLC method on silica gel 60F254 with chloroform–methanol (9.5:0.5, v/v) was developed and densitometric evalua- tion was performed at 338 nm. This method is simple, specific, precise, accurate and robust for the determina- tion of marmesin [2,3-dihydro-2-(1-hydroxy-1 methylethyl)- 7H-furo[3,2-g][1]benzopyran-7-one]. This standardized TLC procedure may be used effectively for the screening analysis as well as quality evaluation of the plant or its derived herbal products. REFERENCES [1] N. Govindarajan, M. Vijayakumar, M. Thakur, V. K. Dixit, S. Mehrotra and P. Pushpangadan, “Standardization and Determination of Antioxidant Activity of Chlorophytum Borivilianum,” Journal of natural Products, Vol. 11, Oc- tober 2005, pp. 165-169. [2] M. Thakur, S. Bhargava and V. K. Dixit, “Immunomodu- latory Activity of Chlorophytum borivilianum Sant. & F,” Evidence-based Complementary and Alternative Medi- cine, Vol. 4, No. 4, 2007, pp. 419-423. [3] S. K. Chauhan, B. P. Singh and S. Agrawal, “Determina- tion of Pistacienoic Acids in Pistacla Integerrima Stewart Ex Brandis by HPTLC and HPLC,” Indian Journal of Pharmaceutical Science, Vol. 64, February 2002, pp. 403-405. [4] D. L. Dreyer, M. V. Pickering and P. Cohan, “Distribu- tion of Limonoids in the Rutaceae,” Phytochemistry, Vol. 11, No. 2, February 1972, pp.705-713. [5] J. D. Hooker, “The Flora of British India,” L. Reeve & Co, London, Vol. 1, No. 1, 1875, p.178. [6] K. R. Kirtikar, B. D. Basu and I. C. S. An, “Indian Me- dicinal Plants,” Bishen Singh Mahendra Pal Sigh, India, Vol. 1, 1933, pp. 496-498. [7] A. Agarwal, I. R. Siddique and J. Singh, “Coumarins from the Roots of Feronia limonia,” Phytochemistry, Vol.  TLC Determination of Marmesin, a Biologically Active Marker from Feronia limonia L. Copyright © 2010 SciRes. AJPS 16 28, No. 4, 1989, pp.1229-1231. [8] M. M. Rahman and I. G. Alexander, “Antimicrobial Con- stituents from the Stem Bark of Feronia Limonia,” Phy- tochemistry, Vol. 59, No. 1, January 2002, pp.73-77. [9] Y. Saima, A. K. Das, K. K. Sarkar, A. K. Sen and P. Sur, “An Antitumor Pectic Polysaccharide from Feronia limo- nia,” International Journal of Biological Macromolecules, Vol. 27, No. 5, August 2000, pp.333-335. [10] A. A. Rahuman, G. Gopalakrishnan, B. S. Ghouse, S. Arumugam and B. Himalayan, “Effect of Feronia Limo- nia on Mosquito Larvae,” Fitoterepia, Vol. 71, No. 5, September 2000, pp. 553-555. [11] S. A. Brown, “Biochemistry of the Coumarins. In Recent Advances in Phytochemistry,” In: T. Swain, J. B. Har- borne and. C. F. Van Sumere, Ed., Plenum Press, New York, Vol. 12, 1978, pp. 249-286. [12] H. G. Floss, “Biosynthesis of Furanocoumarins. In Recent Advances in Phytochemistry,” Proceedings of the 9th Annual Symposium of the Phytochemical Society of North America, V. C. Runeckles and J. E. Watkins, Ed., Appel- ton–Century–Crofts, New York, Vol. 4, 1972, pp. 143-164. [13] A. Chatterjee and S. S. Mitra, “On the Constitution of the Active Principles Isolated from the Matured Bark of Ae- gle marmelos Correa,” Journal of the American Chemical Society, Vol. 71, February 1949, p.606. [14] T. Higa and P. J. Scheuer, “Coumarins and Flavones from Pelea Barbigera (Gray) Hillebrand (Rutaceae),” Journal of the Chemical Society-Perkin Transactions, Vol. 1, 1974, pp. 1350-1352. [15] T. O. Soine, “Naturally Occurring Coumarins & Related Physiological Activities,” Journal of Pharmaceutical Sci- ences, Vol. 3, No. 53, 1964, pp. 231-262. [16] U. Afek, S. Carmeli and N. Aharoni, “The Involvement of Marmesin in Celery Resistance to Pathogens during Stor- age and the Effect of Temperatures on its Concentration,” Phytopathology, Vol. 85, 1995, pp.1033-1036. [17] U. Afek, J. Orenstein and N. Aharoni, “The Involvement of Marmesin and Its Interactionwith GA3 and Psoralens in Parsley Decay Resistance,” The Canadian Journal of Plant Pathology, Vol. 24, 2002, pp. 61-64. [18] T. T. John and G. M. Jocelyn, “Biological Activity of Marmesin and Demethylsuberosin against a Generalist Herbivore, Spodoptera exigua (Lepidoptera: Noctuidae),” Journal of Agricultural and Food Chemistry, Vol. 44, 1996, pp. 2859-2864. [19] V. Vimal and T. Devaki, “Linear Furanocoumarin Pro- tects Rat Myocardium against Lipid Peroxidation and Membrane Damage during Experimental Myocardial In- jury,” Biomedicine & Pharmacotherapy, Vol. 58, No. 6-7, 2004, pp. 393-400. [20] K. Arvind, R. K. Tripathi, A. K. Verma, M. M. Gupta and P. S. K. Suman, “Quantitative Determination of Phyllan- thin and Hypophyllanthin in Phyllanthus Species by High- Performance Thin Layer Chromatography,” Phyto- chemical Analysis, Vol. 17, No. 6, 2006, pp. 394-397. [21] A. Patra, S. K. Mishra and S. K. Chaudhuri, “Constituents of Limonia Acidissima: Applications of Two-Dimen- sional NMR Spectroscopy in Structural Elucidation,” Journal of the Indian Chemical Society, Vol. IXV, 1988, pp. 205-208. [22] ICH guideline Q2R1, validation of analytical procedures: text and methodology (November 1996/2005) Geneva, Switzerland. |