Paper Menu >>
Journal Menu >>
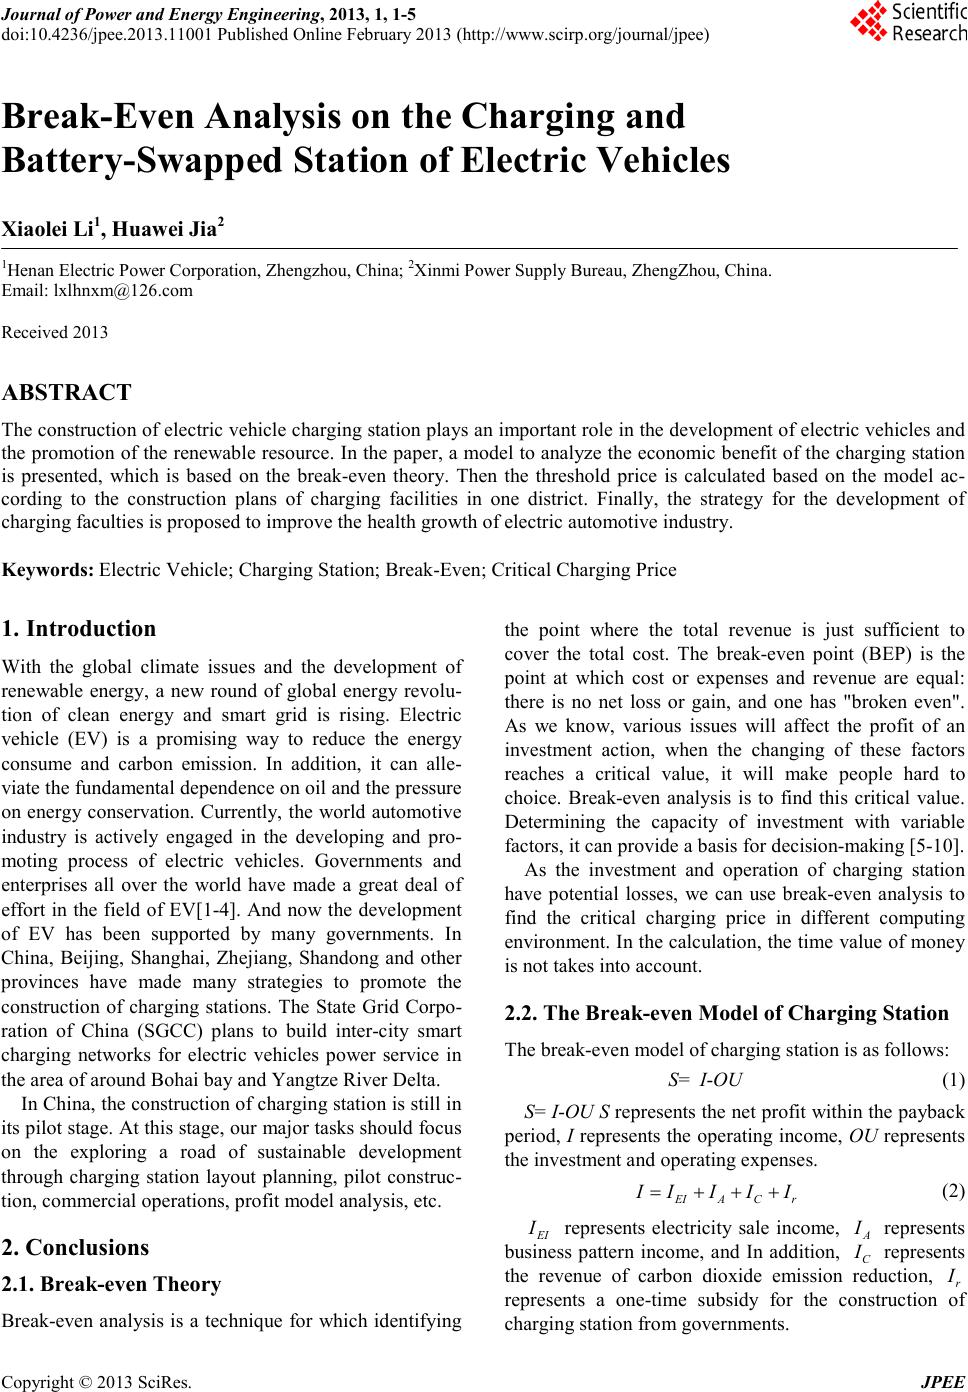 Journal of Power and Energy Engineering, 2013, 1, 1-5 doi:10.4236/jpee.2013.11001 Published Online February 2013 (http://www.scirp.org/journal/jpee) Copyright © 2013 SciRes. JPEE Break-Even Analysis on the Charging and Battery-Swapped Station of Electric Vehicles Xiaolei Li1, Huawe i J ia2 1Henan E lectric Po wer Corporation, Zhengzh ou, China ; 2Xinmi Power Supply Bureau, ZhengZhou, China. Email: lxlhnxm@126.com Received 2013 ABSTRACT The constructio n of elec tric vehicle c harging stat ion pla ys an importa nt role in the d evelo pment of electr ic ve hicles and the promotion of the renewable resource. In the paper, a model to analyze the economic benefit of the charging station is presented, which is based on the break-even theory. Then the threshold price is calculated based on the model ac- cording to the construction plans of charging facilities in one district. Finally, the strategy for the development of charging faculties is proposed to improve t he hea l th gro wth o f elec tric automotive i ndustry. Keywords: Electric Vehicle; Charging Station; Break-Even; Critical Charging Pr ice 1. Introduction With the global climate issues and the development of renewable energy, a new round of global energy revolu- tion of clean energy and smart grid is rising. Electric vehicle (EV) is a promising way to reduce the energy consume and carbon emission. In addition, it can alle- viate the fundamental dependence on oil and the pressure on ene rgy co nservati on. C urrently, t he world auto motive industry is actively engaged in the developing and pro- moting process of electric vehicles. Governments and enterprises all over the world have made a great deal of effort in the field of EV[1-4]. And now the development of EV has been supported by many governments. In China, Beijing, Shanghai, Zhejiang, Shandong and other provinces have made many strategies to promote the construction of charging stations. The State Grid Corpo- ration of China (SGCC) plans to build inter-city smart charging networks for electric vehicles power service in the area of around Bohai bay and Yangtze River Delta. In Chi na, t he co nstr ucti on o f chargin g station is still i n its pilot stage. At this stage, our major tasks should focus on the exploring a road of sustainable development through charging station layout planning, pilot construc- tion, commercial operations, profit model analysis, etc. 2. Conclusions 2.1. Break-even Theory Break-even a nalysis i s a technique for which identifying the point where the total revenue is just sufficient to cover the total cost. The break-even point (BEP) is the point at which cost or expenses and revenue are equal: there is no net loss or gain, and one has "broken even". As we know, various issues will affect the profit of an investment action, when the changing of these factors reaches a critical value, it will ma ke people hard to choice. Break-even analysis is to find this critical value. Determining the capacity of investment with variable factors, it can provide a basis for de c isio n-making [5-10]. As the investment and operation of charging station have potential losses, we can use break-even analysis to find the critical charging price in different computing environment. In the calc ulatio n, the time value of mone y is not takes into account. 2.2. The Break-even Model of Charging Station The break-even mode l of charging station is as fo llows: S= I-OU (1) S= I-OU S represents the net p rofit within the payba ck period, I represents the operating inco me, OU represents the in vestment a nd op erating expenses. EIA Cr III I I= +++ (2) EI I represents electricity sale income, A I represents business patter n income, and In addition, C I represents the revenue of carbon dioxide emission reduction, r I represents a one-time subsidy for the construction of charging station fr om g overnments. 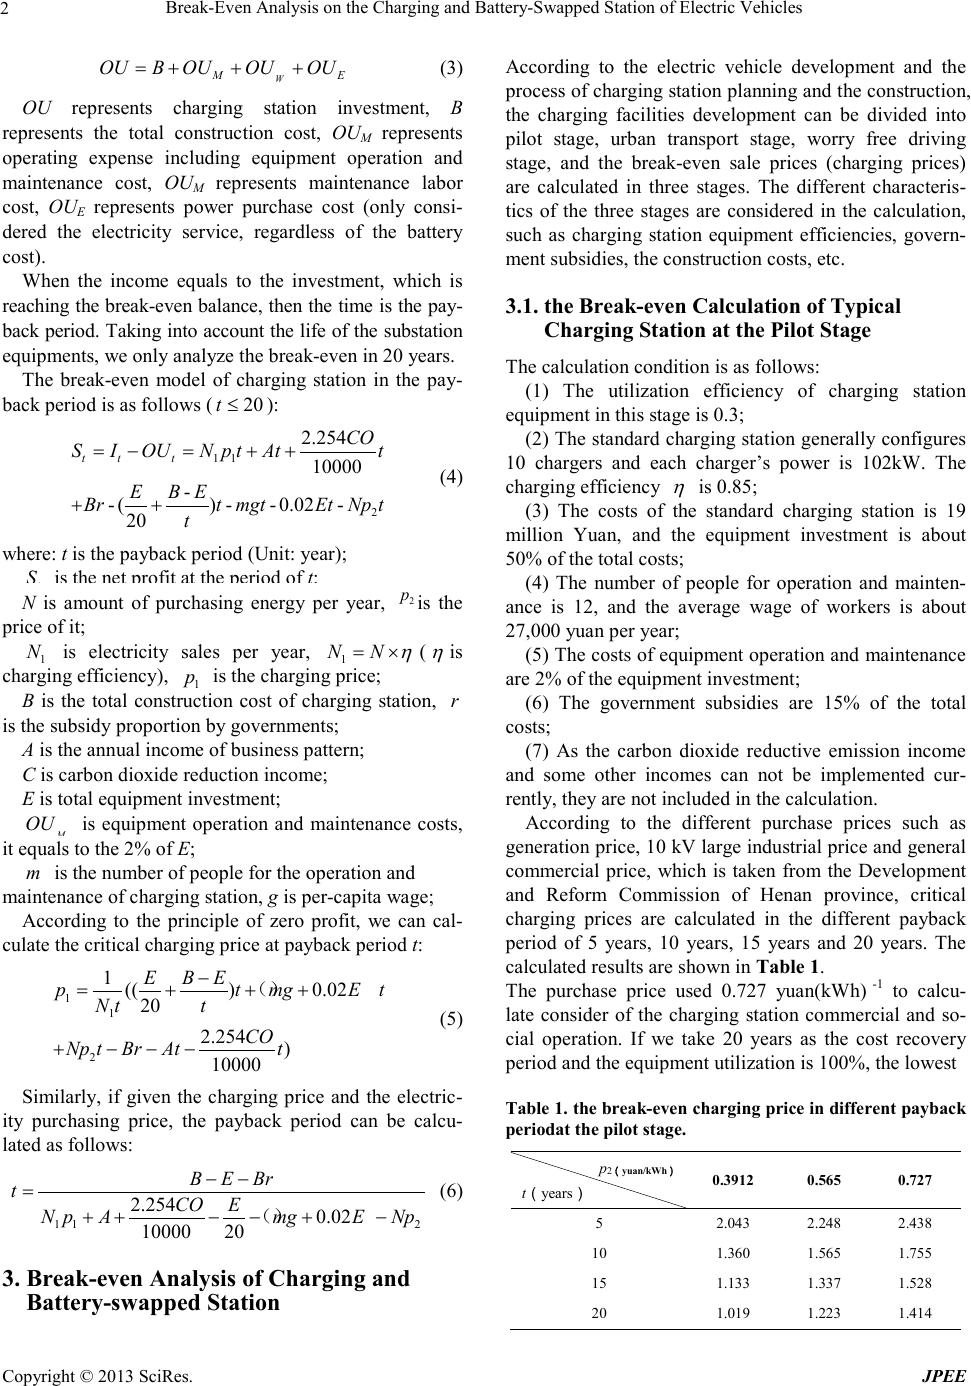 Break-Even Analysis on the Charging and Battery-Swapped Station of Electric Vehicles Copyright © 2013 SciRes. JPEE 2 W ME OUB OUOUOU=+++ (3) OU represents charging station investment, B represents the total construction cost, OUM represents operating expense including equipment operation and mai n tenance cost, OUM represents maintenance labor cost, OUE represents power purchase cost (only consi- dered the electricity service, regardless of the battery cost). When the income equals to the investment, which is reaching the brea k-even balance, t hen the time is the pay- back period. Taking into account the life of the substation equipment s , we only analyze the break-eve n in 20 years. The break-even model of charging station in the pay- back period is as follows ( 20t≤ ): 11 2 2.254 10000 - -() --0.02- 20 tt t CO SIOUNp tAtt E BE BrtmgtEtNp t t =− =++ ++ (4) where: t is the payback period (Unit: year); t S is the net profit at the period of t; N is amount of purchasing energy per year, 2 p is the price of it; 1 N is electricity sales per year, 1 NN η = × ( η is char ging e fficiency), 1 p is the charging pr ic e; B is the total construction cost of charging station, r is the subsidy proportion by governments; A is the annual income of business pattern; C is carbon dioxide reduction i ncome; E is total equip ment i nvestment; M OU is equipment operation and maintenance costs, it equals to the 2% of E; m is the number of people for the operation and maintenance of charging station, g is per-capita wage; According to the principle of zero profit, we can cal- culate the critical charging price at payback period t: 11 2 1(() 0.02 20 2.254 ) 10000 E BE ptmgE t Nt t CO Np tBrAtt − =+ ++ + −−− () (5) Similarly, if given the charging price and the electric- ity purchasing price, the payback period can be calcu- lated as follows: 11 2 2.254 0.02 10000 20 B EBr tCO E N pAmgENp −− = ++− −+−() (6) 3. Break-even Analysis of Charging and Battery-swapped Station According to the electric vehicle development and the process of charging stati on p lanni n g and the construction, the charging facilities development can be divided into pilot stage, urban transport stage, worry free driving stage, and the break-even sale prices (charging prices) are calculated in three stages. The different characteris- tics of the three stages are considered in the calculation, such as charging station equipment efficiencies, govern- ment subsidies, the construction costs, etc. 3.1. the Br ea k-even Calculation of Typical Charging Station at the Pilot Stage The calculation condition is as follows: (1) The utilization efficiency of charging station equipment in this stage is 0.3; (2) The s tandar d chargi ng stat ion ge nerally c onfig ures 10 chargers and each charger’s power is 102kW. The char ging e fficiency η is 0.85; (3) The costs of the standard charging station is 19 million Yuan, and the equipment investment is about 50% of the total costs; (4) The number of people for operation and mainten- ance is 12, and the average wage of workers is about 27,000 yuan per year; (5) The cost s of equip ment op erati on and maintena nce are 2% of the equipment investment; (6) The government subsidies are 15% of the total costs; (7) As the carbon dioxide reductive emission income and some other incomes can not be implemented cur- rently, they are no t included in the c alc ulation. According to the different purchase prices such as generation price, 10 kV large industrial price and general commercial p r ice , which is taken from the Development and Reform Commission of Henan province, cr itical charging prices are calculated in the different payback period of 5 years, 10 years, 15 years and 20 years. The calculated results are sho wn in Table 1. The purchase price used 0.727 yuan(kWh) -1 to calcu- late consider of the charging station commercial and so- cial operation. If we take 20 years as the cost recovery period and the equipment utilization is 100%, the lowest Table 1. the break-even c harg ing pric e in di ffe re nt payb ac k periodat the pilot stage. p2 ( yuan/kWh ) t(years) 0.3912 0.565 0.727 5 2.043 2.248 2.438 10 1.360 1.565 1.755 15 1.133 1.337 1.528 20 1.019 1.223 1.414 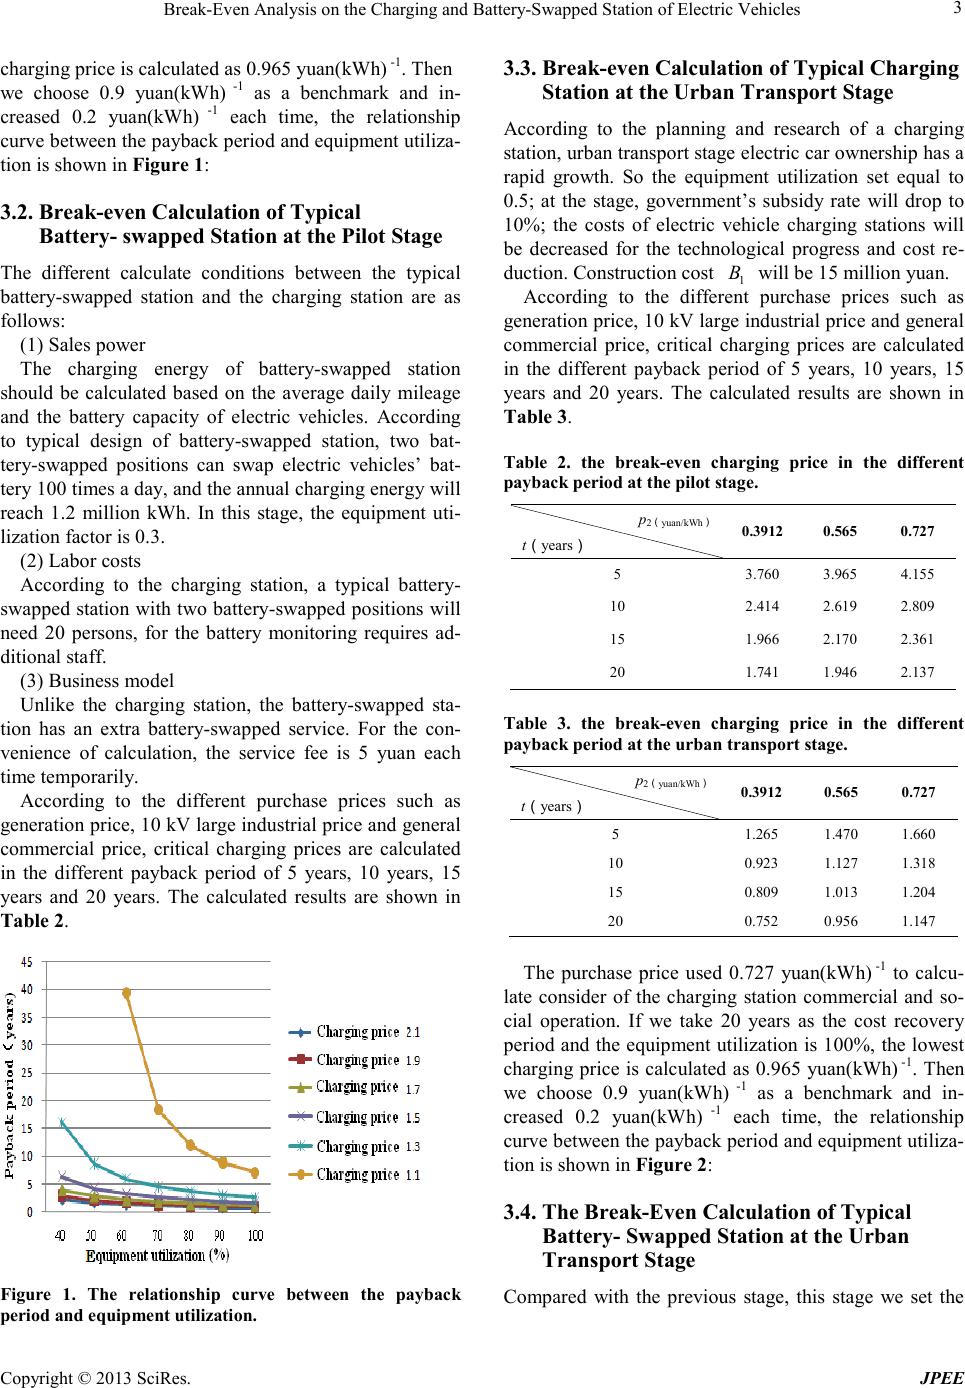 Break-Even Analysis on the Charging and Battery-Swapped Station of Electric Vehicles Copyright © 2013 SciRes. JPEE 3 char ging price is calculated as 0.965 yuan(kWh) -1. Then we choose 0.9 yuan(kWh) -1 as a benchmark and in- creased 0.2 yuan(kWh) -1 each time, the relationship curve bet ween the pa ybac k per iod and eq uipme nt uti liza- tion is shown in F ig ure 1: 3.2. Break-even Calculation of Typical Battery- swapped Station at the Pilot Stage The different calculate conditions between the typical battery-swapped station and the charging station are as follows: (1) Sales power The charging energy of b atte r y-swapped station should be calculated based on the average daily mileage and the battery capacity of electric vehicles. According to typical design of battery-swapped station, two bat- tery-swapped positions can swap electric vehicles’ bat- tery 100 times a day, and the annual c hargin g ene r g y will reach 1.2 million kWh. In this stage, the equipment uti- lization facto r is 0.3. (2) Labor costs According to the charging station, a typical battery- swapped station with t wo battery-swapped positions will need 20 persons, for the battery monitoring requires ad- ditional staff. (3) Business mo del Unlike the charging station, the battery-swapped sta- tion has an extra batte ry-swapped service. For the con- venience of calculation, the service fee is 5 yuan each time tempora rily. According to the different purchase prices such as generation price, 10 kV large industrial price and general commercial price, critical charging prices are calculated in the different payback period of 5 years, 10 years, 15 years and 20 years. The calculated results are shown in Table 2. Figure 1. The relationship curve between the payback period and equipment util ization. 3.3. Break-even Calculation of Typical Charging Station at the Urban Transport Stage According to the planning and research of a charging station, urba n tra nsport stage electric car ownership has a rapid growth. So the equipment utilization set equal to 0.5; at the stage, government’s subsidy rate will drop to 10%; the costs of electric vehicle charging stations will be decreased for the technological progress and cost re- duction. Construction cost 1 B will be 15 million yua n. According to the different purchase prices such as generation price, 10 kV large industrial price and general commercial price, critical charging prices are calculated in the different payback period of 5 years, 10 years, 15 years and 20 years. The calculated results are shown in Table 3. Table 2. the break-even charging price in the different payback period at the pi lot stage. p2(yuan/kWh) t(years) 0.3912 0.565 0.727 5 3.760 3.965 4.155 10 2.414 2.619 2.809 15 1.966 2.170 2.361 20 1.741 1.946 2.137 Table 3. the bre ak-even charging price in the different payback period at the urban transpor t stag e. p2(yuan/kWh) t(years) 0.3912 0.565 0.727 5 1.265 1.470 1.660 10 0.923 1.127 1.318 15 0.809 1.013 1.204 20 0.752 0.956 1.147 The purchase price used 0.727 yuan(kWh) -1 to calcu- late consider of the charging station commercial and so- cial operation. If we take 20 years as the cost recovery period and the equipment utilization is 100%, the lowest charging price is calc ulated a s 0.965 yuan(kWh) -1. T hen we choose 0.9 yuan(kWh) -1 as a benchmark and in- creased 0.2 yuan(kWh) -1 each time, the relationship curve between the payback period and e quip ment uti liz a- tion i s sho wn in Figure 2: 3.4. The Break-Even Calculation of Typical Battery- Swapped Station at the Urban Transport Stage Compared with the previous stage, this stage we set the  Break-Even Analysis on the Charging and Battery-Swapped Station of Electric Vehicles Copyright © 2013 SciRes. JPEE 4 equipment utilization equal to 0.5. According to the dif- ferent purchase prices such as generation price, 10 kV large industrial price and general commercial price, crit- ical charging prices are calculated in the different pay- back period of 5 years, 10 years, 15 years and 20 years. The calculated results are shown in Table 4. 3.5. Break-Even Calculation of Typical Charging Station at Worry Free Driving Stage According to the planning and construction program of an electric vehicle charging station, at wo rry free driving stage, the technology of electric vehicles will have been developed, and t he struct ure of power grid ha s been ab le to meet the needs of distributed charging, at the stage, the development of charging stations will be the main- st re am. At thi s s tage, the ownership of elec tric vehicles growth continuously, so set equipment utilization of this stage equal to 0.7, the con struction cost 1 B will be 12 million yuan; government subsidies will be dropped to 5%. Ac- cording to the different purchase prices such as genera- tion price, 10 kV large industrial price and general com- mercial price, critical charging prices are calculated in the different payback period of 5 years, 10 years, 15 years and 20 years. The calculated results are shown in Table 5. The purchase price used 0.727 yuan(kWh) -1 to calcu- late consider of the charging station commercial and so- cial operation. If we take 20 years as the cost recovery period and the equipment utilization is 100%, the lowest charging price is calc ulated a s 0.965 yuan(kWh) -1. T hen we choose 0.9 yuan(kWh) -1 as a benchmark and in creased 0.2 yuan(kWh) -1 each time, the relationship curve bet ween the pa ybac k per iod and eq uipme nt uti liza- tion i s sho wn in Figure 3. Figure 2. The relationship curve between the payback period and equipment util ization. Table 4. Break-even charging price i n the diffe rent pay bac k period at t he urban tra nsport st ages. p2(yuan/kWh) t(years) 0.3912 0.565 0.727 5 3.160 3.365 3.555 10 2.098 2.302 2.493 15 1.744 1.948 2.139 20 1.566 1.771 1.962 Table 5. the break-even charging price in the different payback period at the urba n transport stage . p2(yuan/kWh) t(yea r s) 0.3912 0.565 0.727 5 0.954 1.158 1.349 10 0.747 0.952 1.142 15 0.678 0.883 1.073 20 0.644 0.848 1.039 Figure 3 . Equipment ut ilization and investment pa yback curve. 4. Conclusions At the present time, due to the fewer vehicles, low equipment and weak technological reliability, the con- struction and operation of the electric vehicle charging station project is at a loss. To ensure the full cost recov- ery of the charging station and its healthy development, governments need to increase policy support for the electric vehicle charging station, introducing a special charging price and giving preferential treatment in the charge of land and taxation. The operators of charging station should strive to expand the scope and variety of  Break-Even Analysis on the Charging and Battery-Swapped Station of Electric Vehicles Copyright © 2013 SciRes. JPEE 5 services, develop the market to increase revenue. Only in this way can the operation cost of charging station be reduced and the industries of electric vehicles will be thrived. REFERENCES [1] [1] DU Cheng-gang, LI Jin, HU Chao, et al. "Smart Grid Construction Promotes the Rapid De- velopment of Electric Vehicle Industry, "D istribu- tion & Utilization, vol.27, pp.5-9, 2010. [2] ZHOU Feng-quan, LIAN Zhan-wei, WANG Xiao-lei, et al. "Discussion on operation mode to the electric vehicle charging station, " Power System Protection and Control, vol.38, pp. 63-66, 2010. [3] KANG Ji-guang, W E I Z hen -lin, CHEN G Dan-ming, et a1. "Research on Electric Vehicle Charging Mode and Charging Stations Construction," Demand Side Management, vol.11, pp.69-71, 2009. [4] LU Mang, ZHOU Xiao-bing, ZHANG Wei, "Re- search on Development of Charging Facilities for Electric Vehicles at Home and Abroad, "Central China Electric Power , vol.23, pp. 16-20, 2010. [5] G.de Kook, K.H.van Donselaar, and T. van Woen- sel, "A break-even analysis of RFID technology for inventory sensitive to shrinkage," International Journal of Production Economics, vol. 112, pp. 521-531, 2008. [6] M. B. Dematawewa and P. J. Berger, "Break-Even Cost of Cloning in Genetic Improvement of Dairy Cattle,” Journal of Dairy Science, vol. 81, pp.1136-1147, 1998. [7] Hayes and M.E.Goddard, "Break-even cost of ge- notyping genetic mutations affecting eco nomic traits in Australian pig enterprises,” Livestock Production Science, vol. 89, pp. 235-242, 2004. [8] L.John D," Break-even analysis: a useful manage- ment tool in the lodging industry," International Journal of Hospitality Management, vol. 2, pp. 115-120, 1983. [9] S. L. Keas, E. Jacobs, D. Harrison, K. Farmer, and D. Thompson, "Future economic outlook of Nebraska rural community pharmacies based on break-even analysis of community operational costs and county population,” Research in Social and Administrative Pharmacy, vol. 6, pp. 209-220. [10] N. S. Kim and B. Van Wee, "The relative impor- tance of factors that influence the break-even dis- tance of inter-modal freight transport systems,” Journal of Transport Geography, vol. 19, pp. 859-875. |