 Energy and Power Engineering, 2013, 5, 109-128 http://dx.doi.org/10.4236/epe.2013.51011 Published Online January 2013 (http://www.scirp.org/journal/epe) Prime Energy Challenges for Operating Power Plants in the GCC Mohamed Darwish, Rabi Mohtar Qatar Environment and Energy Research Institute, Qatar Foundation, Doha, Qatar Email: madarwish@qf.org.qa Received September 2, 2012; revised October 5, 2012; accepted October 20, 2012 ABSTRACT There is a false notion of existing available, abundant, and long lasting fuel energy in the Gulf Cooperation Council (GCC) Countries; with continual income return from its exports. This is not true as the sustainability of this income is questionable. Energy problems started to appear, and can be intensified in coming years due to continuous growth of energy demands and consumptions. The demands already consume all produced Natural Gas (NG) in all GCC, except Qatar; and the NG is the needed fuel for Electric Power (EP) production. These countries have to import NG to run their EP plants. Fuel oil production can be locally consumed within two to three decades if the current rate of consumed en- ergy prevails. The returns from selling the oil and n atural gas are the main income to most of the GCC. While NG and oil can be used in EP plants, NG is cheaper, cleaner, and has less negative effects on the environment than fuel oil. Moreover, oil has much better usage than being burned in steam generators of steam power plants or combustion chambers of gas turbines. Introducing renewable energy or nuclear energy may be a necessity for the GCC to keep the flow of their main income from exporting oil. This paper reviews the GCC productions and consumptions of the prime energy (fuel oil and NG) and their role in electric power production. The paper shows that, NG should be the only fossil fuel used to run the power plants in the GCC. It also shows that the all GCC except Qatar, have to import NG. They should diversify the prime energy used in power plants; and consider alternative energy such as nuclear and renewable energy, (solar and wind ) energy. Keywords: Gulf Co-Operation Council (GCC); Electric Power; Natural Gas; Crude Oil; Renewable Energy; Gas Turbine Combined Cycle; Integrated Solar Combined Cycle; Oil and Natural Gas Reserves 1. Introduction The Arab Gulf Co-operation Countries (GCC) includes Qatar, Saudi Arabia (SA), United Arab Emirates (UAE), Kuwait, Bahrain, and Oman. They have about 57% of world petroleum oil reserves and 28% of world Natural Gas (NG) reserves, [1]. The GCC are the main producers and suppliers of oil and NG to the world, see Figures 1-5, [1,2], and Table 1 , [3]. The returns from exporting oil and NG represent the primary income to most of the GCC. For example, SA is the world’s largest producer and exporter of total petro- leum liquids in 2010, and the world’s second largest crude oil producer behind Russia. SA’s economy depends heavily on crude oil. In 2010, SA oil export revenues have accounted for 80% - 90% of total revenues and more than 40% of gross domestic product (GDP). Kuwait Petroleum export revenues account for half of the GDP, 95% of total export earning, and 95% of government revenues in 2010. Although Bahrain has a minor role in o il production , its economy depends heavily on hydrocarbon exports, mostly refined products, which account for 70% of the government revenues. Qatar’s oil and gas sectors ac- counted for over half of its GDP in 2010. Qatar is who lly dependent on oil and NG for all of its primary energy demands. In 2009, the NG consumption in some of the GCC was very high. For example, SA consumed 68.3 billion cubic meters BCM (2.3% of total worldwide consumption), and UAE consumed 39.6 BCM (1.3% of world consumption). Also, SA has the highest crude oil consumption per capita in the world. Its crude oil con- sumption in 2009 was 2.376 Million (M) barrels per day (Mbbl/d) or 0.3778 M ton/d. For 25 M population, this gives 33.7 bbl per year per capita (bbl/y.ca), or 5.36 ton/y.ca. The plentiful reserves and high productions of prime energy (i.e. NG and fuel oil) give the notion of existing available, abundant, and long lasting fuel energy in GCC; with continual income of its export. This is not true; and the sustainability of this in come is questionable. [4] pointed that there are major challenges that neces- s itate significant changes in the GCC energy policy such C opyright © 2013 SciRes. EPE 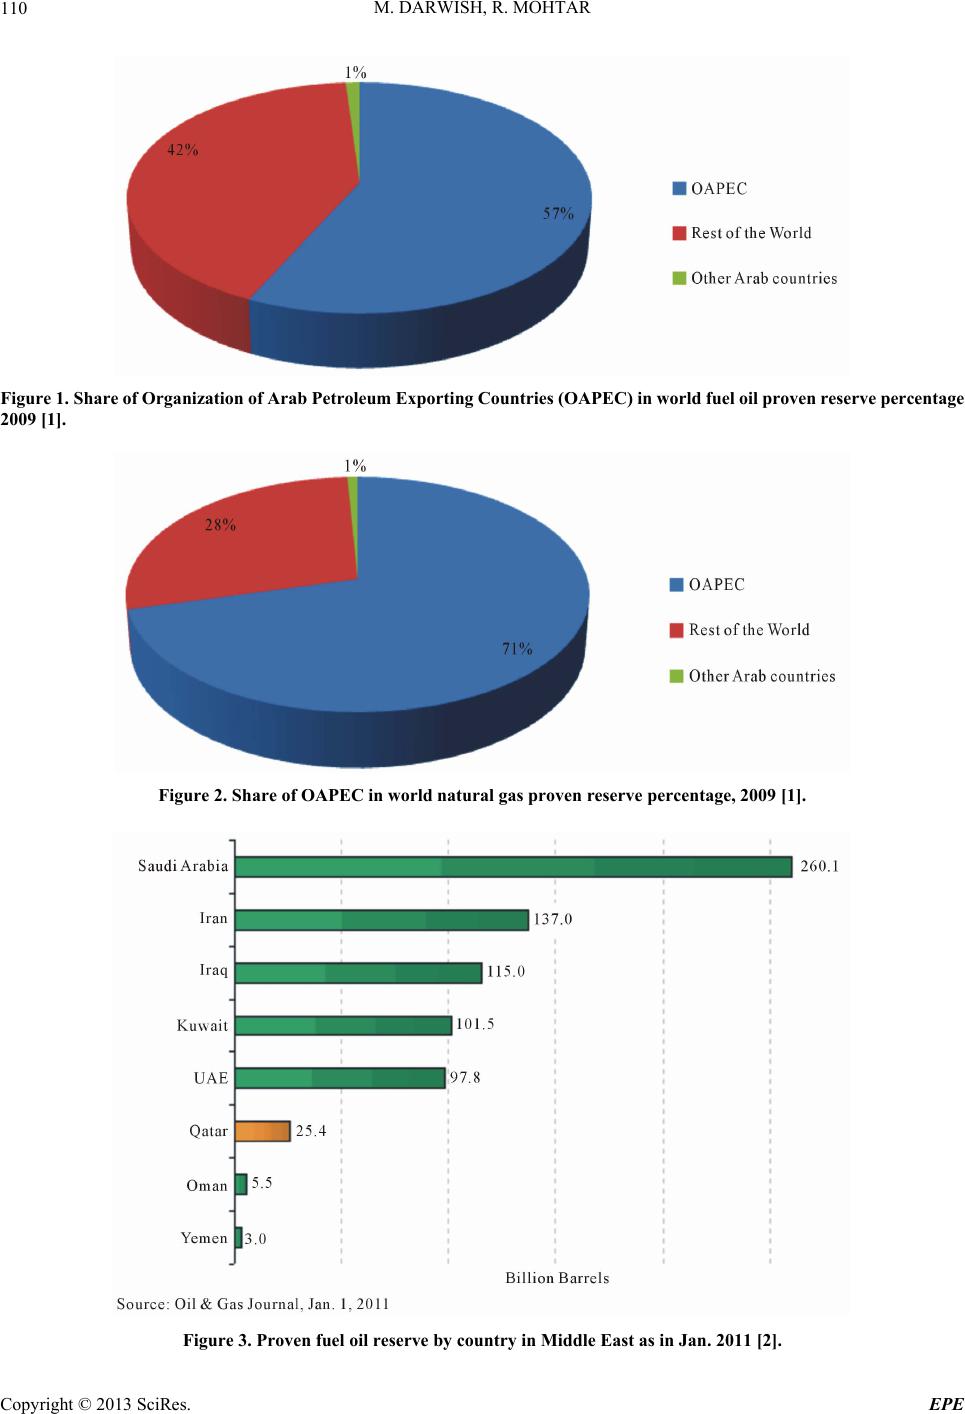 M. DARWISH, R. MOHTAR 110 Figure 1. Share of Organization of Arab Petro leum Exp orting Countries (OAPEC) in world fu el oil proven r eserve perc entage 2009 [1]. Figure 2. Share of OAPEC in world natural gas proven reserve percentage, 2009 [1]. Figure 3. Proven fuel oil reserve by country in Middle East as in Jan. 2011 [2]. Copyright © 2013 SciRes. EPE  M. DARWISH, R. MOHTAR 111 Figure 4. Natural gas reserve by country, Jan. 1, 2011 [2]. Figure 5. OPEC crude oil production by country, [2]. as the rising consumption of petroleum products, the wa- ter shortages and desertification, and the climate change. The UAE, is already on the verge of NG crisis; by 2015-2016. The NG production in the UAE is predicted to increase significantly, by an estimated 14.4 BCM/y when several non-associated fields start producing. But this increase will be accompanied by a significant in- crease in gas demands over the same period. In spite of the gas allocation issues, the UAE’s state-owned compa- nies are pressing ahead with diversification into petro- chemicals, building additional plants that demand large quantities of gas [5]. 2. NG Fuel Shortage in GCC Although the GCC has huge NG resources (about 28% of the world), there is a serious shortage in the needed NG Copyright © 2013 SciRes. EPE  M. DARWISH, R. MOHTAR 112 Table 1. NG produced by some Arab countries and other and their rank worldwide, in BCM in 2009, [3]. Rank Country Production (BCM) 1 United States 593.400 2 Russia 546.8 5 Iran 116.3 7 Algeria 86.500 10 Saudi Arabia 77.1 11 Qatar 76.98 14 Egypt 62.7 18 United Arab Emirates 50.24 28 Oman 24 33 Libya 15.9 37 Kuwait 12.7 38 Bahrain 12.64 47 Syria 6.04 58 Iraq 1.88 93 Yemen 0.455 to run their Power Plants (PP), due to continually rising EP consumption. The subject was recently raised in few publications, (e.g. [6-8]). The NG demand is much more than the region’s gas exploration and production, and NG have to be imported, [6]. [6] mentioned that although the GCC began in 1977 exporting gas as the UAE built the region’s first Liquified Natural Gas (LNG) liquefaction terminal and began sending LNG to Japan; the GCC be- gan importing gas, as Kuwait received its first LNG cargo from Russia at its fast-track LNG receiving termi- nal at Mina Al-Ahmadi Gas Port (MAAGP). Other GCC, with the exception of Qatar, are considering importing NG to meet rapidly rising demands. Construction of Ku- wait’s MAAGP commenced in January 2008, and in April 2008 the Emirate of Dubai, UAE appointed Shell Company as advisor for building a fast-track LNG re- ceiving terminal and expects to receive its first gas in 2010. The growing shortage in gas is due to, [6]: in- creasing power consumption and the high share of gas in power generation; depleting oil fields and the gas use for oil recovery enhancement, increasing economic emphasis on the steel, aluminum, and petrochemicals sectors; gas exploration and production challenges; and long-term gas export commitments limit local supply. The gas supply outlook for the GCC remains bleak. Even if the prolonged recession slows down the gas de- mand increase, the gas shortage is expected to increase from about 19 BCM in 2009 to about 31 BM in 2015 in the GCC. If the growth returns to historical levels, the shortage is expected to in crease to more than 50 BCM in 2015, see Figures 6(a) and (b). [7] indicated that it seems counterintuitive that the GCC need to import gas (including from outside the re- gion). The reasons for this need include the fact that pro- duction has not kept pace with demand for gas in the region, but also relate to the development of the gas in- dustry in the Middle East. Another reason is much of the gas in the Middle East is sour or tight gas. This is par- ticularly the case in SA, the U AE and Oman. Recovery of such gas is time-consuming, technologically difficult and expensive. Sing mentioned that importing gas or LNG is the most economically and environmentally sound solu- tion to the GCC’s problem, especially for the power sector (a) (b) Figure 6. (a) Forec ast NG demand in GCC with and withou t slow economic growth (recession), [6]; (b) NG shortage in GCC with and without slow economic growth (recession), [6]. Copyright © 2013 SciRes. EPE  M. DARWISH, R. MOHTAR Copy EPE 113 right © 2013 SciRes. [8]. Importing gas or LNG will enable GCC countries to continu e their econ omic di vers if ic at io n e ff o rt s u si n g local gas as well as allow them to continue to export crude oil, sending value-added refined products to foreign markets instead of burning them as fuel for their own power needs. [9], and [10] urge the use of renewable energy as alterna- tives to NG. energy economy: industrialization, urbanization and mo- torization. These trends are associated with increasing, [12]: Quantities of energy consumption. Efficiency of energy use, in production and consump- tion. Diversificatio n of sources of energy. Saudi Arabia’s place in the world oil market is threat- ened by unrestrained domestic fuel consumption. In an economy dominated by fossil fuels, current patterns of energy demand are not only wasting valuable resources and causing excessive pollution, but also rendering the country vulnerable to economic and social crises. Glada and Stevens identified the insufficiency of the current political approaches, and the need for change emerges. The authors highlight as a dominating measure for the consolidation of consumption and the avoidance of a possible crisis, the increase in the fuel’s price [11]. Demand for clean and convenient energy at the point of use. According to US Energy Information Administration (EIA) predicts that 50% increase in power generation in the GCC from 2010 to 2030; and more than 90 percent of this incremental will be fulfilled by gas, significantly increasing the GCC power sector’s reliance on gas, see Figure 7(a). The GCC energy problems started and are expected to be intensified in near future due to high and continuous growth in energy demands and consumptions, especially in electric power (EP) generation. Most of EP plants are using either gas turbines (GT) or GT Combined Cycle (GTCC) with steam turbines as shown in Figure 7(a) for the whole GCC, and in Figure 7(b) for the case of SA as 3. Escalation of Energy Consumption in GCC Powerful long run trends continue to shape the modern (a) (b) Figure 7. (a) Projection of fuel used for the power generation in the GCC, [6]; (b) Electric Power capacity by steam, gas tur- ines, and gas turbines combined cycle, [13]. b  M. DARWISH, R. MOHTAR 114 example. These PP are mainly using Gas Turbines (GT) and GTCC with recommended NG as fuel, as shown in Figure 7(b). One of the main reasons of high consumption is the politically motivated low prices for both electricity and fuel. Other reasons include the high fuel consumptions by systems used for desalting seawater, which is main potable water resource in most GCC. The full production of the GCC petroleum products can be locally consumed within two to three decades if the current rate of fuel consumption pre va ils. In stark contrast to energy, water is an extremely scarce resource in the GCC, which is one of the world’s most arid regions. With only limited groundwater re- sources, and amid growing signs that groundwater is be- ing depleted by over-use, the GCC is facing potential water shortages. The GCC economies account for more than 40% of the world’s water desalination capacity, and much of that capacity is energy-intensive. To meet demand, govern- ments continue to build new desalination plants. Since these plants run on fossil fuels, efforts to boost the supply of energy, diversify fuel sources and improve energy efficiency will have a strong impact on the provision of water. Most of the GCC’s desalination plants use thermal sources, mainly natural gas. There is a significant and ongoing investment in dual-purpose co-generation plants, which produce both electricity and desalinated water through a comb ined th ermodynamic cycle, which is more efficient than separate production processes. These are encouraging initiatives, but there is still a lot of room for further energy s a vings in the desali na tion pro c e ss [14]. Escalation in EP consumptions in some of the GCC is illustrated by a few examples from the GCC. In SA, the EP consumption increased from 163,151 GWh to 193,472 GWh during 2006 to 2009, or 6% an- nual increase. The daily DW production increased from 1070 MIGD to 1013 MIGD MW during 2006 to 2009, almost steady. The EP generated plants installed capacity increased from 35,88 5 to 51 ,19 5 MW from 20 06 to 2009. The peak load increased from 31,240 to 39,900 MW from 2006 to 2009, or 9% annual increase, [15]. In 2007, the EP plants consumed 45.76 M ton equivalent fuel. This consists of 20.5 M metric ton equivalent of NG (22.78 BCM), 9.288 M ton Diesel oil, 7.566 M ton crude oil, and 6.233 M ton heavy fuel oil. The increases in NG and oil consumptions in EP plants are given in Figure 8. In 2010, the oil production in SA was 10.21 Mbbl/d; consisting of 8.4 Mbbl/d of crude oil, and 1.8 Mbbl/d of NG liquids (NGLs). Out of the 10.2 Mbbl/d, 7.3 Mbbl/d were exported, and 2.65 Mbbl/d were consumed. The 2009 consumption was 50% more than that of 2000 . The consumption growth was due to strong economic and industrial growth and subsidized prices, [17]. The trend of oil consumption increase is shown in Figure 9. According to Saudi Aramco forecasts, NG demand in SA is expected to be more than doubled to 14.5 trillion (T) cubic feet per day (TCF/d) by 2030, up from an esti- mated demand of 7.1 TCF/d in 2007. Saudi Arabia’s en- ergy consumption pattern is unsustainable. The country currently consumes over one-quarter of its total oil pro- duction—some 2.8 million barrels a day. This means that on a “business as usual” trajectory it would become a net oil importer in 2038 (see Figure 10). No one is suggest- ing this is the most likely outcome but the possibility does signal the urgency of the need for change. More oil reserves may be discovered and production raised, popu- lation growth may decline and new policies and technol- ogy may change consumption patterns, but in the absence of such events and with the country’s high dependence on oil revenues the economy would collapse before that point. The Saudi Arabia’s oil balance on a business-as- usual trajectory is shown in Figure 10. In order to free up petroleum for export, all current and Figure 8. Power generation by source, [16]. Copyright © 2013 SciRes. EPE  M. DARWISH, R. MOHTAR 115 Figure 9. Oil consumption increase in Saudi Arabia, [17]. Figure 10. The Saudi Arabia’s oil balance on a business-as-usual trajectory, [11]. future gas supplies (except NG liquids) reportedly remain for use in domestic industrial consumption and desalina- tion in SA. However, NG production (estimated at 2.7 TCF in 2007) remains limited, as the soaring costs of production, exploration, processing and distribution of gas have squeezed supply, while an estimated 13% to 14% of total production is lost in venting, flaring, rein- jection and natural processes according to OPEC and other sources, [15]. SA has no net imports or exports of NG. The 2009 NG production was estimated by 3.2 TCF; and was totally consumed locally. The total consumed fuels (NG and oil) increased from 1.798 million equiva- lent barrels per day (Mebbl/d) in 2000 to 3.0322 Mebbl /d in 2009, an annual increase of 6%, [15]. The total produced energy in 2009 was 11.3402 Mebbl /d, and thus the consumed to produced ratio was 26.7% in 2009. The consumed energy is expected to reach most of the oil production (8.5 M-boe/d) in 2028. In the UAE, the EP consumption increased in Abu Dhabi from 25,424 to 31,478 GWh from 2003 to 2008, and in Dubai from 16,572 to 23,571 GWh from 2005 in 2010, [9]. The consumed fuel energy increased from 0.686 Mebbl/d in 2000 to 1.4467 Mebbl/d in 2009, an- nual increase of 8.6%. The UAE total fuel energy pro- duction in 2009 was 3.477 Mebbl/d/d, or the consumed to produc ed ratio was 41.6%. The repo rted UAE popula- tion in 2009 was 5.066 million, and this gives annual consumed Mebbl per year per capita (Mebbl/y.ca) as 104 Mebbl/y.ca, [18]. The UAE is more aware of the energy problem than other GCC. This is clear from starting to build a nuclear power plant of 4 reactors of 1400 MW each, and their active participation in renewable energy Copyright © 2013 SciRes. EPE 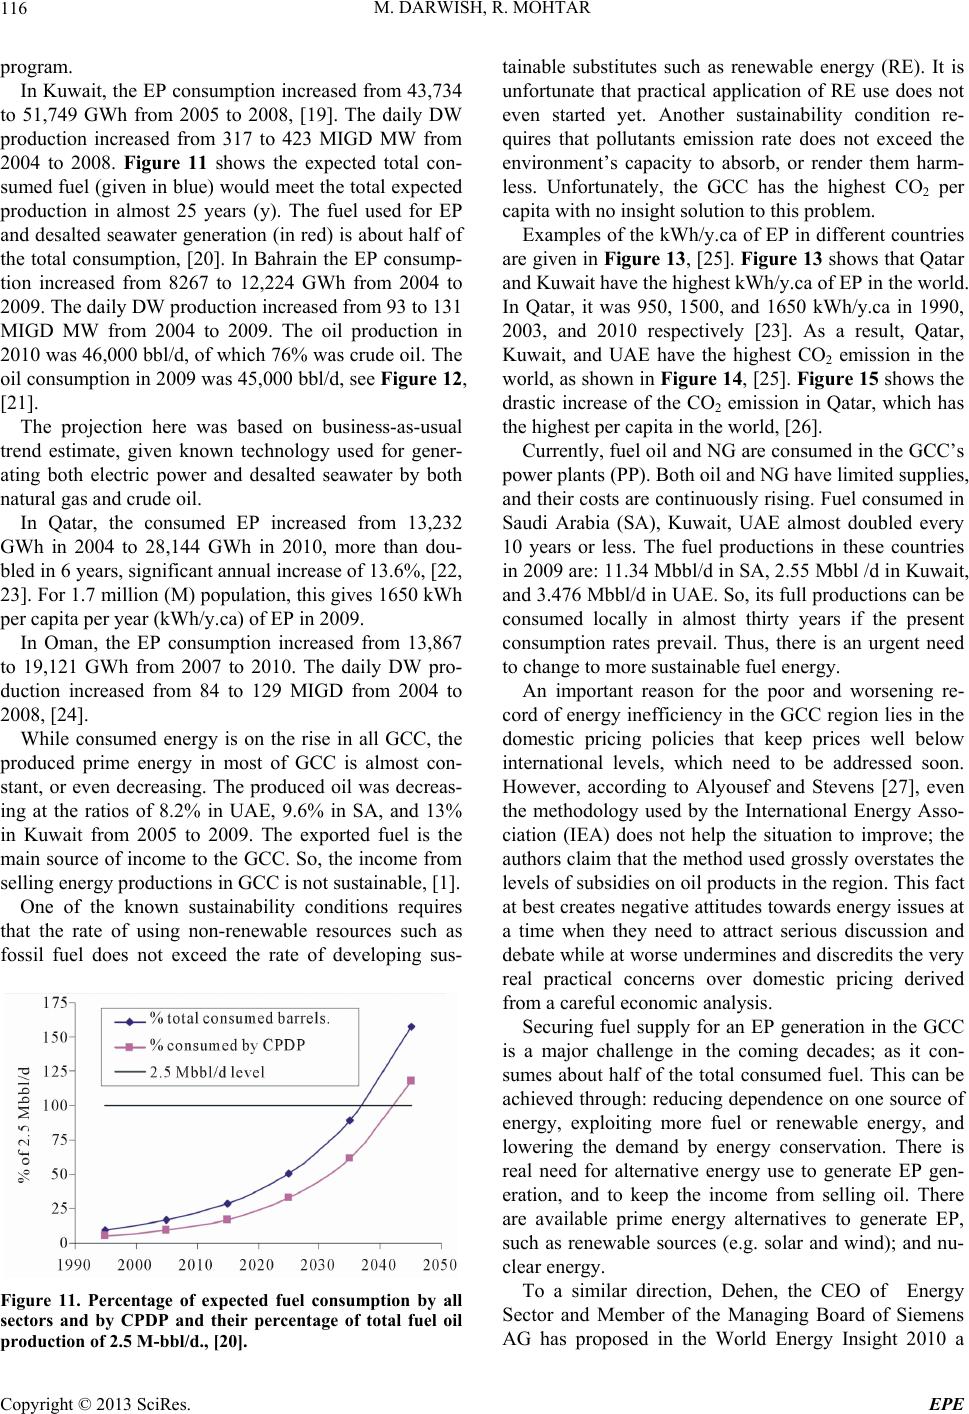 M. DARWISH, R. MOHTAR 116 program. In Kuwait, the EP consumption increased from 43,734 to 51,749 GWh from 2005 to 2008, [19]. The daily DW production increased from 317 to 423 MIGD MW from 2004 to 2008. Figure 11 shows the expected total con- sumed fuel (given in blue) would meet the total expected production in almost 25 years (y). The fuel used for EP and desalted seawater generation (in red) is about half of the total consumption, [20]. In Bahrain the EP consump- tion increased from 8267 to 12,224 GWh from 2004 to 2009. The daily DW production increased from 93 to 131 MIGD MW from 2004 to 2009. The oil production in 2010 was 46 ,000 bbl/d , of wh ich 76% wa s crude oil. The oil consumption in 2009 was 45,000 bbl/d, see Figure 12, [21]. The projection here was based on business-as-usual trend estimate, given known technology used for gener- ating both electric power and desalted seawater by both natural gas and crude oil. In Qatar, the consumed EP increased from 13,232 GWh in 2004 to 28,144 GWh in 2010, more than dou- bled in 6 years, significant annual increase of 13.6%, [22, 23]. For 1.7 million (M) population, this gives 1650 kWh per capita per year (kWh/y.ca) of EP in 2009. In Oman, the EP consumption increased from 13,867 to 19,121 GWh from 2007 to 2010. The daily DW pro- duction increased from 84 to 129 MIGD from 2004 to 2008, [24]. While consumed energy is on the rise in all GCC, the produced prime energy in most of GCC is almost con- stant, or even decreasing. The produced oil was decreas- ing at the ratios of 8.2% in UAE, 9.6% in SA, and 13% in Kuwait from 2005 to 2009. The exported fuel is the main source of income to the GCC. So, the income from selling energy productions in GCC is not sustainable, [1]. One of the known sustainability conditions requires that the rate of using non-renewable resources such as fossil fuel does not exceed the rate of developing sus- Figure 11. Percentage of expected fuel consumption by all sectors and by CPDP and their percentage of total fuel oil production of 2.5 M-bbl/d., [20]. tainable substitutes such as renewable energy (RE). It is unfortunate that practical application of RE use does not even started yet. Another sustainability condition re- quires that pollutants emission rate does not exceed the environment’s capacity to absorb, or render them harm- less. Unfortunately, the GCC has the highest CO2 per capita with no insight solution to this problem. Examples of the kWh/y.ca of EP in different countries are given in Figure 13, [25]. Figure 13 shows that Qatar and Kuwait have the highest kWh/ y .ca of EP in the world . In Qatar, it was 950, 1500, and 1650 kWh/y.ca in 1990, 2003, and 2010 respectively [23]. As a result, Qatar, Kuwait, and UAE have the highest CO2 emission in the world, as shown in Figure 14, [25]. Figure 15 shows the drastic increase of the CO2 emission in Qatar, which has the highest per capita in the world, [26]. Currently, fuel oil and NG are consumed in the GCC’s power plants (PP). Both oil and NG have limited supplies, and their costs are continuously rising. Fuel consumed in Saudi Arabia (SA), Kuwait, UAE almost doubled every 10 years or less. The fuel productions in these countries in 2009 are: 11.34 Mbb l/d in SA, 2.55 Mbbl /d in Kuwait, and 3.476 Mbbl/d in UAE. So, its full production s can be consumed locally in almost thirty years if the present consumption rates prevail. Thus, there is an urgent need to change to more sustainable fuel energy. An important reason for the poor and worsening re- cord of energy inefficiency in the GCC region lies in the domestic pricing policies that keep prices well below international levels, which need to be addressed soon. However, according to Alyousef and Stevens [27], even the methodology used by the International Energy Asso- ciation (IEA) does not help the situation to improve; the authors claim that the method used grossly overstates the levels of subsidies on oil prod ucts in the region. This fact at best creates negative attitudes toward s energy issues at a time when they need to attract serious discussion and debate while at worse undermines and discredits the very real practical concerns over domestic pricing derived from a careful economic analysis. Securing fuel supply for an EP generation in the GCC is a major challenge in the coming decades; as it con- sumes about half of the total consumed fuel. This can be achieved through: reducing dependence on one source of energy, exploiting more fuel or renewable energy, and lowering the demand by energy conservation. There is real need for alternative energy use to generate EP gen- eration, and to keep the income from selling oil. There are available prime energy alternatives to generate EP, such as renewable sources (e.g. solar and wind); and nu- clear energy. To a similar direction, Dehen, the CEO of Energy Sector and Member of the Managing Board of Siemens G has proposed in the World Energy Insight 2010 a A Copyright © 2013 SciRes. EPE 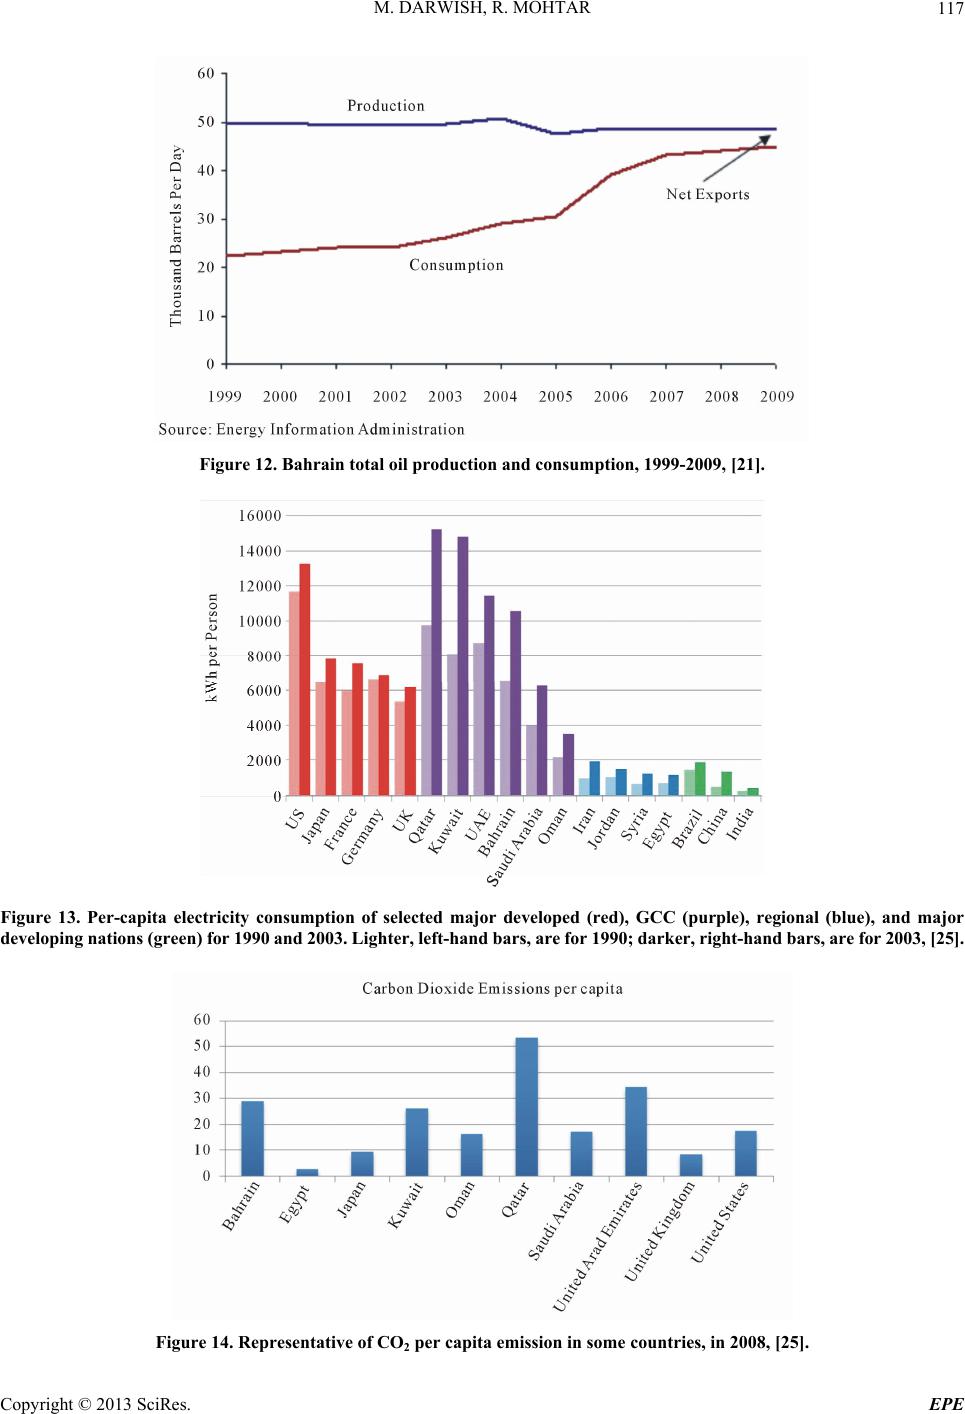 M. DARWISH, R. MOHTAR Copyright © 2013 SciRes. EPE 117 Figure 12. Bahrain total oil production and consumption, 1999-2009, [21]. Figure 13. Per-capita electricity consumption of selected major developed (red), GCC (purple), regional (blue), and major developing nations (green) for 1990 and 2003. Lighter, l eft-hand bars, are for 1990; darker, right-hand bars, are for 2 003, [25]. Figure 14. Representative of CO2 per capita emission in some countries, in 2008, [25]. 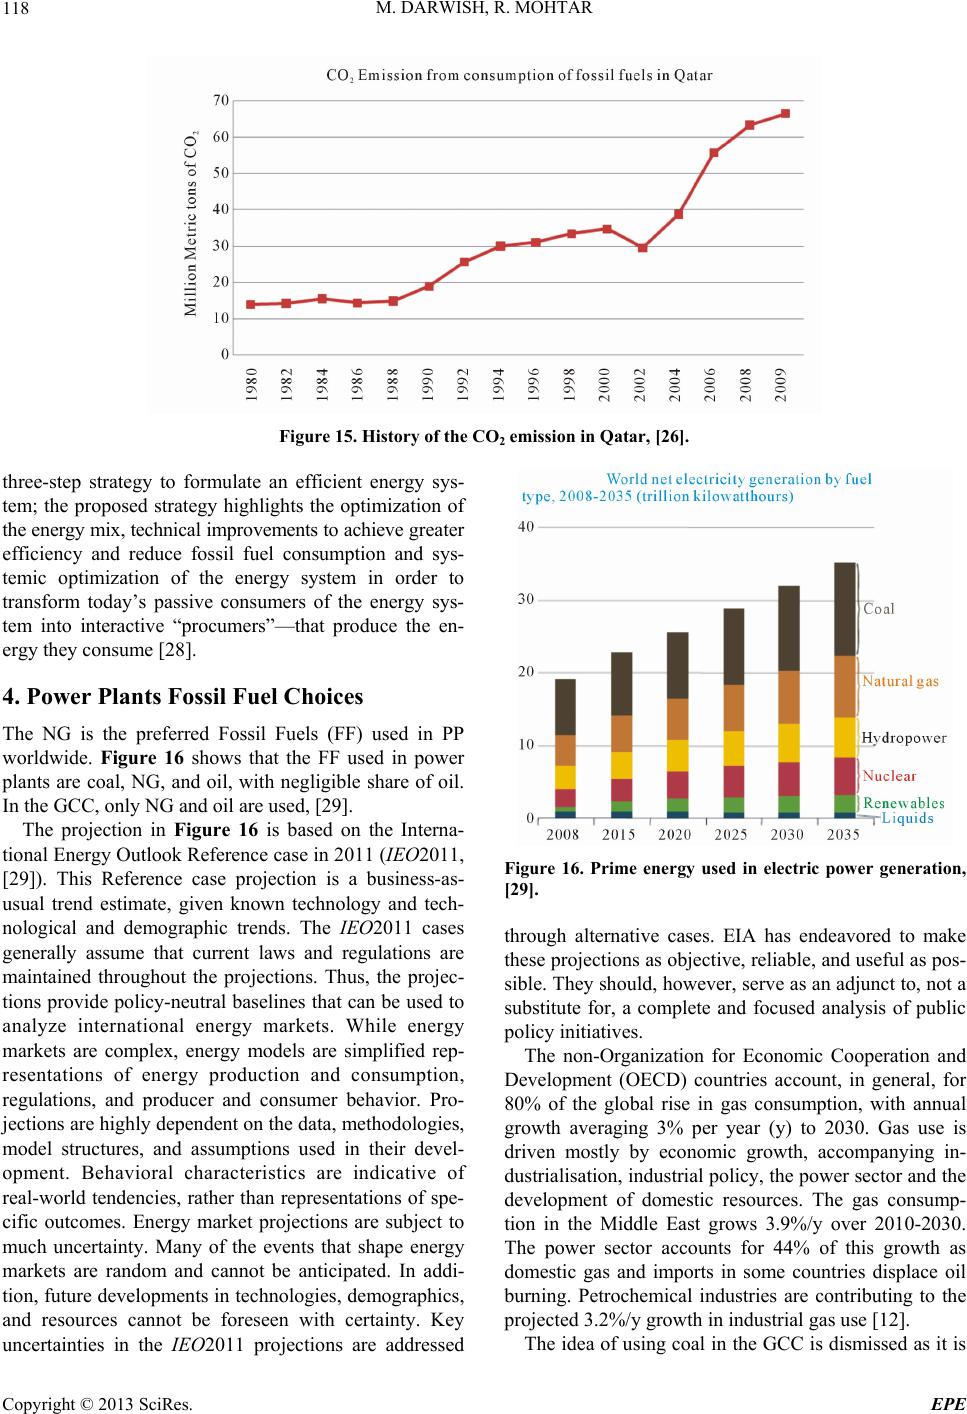 M. DARWISH, R. MOHTAR 118 Figure 15. History of the CO2 emission in Qatar, [26]. three-step strategy to formulate an efficient energy sys- tem; the proposed strategy highlights the optimization of the energy mix, technical improvements to achieve grea t er efficiency and reduce fossil fuel consumption and sys- temic optimization of the energy system in order to transform today’s passive consumers of the energy sys- tem into interactive “procumers”—that produce the en- ergy they consume [28]. 4. Power Plants Fossil Fuel Choices The NG is the preferred Fossil Fuels (FF) used in PP worldwide. Figure 16 shows that the FF used in power plants are coal, NG, and oil, with negligible share of oil. In the GCC, only NG and oil are used, [29]. The projection in Figure 16 is based on the Interna- tional Energy Outlook Reference case in 2011 (IEO2011, [29]). This Reference case projection is a business-as- usual trend estimate, given known technology and tech- nological and demographic trends. The IEO2011 cases generally assume that current laws and regulations are maintained throughout the projections. Thus, the projec- tions provide policy-neutral baselines that can be used to analyze international energy markets. While energy markets are complex, energy models are simplified rep- resentations of energy production and consumption, regulations, and producer and consumer behavior. Pro- jections are highly dependent on the data, methodologies, model structures, and assumptions used in their devel- opment. Behavioral characteristics are indicative of real-world tendencies, rather than representations of spe- cific outcomes. Energy market projections are subject to much uncertainty. Many of the events that shape energy markets are random and cannot be anticipated. In addi- tion, future developments in technologies, demographics, and resources cannot be foreseen with certainty. Key uncertainties in the IEO2011 projections are addressed Figure 16. Prime energy used in electric power generation, [29]. through alternative cases. EIA has endeavored to make these projections as objective, reliable, and useful as pos- sible. They should, however, serve as an adju nct to, no t a substitute for, a complete and focused analysis of public policy initiatives. The non-Organization for Economic Cooperation and Development (OECD) countries account, in general, for 80% of the global rise in gas consumption, with annual growth averaging 3% per year (y) to 2030. Gas use is driven mostly by economic growth, accompanying in- dustrialisation, industrial policy, the power sector and the development of domestic resources. The gas consump- tion in the Middle East grows 3.9%/y over 2010-2030. The power sector accounts for 44% of this growth as domestic gas and imports in some countries displace oil burning. Petrochemical industries are contributing to the projected 3.2%/y growth in industrial gas use [12]. The idea of using coal in the GCC is dismissed as it is Copyright © 2013 SciRes. EPE  M. DARWISH, R. MOHTAR 119 not practical for several reasons. Coal combustion affects the environment more badly than both NG and oil. Compared with oil and gas, coal emits more greenhouse gases (GHG), mainly CO2, causing global warming; and more air polluting gases such as sulfur oxides and nitro- gen oxides. The infrastru cture for transporting coal is not available in GCC, such as railways. A coal PP of say 3000 MW, a typical capacity of a power plant in the GCC, would consume about 500 kg of coal per second, or 43,200 tons daily. This requires 4320 full trucks of 10 tons load daily to supply the coal to the power plant. Large power plants using coal is usually located close to coal mines, or served by railways to transport the coal. Moreover, supplying coal from a foreign country is ex- pensive and unsecured. decreasing in the future. The oil has much better usage than being burned in PP such as steam generator of steam PP or combustion chambers in PP using GT, as show n in Figure 17, [29]. Crude or heavy oil is used in boilers of steam Power Plants (PP). This practice of using heavy oil is slowly dying out in favor of NG because lot of pollutants is re- leased into the air due to burning of the oil compared to NG. In the US, the residual oil share in generating EP decreased from 16.8% in 1973 to 6.2% in 1983, [30]. In 2005, electricity generation from all forms of petroleum, including diesel and residual fuel was only 3% of total production. The d ecline is the result of price competition with NG an d en vir onm ent al restri cti ons on e mi ssio ns. F or PP, the costs of heating heavy oil, extra pollution control and additional maintenance required after burning are often outweighed the low cost of the heavy (or residual) fuel. Burning residual fuel oil also produces much darker smoke and uniformly higher carbon dioxide emissions than NG, [30]. There are no prospects of using oil in running PP worldwide in the future, as shown in Figure 17, [29]. T his figure shows that the share of oil in power generation is either kept the sam e by the already oil operat ed PP or even Figure 17. Prospects of fuel oil usages, [29]. Most PPs in the GCC is using gas turbines (GT) or GT combined cycle (GTCC), see Figure 7 for the case of Saudi Arabia. In GCC, the hot gases discharged from the GT are used in heat recovery steam generator (HRSG) to produce steam. The steam is then used to drive steam turbine to generate more EP without adding more fuel. NG or light fuel oil is burned in the combustion cham- bers of the GT. The light oil is more expensive than heavy oil, and much higher than NG. O il h as muc h be tter uses for transportation and petrochemical industry than being burned in boilers of steam turbines or in combus- tion chambers. Figures 18 and 19 show the cost of dif- ferent fuels (coal, NG, and heavy oil) used for EP gen- eration; and the cost ratio of NG to oil. Figure 20 shows the operating cost of generating EP when different fuels (nuclear, coal, NG, and oil) are used. In conclusion, the use of fuel oil in EP production is much more costly and more polluting to the environment compared to NG. So, oil burning in PP’s is decreasing and should be com- pletely stopped in the GCC countries. The remaining and more economical FF used for PP is NG. This also came as a result of power plant industries, where the GTCC using NG is the most preferred PP worldwide. The power plants using GT are the easiest and cheap- est PP to build. The GTCC have the highest efficiency. The GTCC is the first best choice for EP generation in the GCC. Besides, the transportation of gas is more ex- pensive than that of oil; and exporting oil return is much higher than that of NG, even in liquefied form. Qatar and the UAE use only NG for EP production. Other GCC, such as SA and Kuwait, augment their NG production with fuel oil. It is unfortunate that Kuwait and SA still make extensive use of crude oil for power generation because of limited gas availability. In 2010, the only 34% of electricity was produced from gas in Saudi Arabia, see Figure 21, [34]. 5. Natural Gas in the GCC and EP Generation Convention al PP and (or CPDP) utilizing GT and GTCC should use only NG. The NG is clean fuel with less pol- luting gases when combusted than oil. Moreover, the price of oil is much higher than the price of NG, almost twice [32]. Figures 22(a)-(f), show the NG history of production and consumption in the GCC, [35-40]. Figure 22(a) shows that the production is more than the consumption in the GCC countries as a whole. However, with respect Copyright © 2013 SciRes. EPE 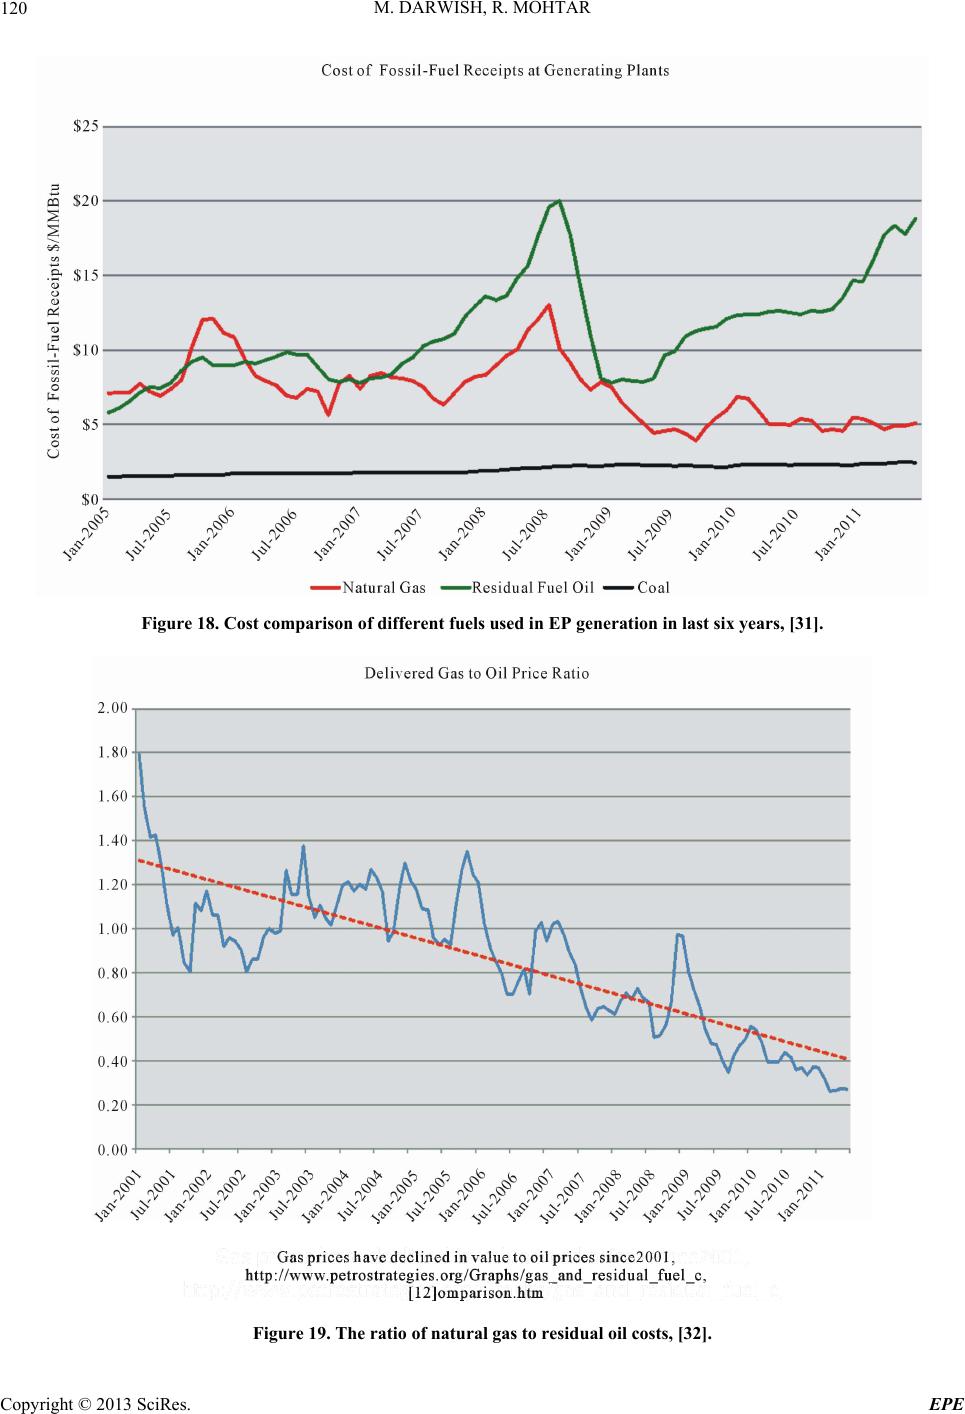 M. DARWISH, R. MOHTAR Copyright © 2013 SciRes. EPE 120 Figure 18. Cost comparison of different fuels used in EP generation in last six years, [31]. Figure 19. The ratio of natural gas to residual oil costs, [32]. 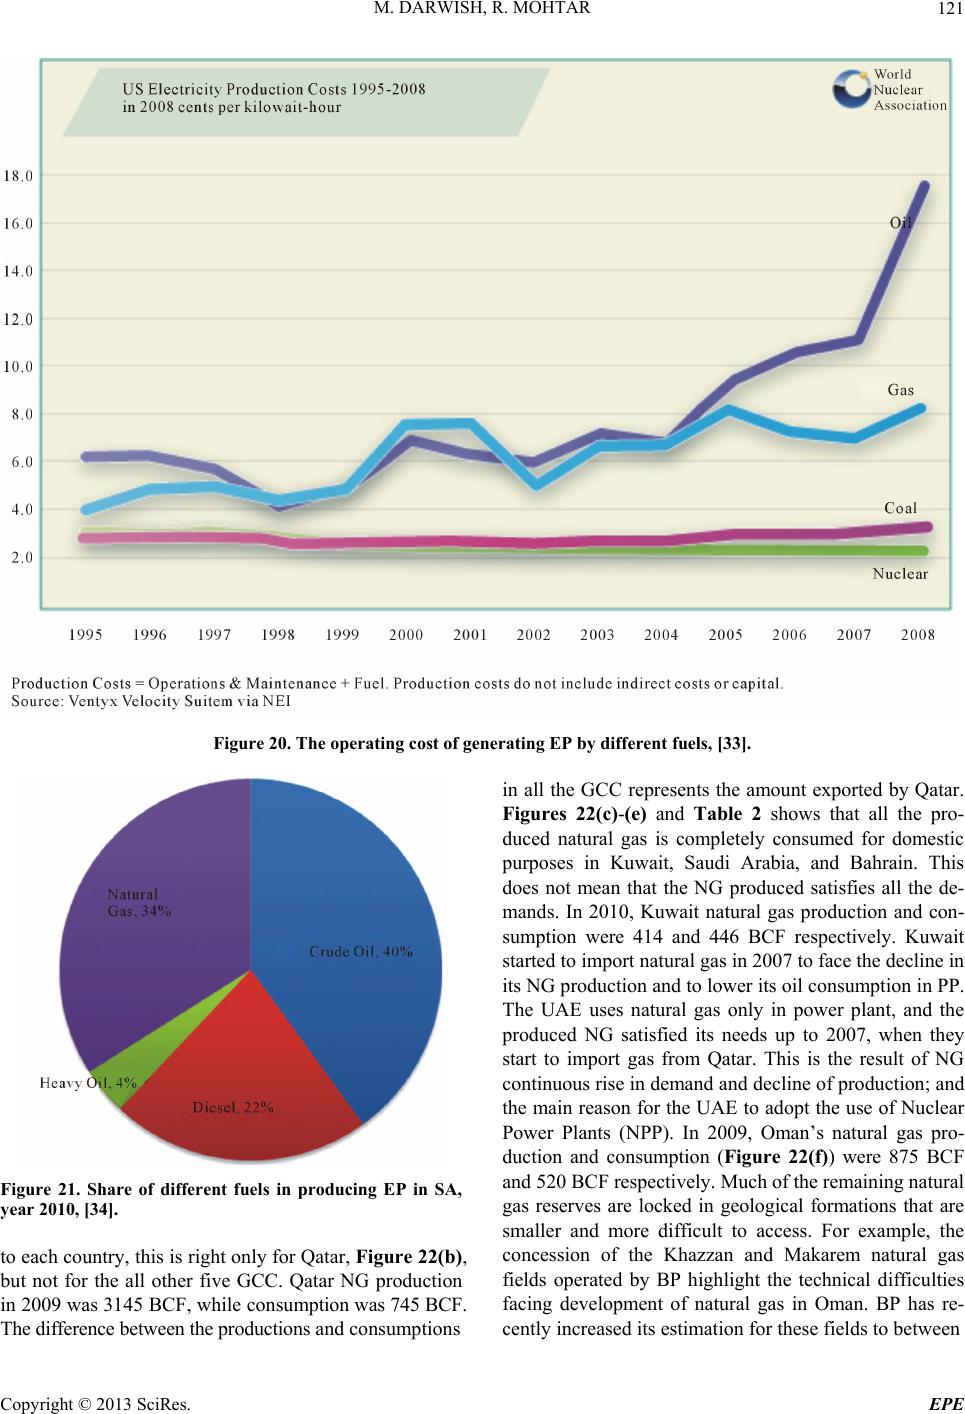 M. DARWISH, R. MOHTAR 121 Figure 20. The operating cost of generating EP by different fuels, [33]. Figure 21. Share of different fuels in producing EP in SA, year 2010, [34]. to each country, this is right only for Qatar, Figure 22(b), but not for the all other five GCC. Qatar NG production in 2 009 w as 31 45 BC F, w hi le con su mption was 745 BCF. The difference between the productions and consumptions in all the GCC represents the amount exported by Qatar. Figures 22(c)-(e) and Table 2 shows that all the pro- duced natural gas is completely consumed for domestic purposes in Kuwait, Saudi Arabia, and Bahrain. This does not mean that the NG produced satisfies all the de- mands. In 2010, Kuwait natural gas production and con- sumption were 414 and 446 BCF respectively. Kuwait started to import natural gas in 2007 to face the decline in its NG production and to lower its oil consumption in PP. The UAE uses natural gas only in power plant, and the produced NG satisfied its needs up to 2007, when they start to import gas from Qatar. This is the result of NG continuous rise in demand and decline of production; and the main reason for the UAE to adopt the use of Nuclear Power Plants (NPP). In 2009, Oman’s natural gas pro- duction and consumption (Figure 22(f)) were 875 BCF and 520 BCF respectively. Much of t he remaini ng nat u ral gas reserves are locked in geological formations that are smaller and more difficult to access. For example, the concession of the Khazzan and Makarem natural gas fields operated by BP highlight the technical difficulties facing development of natural gas in Oman. BP has re- cetly increased its estimation for these fields to between n Copyright © 2013 SciRes. EPE 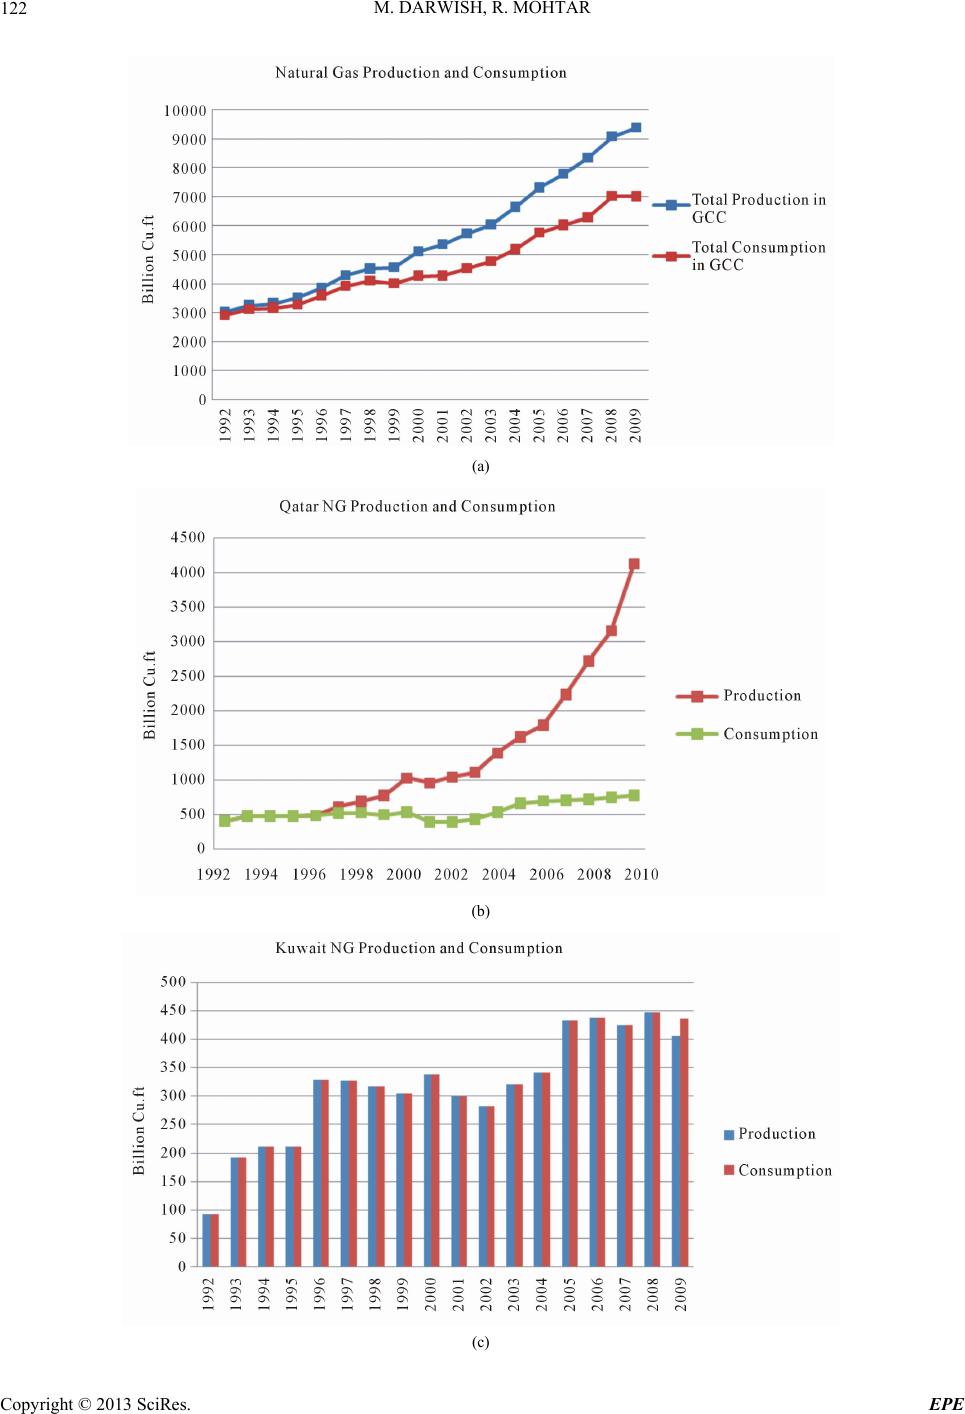 M. DARWISH, R. MOHTAR 122 (a) (b) (c) Copyright © 2013 SciRes. EPE 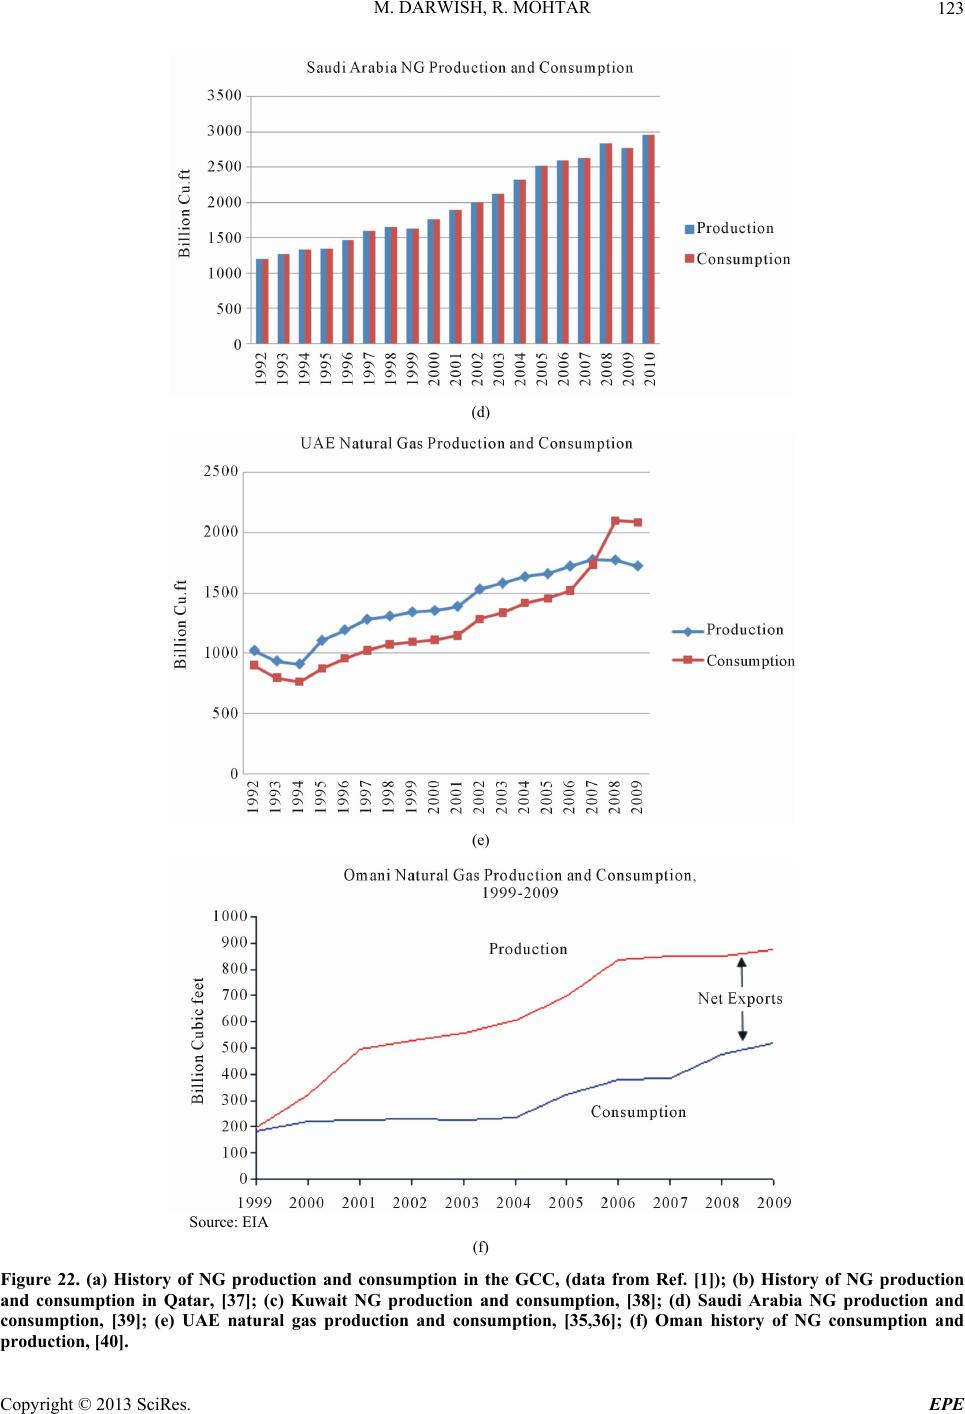 M. DARWISH, R. MOHTAR 123 (d) (e) Source: EIA (f) Figure 22. (a) History of NG production and consumption in the GCC, (data from Ref. [1]); (b) History of NG production and consumption in Qatar, [37]; (c) Kuwait NG production and consumption, [38]; (d) Saudi Arabia NG production and consumption, [39]; (e) UAE natural gas production and consumption, [35,36]; (f) Oman history of NG consumption and roduction, [40]. p Copyright © 2013 SciRes. EPE 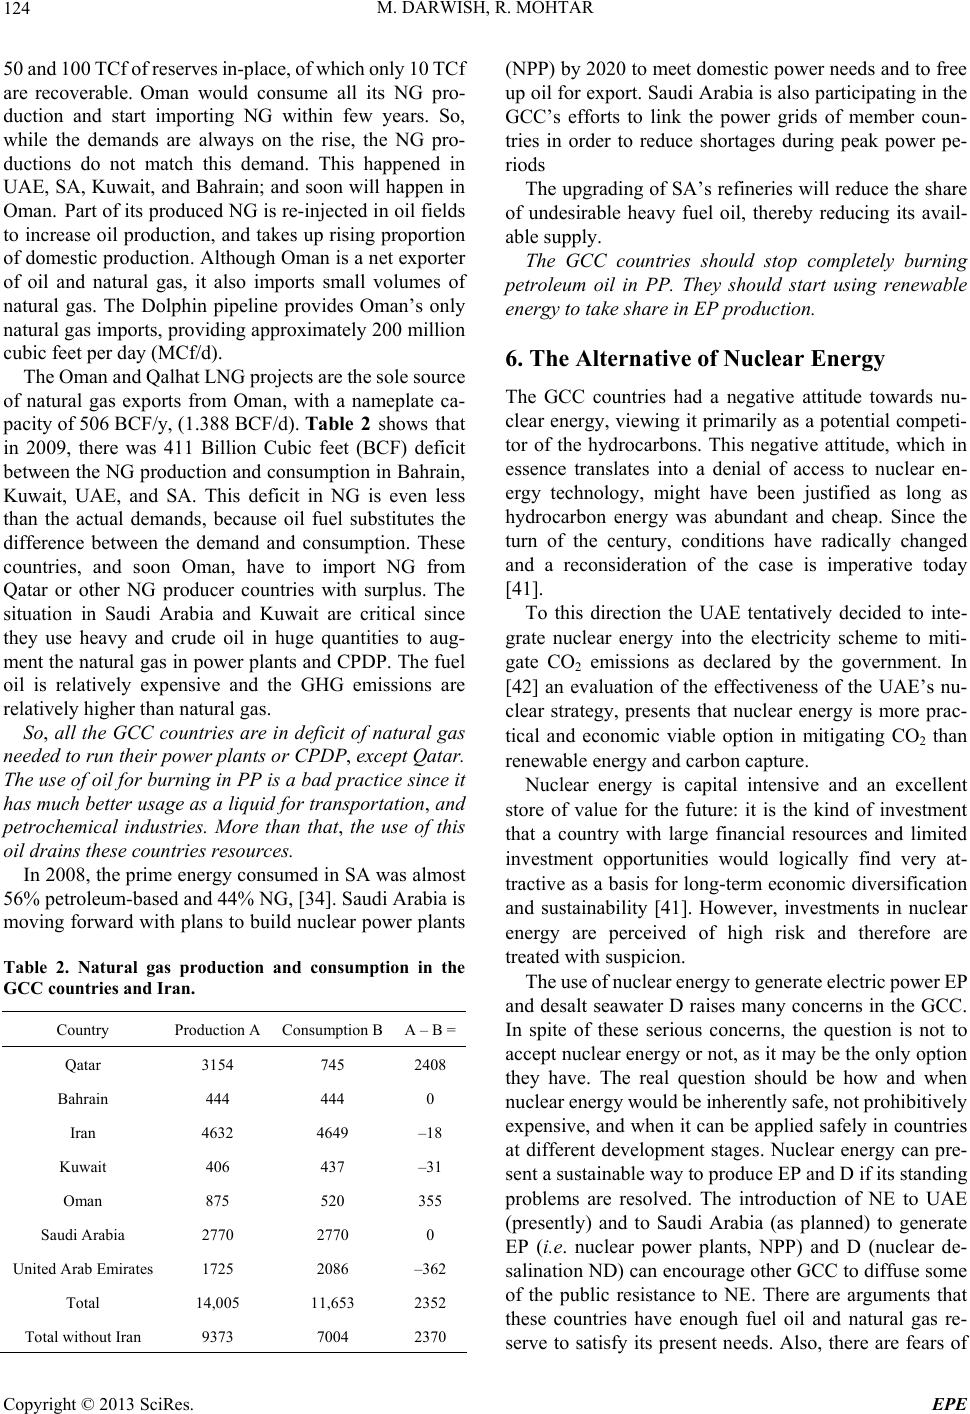 M. DARWISH, R. MOHTAR Copyright © 2013 SciRes. EPE 124 50 and 100 TCf of reserves in-place, of which only 10 TCf are recoverable. Oman would consume all its NG pro- duction and start importing NG within few years. So, while the demands are always on the rise, the NG pro- ductions do not match this demand. This happened in UAE, SA, Kuwait, and Bahrain; and soon will happen in Oman. Part of its produ ced NG is re-injected in oil field s to increase oil production, and takes up rising proportion of domestic production. Although Oman is a net exporter of oil and natural gas, it also imports small volumes of natural gas. The Dolphin pipeline provides Oman’s only natural gas imports, providing approximately 200 million cubic feet per day (MCf/ d) . The Oman a nd Qalhat LNG projects are the sole source of natural gas exports from Oman, with a nameplate ca- pacity of 506 BCF/y, (1.388 BCF/d). Table 2 shows that in 2009, there was 411 Billion Cubic feet (BCF) deficit between the NG production and consumption in Bahrain, Kuwait, UAE, and SA. This deficit in NG is even less than the actual demands, because oil fuel substitutes the difference between the demand and consumption. These countries, and soon Oman, have to import NG from Qatar or other NG producer countries with surplus. The situation in Saudi Arabia and Kuwait are critical since they use heavy and crude oil in huge quantities to aug- ment the natural gas in power plants and CPDP. The fuel oil is relatively expensive and the GHG emissions are relatively higher than natural gas. So, all the GCC countries are in deficit of natural gas needed to run their power plants or CPDP, except Qatar. The use of oil for burning in PP is a bad practice since it has much better usage as a liquid for transportation, and petrochemical industries. More than that, the use of this oil drains these countries resources. In 2008, the prime energy consumed in SA was almost 56% petroleum-based and 44% NG, [34]. Saudi Arabia is moving forward with plans to build nuclear power plants Table 2. Natural gas production and consumption in the GCC countries and Iran. Country Production A Consumption BA – B = Qatar 3154 745 2408 Bahrain 444 444 0 Iran 4632 4649 –18 Kuwait 406 437 –31 Oman 875 520 355 Saudi Arabia 2770 2770 0 United Arab Emirates 1725 2086 –362 Total 14,005 11,653 2352 Total without Iran 9373 7004 2370 (NPP) by 2020 to meet domestic power need s and to free up oil for export. Saudi Arabia is also participating in the GCC’s efforts to link the power grids of member coun- tries in order to reduce shortages during peak power pe- riods The upgrading of SA’s refineries will reduce the share of undesirable heavy fuel oil, thereby reducing its avail- able supply. The GCC countries should stop completely burning petroleum oil in PP. They should start using renewable energy to take share in EP production. 6. The Alternative of Nuclear Energy The GCC countries had a negative attitude towards nu- clear energy, viewing it primarily as a potential competi- tor of the hydrocarbons. This negative attitude, which in essence translates into a denial of access to nuclear en- ergy technology, might have been justified as long as hydrocarbon energy was abundant and cheap. Since the turn of the century, conditions have radically changed and a reconsideration of the case is imperative today [41]. To this direction the UAE tentatively decided to inte- grate nuclear energy into the electricity scheme to miti- gate CO2 emissions as declared by the government. In [42] an evaluation of the effectiveness of the UAE’s nu- clear strategy, presents that nuclear energy is more prac- tical and economic viable option in mitigating CO2 than renewable energy and carbon capture. Nuclear energy is capital intensive and an excellent store of value for the future: it is the kind of investment that a country with large financial resources and limited investment opportunities would logically find very at- tractive as a basis for long-term economic diversification and sustainability [41]. However, investments in nuclear energy are perceived of high risk and therefore are treated with suspicion. The use of nuclear energy to generate electr ic power EP and desalt seawater D raises many concerns in the GCC. In spite of these serious concerns, the question is not to accept nuclear energy or not, as it may be the only option they have. The real question should be how and when nuclear energy would be inherently safe, not prohibitively expensive, and when it can be applied safely in coun tries at different development stages. Nuclear energy can pre- sent a sustai na bl e way to pro duce EP and D i f i t s st a nding problems are resolved. The introduction of NE to UAE (presently) and to Saudi Arabia (as planned) to generate EP (i.e. nuclear power plants, NPP) and D (nuclear de- salination ND) can encourage other GCC to diffuse some of the public resistance to NE. There are arguments that these countries have enough fuel oil and natural gas re- serve to satisfy its present needs. Also, there are fears of  M. DARWISH, R. MOHTAR 125 large catastrophic accidents like what happened in Cher- nobyl, Ukraine, and the Three Mile Island in USA. Moreover, there are standing problems of nuclear waste disposal, nuclear plants de-commissioning, possible ra- dioactive contaminations, excessive capital and operating costs, lack of nuclear fuel technology and trained per- sonnel in developing countries. It also imposes depend- ency on the foreign country supplying the NPP to re-fuel the reactor for entire life of the plant. The supplying country should also ha ve acce ss to the spent (use d) fuel to avoid its reprocessing for unlawful uses. It is necessary to have qualified manpower for safe operation and mainte- nance of the NPP. So, Kuwait’s personnel, for example, should acqui re trai ning i n t he count ry s uppl y ing t he plant, thus requiring additional time and cost. This training is not limited to scientists but to all levels including engineers and technicians. These factors a pply to some GCC like SA, UAE, and Egypt, [43]. 7. Activities towards Sustainable Energy in the GCC Countries The activities of using solar or wind energy are very lim- ited to some scattered research work. The output of this work is very hard to find its application on a large scale to curb the increasingly consumed oil and NG. Although Qatar was the first country in the GCC to form Ministry of Environment, the awareness of environmental issues is low. SA is the most needed country to diversify its fuel; as it is facing shortage in NG needed to operate its PP, and its power demand is growing at an alarming rate, [44]. The increase of SA’s population and oil consump- tion lower the per capita income (mainly depends on oil export) since oil production is almost constant or de- creasing. The UAE is the first country in the GCC to deal the fuel energy problem surrounding the use of oil in EP generation; and tries effectively to reduce consumed fuel energy. All its power plants are operated by NG (part of it is imported). Public transportation metro and efficient bus systems are operating in Dubai and Abu Dhabi to reduce the transportation fuel consumption. The govern- ment subsidization of gasoline (for car) in the UAE is the least, compared to other GCC. For example, the 2008 car super gasoline price was $0.45/liter (l) in UAE; while it was 0.16/l in SA, $22/l in Qatar, $21/l in Bahrain, $24/l in Kuwait, and $31/l in Oman. The UAE diversifies its PP primary fuel by starting to build Nuclear (N) PP hav- ing four reactors of 1400 MW (electric) each. The activi- ties in renewable energy are clear in Masdar project. This project initiated in 2006 in Abu Dhabi, UAE. It is planned to build a city relying entirely on solar energy and other renewable energy sources, with a sustainable, zero-carbon, zero-waste ecology. It will cost US$22 bil- lion and take some eight years to build. Masdar will em- ploy a variety of renewable power resources. Among the first construction projects will be a 40 to 60 MW solar PP, built by the German firm to supply power for all con- struction activity. Also solar panels will be placed on rooftops to provide supplemental solar energy of 130 MW. Wind farms will be established outside Masdar’s, and capable of producing up to 20 MW. In this context, the number of discussions and research activities relating to the necessity of policies promoting more sustainable forms of energy is recently increasing. In [45,46] the solar and wind energy potentials are high- lighted in the GCC. The authors have also listed the ma- jor renewable energy (RE) projects (mainly solar and wind) in each of the six GCC and have proposed a mechanism to accelerate the RE utility in these countries. From a different perspective, particular reference has also been made in the international scientific literature for the social and political specificities of the region re- garding the ado ption of altern ative energy so urces; in [47] the authors have composed an analytical review of the current Renewable Energy Sources (RES) and Rational Use of Energy (RUE) development status in the GCC region, giving special emphasis to the business opportu- nities that the region offers for reg ional and international companies involved in this market. Patlitzianas et al. (2006), have identified and assessed sustainable energy investments in the framework of the EU-GCC coopera- tion. Indeed, the smooth cooperation of EU and GCC key energy players is considered important for the challeng- ing objective to engage GCC countries in a more sus- tainable development path [48-50]. 8. Conclusions The fuel mix changes relatively slowly, du e to long asset lifetimes, but gas and non-fossil fuels gain share at the expense of coal and oil. GCC should diversify fuel sources by introducing renewables and nuclear energy and investment in these resources. Energy demand man- agement initiatives, including curtailment of energy sub- sidies. The most preferred PP type using fossil fuel is the GTCC; which is the predominantly installed and applied in the GCC. The standard fuel used in the NG; and all GCC countries, except Qatar, have to import NG to run their PP. Although UAE and Kuwait started to import NG, the most needed country, SA, does not start yet. This may be for supply security reasons. Burning the too expensive crude oil in PP is equivalent to burning money. The per capita CO2 emission in GCC is the highest in the world, and 100% use of fossil fuel should stopped by using renewable energy. The UAE started to build NPP to take share in satisfying its EP needs. SA also has plans Copyright © 2013 SciRes. EPE  M. DARWISH, R. MOHTAR 126 to build NPP. The UAE started also to build two large concentrating solar plants (CSP). One plant has 100 MW capacity and using parabolic trough solar collectors. The second is solar tower having 10 MW electric capacity, [8]. A share of solar energy in EP generation should be adopted and fulfilled. The simple way is to augment the GTCC by solar energy (to become integrated solar com- bined cycle). The realization of electric power grid be- tween the GCC opens the door for better energy co-op- eration between the GCC. The availability of NG in Qatar can be used to build excess power capacity in Qatar to supply other needed GCC short of NG for EP when needed. EP was exported in last two years from Qatar to Kuwait. Conserving energy must be the highest priority for the GCC countries, which have the highest per capita of energy consumption worldwide. REFERENCES [1] Organization of Arab Petroleum Exporting Countries (OAPEC), “2010 Annual Statistical Report, in Arabic,” 2010, pp. 10-13. [2] US Energy Information Administration EIA, Qatar, 2012. http://www.eia.gov/countries/cab.cfm?fips=QA [3] “The MENA Region and Global Energy Risk,” MEES Research Special Report, 2010. http://geology.com/oil-and-gas/natural-gas-production-ma p/Jallah [4] J. Dargin, “Addressing the UAE Natural Gas Crisis: Str ate - gies for a Rational Energy Policy,” Harvard Belfer Center, Cambridge, 2010. [5] R. Kombargi, O. Waterlander, G. Sarraf and A. Sastry, “Gas Shortage in the GCC, How to Bridge t he Gap,” Booz & Company Analysis, pp. 3-6. http://www.booz.com/media/uploads/Gas_Shortage_in_th e_GCC.pdf [6] N. Williamson and M. M. Garcia, “Gas Shortages in the Middle East: an Unlikely Paradox, Gas Regulation 2011,” Global Legal Group, 2011. http://www.iclg.co.uk/index.php?area=4&show_chapter= 4139&ifocus=1&kh_publications_id=175 [7] P. R. Weems and F. Midani, “A Surprising Reality: Mid- dle East Natural Gas Crunch,” 2012. http://www.kslaw.com/Library/publication/MiddleEastNa turalGasCrunch.pdf [8] I. J. Bachellerie,” Renewable Energy in the GCC Coun- tries: Resources, Potential, and Prospects,” Gulf Research Center Publications, Dubai, 2012. [9] Oman, “Study on Renewable Energy Resources,” 2008. http://www.aer-oman.org/pdf/studyreport.pdf [10] G. Lahn and P. Stevens, “Burning Oil to Keep Cool: The Hidden Energy Crisis in Saudi Arabia,” Chatham House (The Royal Institute of International Affairs), London, 2011, pp. 2-3. [11] BP Energy Outlook 2030, 2011. [12] Saudi Arabia Energy Efficiency Report, 2012. http://www05.abb.com/global/scot/scot266.nsf/veritydispl ay/7795755e7e232f38c12579e60039434d/$file/saudi%20 arabia%20energy%20efficiency%20report.pdf [13] Economist Intelligent Unit, “T he GCC in 2020: Reso urce s for the Future,” 2010. [14] US Energy Information Administration EIA, “Analysis, Saudi Arabia.” http://www.eia.gov/countries/cab.cfm?fips=SA [15] “Saudi Arabia, Energy Efficiency Report.” http://www05.abb.com/global/scot/scot316.nsf/veritydispl ay/f90e53733342b472c125786400519e97/$file/saudi%20 arabia.pdf [16] Saudi Arabia Oil Consumption, United States Energy Information Administration. http://www.indexmundi.com/energy.aspx?country=sa&pr oduct=oil&graph=consumption [17] US Energy Information Administration EIA, “Analysis, United Arab Emirates.” http://www.eia.gov/countries/cab.cfm?fips=TC [18] “US Energy Analysis, Kuwait.” http://www.eia.gov/countries/cab.cfm?fips=KU [19] M. A. Darwish, F. M. Al-Awadhi and A. M. Darwish, “Energy and Water in Kuwait, Part I. A Sustainability View Point,” Desalination, Vol. 225, No. 1-3, 2008, pp. 341-355. doi:10.1016/j.desal.2007.06.018 [20] US Energy Information Administration EIA, “Analysis, Bahrain.” http://www.eia.gov/countries/cab.cfm?fips=BA [21] US Energy Information Administration EIA, “Analysis, Qatar.” http://www.eia.gov/countries/country-data.cfm?fips=QA [22] Qatar Gene ral Elec trici ty and Water Corp, “(KAHRA MA A) Statistical Yearbooks,” 2010. [23] Oman, “Energy Report, Economist Intelligent Unit.” http://www.eiu.com/index.asp?layout=ib3Article&article _id=357910420&pubtypeid=1142462499&country_id=4 30000043&page_title= [24] S. Hertog and G. Luciani, “Energy and Sustainability Policies in the GCC,” Kuwait Programme on Develop- ment, Governance and Globalisation in the Gulf States. [25] “Carbon Dioxide Emissions [tonnes] per Capita,” 2012. http://en.wikipedia.org/wiki/List_of_countries_by_carbon _dioxide_emissions_per_capita [26] Y. Alyousef and P. Stevens, “The Cost of Domestic En- ergyprices to Saudi Arabia,” Energy Policy, Vol. 39, No. 11, 2011, pp. 6900-6905. doi:10.1016/j.enpol.2011.08.025 [27] “World Energy Insight 2010,” Official Publication of the World Energy Council to Mark the 21st World Energy Congress. http:// www.w orlde nergy .o rg/doc ume nt s/wec _co mbine d. pdf [28] International Energy Outlook, DOE/EIA, 2011. [29] Emission Estimation Technique Manual for Combustion in Boilers, Version 1.2. [30] “National Pollutant Inv entory.” www.npi.gov.au [31] Petro Strategies, Inc., “US Na tural Gas and Residual Fuel Oil Price Comparison.” Copyright © 2013 SciRes. EPE  M. DARWISH, R. MOHTAR Copyright © 2013 SciRes. EPE 127 http://www.petrostrategies.org/Graphs/gas_and_residual_ fuel_comparison.htm [32] D. Bacher, “How Contributor, Price Comparison of Oil vs. Natural Gas.” http://www.ehow.com/about_6688369_price-oil-vs_-natu ral-gas.html [33] “The Economics of Nuclear Power.” http://www.world-nuclear.org/info/inf02.html [34] “Saudi Arabia Electricity and Co-Generation Regulatory Authority 2010 Report.” http://www.ecra.gov.sa/ [35] International Energy Statistics, US Energy Administration Information, Natural Gas Consumption. http://www.eia.gov/cfapps/ipdbproject/iedindex3.cfm?tid =3&pid=26&aid=2&cid=r5,&syid=1992&eyid=2010&un it=BCF [36] International Energy Statistics, US Energy Administra- tion Information Natural Gas Production. http://www.eia.gov/cfapps/ipdbproject/iedindex3.cfm?tid =3&pid=26&aid=1&cid=regions&syid=1992&eyid=2010 &unit=BCF [37] US EIA, Qatar, 2012. http://www.eia.gov/countries/cab.cfm?fips=QA [38] US Energy Information Administration (EIA), “Countries, Kuwait.” http://www.eia.gov/countries/cab.cfm?fips=KU [39] US EIA, “Saudi Arabia Analysis.” http://www.eia.gov/countries/cab.cfm?fips=SA [40] US Energy Information Administration EIA, “Analysis, Oman.” http://www.eia.gov/countries/cab2.cfm?fips=MU [41] G. Luciani, “Nuclear Energy Developments in the Medi- terranean and the Gulf,” The International Spectator, Vol. 44, No. 1, 2009, pp. 113-129. doi:10.1080/03932720802692947 [42] H. L. Al Farra and B. Abu-Hijleh, “The Potential Role of Nuclear Energy in Mitigating CO2 Emissions in t he U ni t ed Arab Emirates,” Energy Policy, Vol. 42, No. C, 2011, pp. 272-285. [43] M. A. Darwish, F. M. Al-Awadhi, A. Akbar and A. Dar- wish, “Alternative Primary Energy for Power Desalting Plants in Kuwait: The Nuclear Option I,” Desalination and Water Treatment, Vol. 1, No. 1-3, 2009, p. 25. doi:10.5004/dwt.2009.133 [44] http://www.bloomberg.com/news/2011-04-03/solar-nucle ar-energy-to-reduce-saudi-oil-demand-official-says.html [45] W. E. Alnaser and N. W. Alnaser, “The Status of Renew- able Energy in the GCC Countries,” Renewable and Sus- tainable Energy Reviews, Vol. 15, No. 6, 2011, pp. 3074- 3098. doi:10.1016/j.rser.2011.03.021 [46] W. E. Alnaser and N. W. Alnaser, “Solar and Wind En- ergy Potential in GCC Countries and Some Related Pro- jects,” Journal of Renewable and Sustainable Energy, Vol. 1, No. 2, 2009, pp. 1-28. doi:10.1063/1.3076058 [47] H. Doukas, K. D. Patlizianas, A. G. Kagiannas and J. Psarras, “Renewable Energy Sources and Rational of the Energy Development in the Countries of GCC: Myth or reality,” Renewable Energy, Vol. 31, No. 6, 2006, pp. 755-770. doi:10.1016/j.renene.2005.05.010 [48] K. D. Patlitzianas, H. Doukas and J. Psarras, “Enhancing Renewable Energy in the Arab States of the Gulf: Con- straints & Efforts,” Energy Policy, Vol. 34, No. 18, 2006, pp. 3719-3726. doi:10.1016/j.enpol.2005.08.018 [49] H. Doukas, I. Makarouni, C. Karakosta, V. Marinakis and J. Psarras, “EU-GCC Clean Energy Cooperation: From Concept to Action,” In: M. Tortora, Ed., Sustainable Sys- tems and Energy Management at the Regional Level: Com- parative Approaches, University of Florence, Kent State University, Florence Program Abroad, 2012, pp. 288-308. [50] A. Flamos, K. Ergazakis, D. Moissis, H. Doukas and J. Psarras, “The Challenge of a EU-GCC Clean Energy Net- work,” International Jo urnal of Glob al Ene rgy Issue s, Vo l. 33, No. 3-4, 2010, pp. 176-188. doi:10.1504/IJGEI.2010.036955  M. DARWISH, R. MOHTAR 128 Nomenclature Bbl Barrels BCF Billion cub ic feet Bm3 Billion cubic meters BMC Billion cubic meters Ca Capita (person) CPDP Cogeneration power desalting plants D Day DW Desalted seawater Ebbl Equivalent barrel EIA Energy information admi nistration, from the US government EP Electric power FF Fossil fuel GCC Gulf co-operation council countries GDP Gross domestic product GHG Greenhouse gases GT Gas turbine GTCC Gas turbine/steam turbine combined cycle GWh Giga Watt hour = 1000 MWh = 106 kWh H Hours kW Kilo Watt = 1000 kJ/s kWh Kilo-Watt hour, 3600 kJ LNG Liquefied natural gas M Minute, or meter MAAGP Mina Al-Ahmad i Gas Port MIG Million imperial gallons, 4546 m3 MIGD Million imperial gallons per day, 4546 m3/d, or 52.62 kg/s MW Mega Watts = 1000 kW NG Natural gas OA P E C Organization of Arab petroleum exporting co u n- tries PP Power plant SA Saudi Arabia TCF Trillion cubic feet UAE United Arab emirates Y Year Copyright © 2013 SciRes. EPE
|