 Advances in Bioscience and Biotechnology, 2013, 4, 118-125 ABB http://dx.doi.org/10.4236/abb.2013.41A017 Published Online January 2013 (http://www.scirp.org/journal/abb/) Reducing hospital inpatient complications: A four-year experience Ronald Lagoe1*, Joseph Bick2 1Hospital Executive Council, Syracuse, USA 2Associate for Clinical Intelligence, St. Joseph’s Hospital Health Center, Syracuse, USA Email: *hospexcl@cnymail.com Received 8 November 2012; revised 14 December 2012; accepted 20 January 2013 ABSTRACT This study described the use of administrative data and a computer software algorithm, Potentially Pre- ventable Complications, to support reduction of inpa- tient hospital complications. The study was carried out between 2008 and 2012 in St. Joseph’s Hospital Health Center in Syracuse, New York. The hospital generates approximately 23,000 inpatient discharges annually. The study employed summary tables for individual inpatient complications and patient spe- cific spreadsheets to evaluate and follow adverse out- comes. The spreadsheets were employed by hospital staff to determine whether patient medical records confirm each complication identified by the software. This process resulted in improvement of the accuracy of administrative data describing inpatient complica- tions. The administrative data and the software were also used in conjunction with medical records to identify patients who received program interventions and still experienced inpatient complications. This process enabled hospital staff to ensure that interven- tions were being provided and evaluate their effec- tiveness. The study demonstrated that, at the aggre- gate level, the inpatient complication rate per 1000 discharges declined by 33.4 percent, from 56.11 to 37.37 between 2008 and 2011. The principal drivers of this decline were high volume complications such as pneumonia, where the rate declined by 45.7 per- cent and urinary tract infection where the rate de- clined by 23.7 percent. The project provided a means of communicating and managing outcomes data that could be implemented and understood by a wide range of health care providers. Keywords: Hospital Outcomes; Hospital Complications; Quality of Care 1. INTRODUCTION In recent years, increased attention has developed con- cerning improvement of hospital and health care outcomes in the United S tates. Th is d eve lo p ment has re su lted fro m a combination of factors related to inpatient complications, hospital readmissions, and other indicat ors. A major cause of this development has been research that demonstrates the relationship between adverse health care outcomes and higher costs to providers and payers. Studies have demonstrated that patients with inpatient complications such as pneumonia, urinary tract infection, and clostridium difficile colitis have much longer hos- pital stays and related labor and pharmaceutical costs than those who do not [1-3]. Related to these costs is a new urgency to reduce health care expenses in society. In the United States, all major health care payers, including Medicare, Medicaid, and private insurance, are under a large amount of pres- sure to reduce spending. This situation strongly suggests that current increases in these expenditure can no longer be sustained [4,5]. The potential to control these costs through financial penalties for adverse outcomes holds the potential to reduce health care spending while im- provin g patient care [6] . In addition to these factors, efforts to improve health care outcomes are benefiting from the development of electronic software for analysis of patient specific data. Tools such as the Potentially Preventable Complications system developed by 3M Health Information Systems can analyze large amounts of administrative data at the aggregate and patient specific levels. The information produced by these tools can guide clinical management initiatives [7,8]. This study described the use of administrative data and one of these algorithms to support reduction of inpatient complications in a large urb an hospital in Syracuse, New York during a four year period. It demonstrated the use of this software to identify and address adverse outcomes at the aggregate and specific levels. *Corresponding a uthor. OPEN ACCESS  R. Lagoe, J. Bick / Advances in Bioscience and Biotechnology 4 (2013) 118-125 119 2. POPULATION AND METHODS This study involved the use of administrative data to identify and manage inpatient complications in St. Jo- seph’s Hospital Health Center, in Syracuse, New York during a four year period. This hospital has the largest inpatient volume (23,832 inpatient discharges excluding well newborns in 2011) of the acute care facilities in Syracuse. Other hospitals in Syracuse that participated in the program included Crouse Hospital (20,540 dis- charges) and Upstate University Hospital at Community General (6959 discharges) (Hospital Executive Council, Unpublished data, 20 12). The program involved the staffs of St. Joseph’s Hos- pital Health Center and the Hospital Executive Council, the cooperative planning organization for the Syracuse Hospitals. Historically, the Syracuse Hospitals have worked through the Council to improve health care effi- ciency and outcomes in Central New York [9]. 3. DATA DEVELOPMENT The study was developed as part of a demonstration pro- gram including the Hospital Executive Council, St. Jo- seph’s Hospital Health Center, and 3M Health Informa- tion Systems. This program involved the use of the 3M Potentially Preventable Complications software and hos- pital administrative da ta to identify and manage inpatien t complications. The Potentially Preventable Complications software includes extensive log ic for identifying inpatient hospital complications in administrative data. At the summary level, it identifies complications at the patient specific level based on specific secondary diagnoses. These di- agnoses, which are identified by the reporting indicator as Not Present on Admission, are assumed to be candi- dates for inpatient complications. The software then screens these diagnoses with specific exclusion criteria such as logical sequelae of principal diagnoses and ser- vices such as trauma and neonatal care for which inpa- tient complications have not been clearly identified. In the demonstration program with 3M Health Infor- mation Systems, the Hospital Executive Council gener- ated Potentially Preventable Complications data for St. Joseph’s Hospital Health Center each month beginning in 2009. These data included patient specific spread- sheets and summary tables for PPCs that were the subject of clinical interventions at the Hospital. In response to this information, the Hospital staff identified whether patient records confirmed that each patient experienced the complication(s) identified by the software and whether they received the clinical interve- netions designed to avoid these adverse outcomes. This information was used to monitor development of the program by the Hospital Executive Council and for in- ternal follow up by the hospital. 4. HOSPITAL INTERVENTIONS The charts of patients that were identified as having a particular potentially preventable complication were re- viewed in detail to identify commonalities. The first in- tervention was to determine whether the documenttation supported the diagnosis that resulted in the PPC. Coding errors had to be eliminated before clinical interventions could be put in place. This gave the hospital a more ac- curate picture of the scope of the problem. This was ac- complished by reviewing each clinical record and by comparing them to coding summaries and coding defini- tions [10]. The charts fell into two distinct categories: The first were records where the documentation did not support the coding. The other category included charts where the clinical information did not support the diagnosis. By educating coders about errors and common mistakes, coding errors were systematically eliminated. By edu- cating providers about how diagnosis of pneumonia and urinary tract infections were coded, their documentation regarding these complications became clearer. With administrative “slack” taken out of the system the true clinical situations could be identified and miti- gated. Over 100 chart reviews were conducted to define what specific outcome issues there was at the hospital. The staff wanted to be as specific as possible for the pa- tient populations so that they could effectively deploy resources to reduce the complications of interest. The hospital focused on four complications: Pneumonia, Uri- nary Tract Infection, Clostridium Difficile Colitis, and Decubitus Ulcers. 5. PNEUMONIA Charts were examined to identify if patients were re- ceiving the basic care documented in the literature to prevent hospital acquired pneumonia [11]. Specifically, nursing charting was reviewed to determine if the pa- tients with the complication received mouth care, had the use of incentive spirometry documented, were out of bed ambulating, and if they had the head of their bed elevated [12,13]. It was clear from chart reviews that incentive spirometry and mouth care were opportunities to im- prove care. Units and services with the highest numbers of cases were selected for education regarding incentive spirometry use and documentation. Daily rounding was instituted to ensure that nurses were reminding patients to use their incentive spirometers and that they docu- mented its use. 6. URINARY TRACT INFECTION The data from each source were imported into a Micro- Copyright © 2013 SciRes. OPEN ACCESS  R. Lagoe, J. Bick / Advances in Bioscience and Biotechnology 4 (2013) 118-125 120 soft Access database and compared using medical record number, account number and admission date. Records for review were then sorted by comparing them with valid culture results to arrive at the study group. Chart reviews were conducted to determine what care was documented. These reviews included the collection of the infection indicators of white blood cell count and temperature associated with culture collection. The re- views determined for each case if there was a urinary catheter placed during the patients admission, how many days it was in place, and the number of times care was charted in association with it. For those infections where a urinary catheter was in place, the number of catheter days was compared with the number of times catheter care was charted to approximate a rate of care episodes per catheter day. The key intervention in reducing hospital acquired urinary tract infection was to reduce the overall usag e of urinary catheters. To do this, the problem was addressed by a number of approaches. First, using the CDC’s guidelines for reducing catheter associated urinary tract infections, standard indications for catheter insertion were implemented [14]. Three interventions were effec- tive in reducing the number of catheter days per patient (the in process measure). Firstly, an RN driven foley removal protocol for inpatients was instituted. Essen- tially, if the indications no longer existed, the catheter was removed automatically by the nurse. Secondly, for surgical patients, an education program for physician assistants, residents and nurse practitioners about the correct indications for indwelling catheters was instituted. Finally, it was determined that the majority of urinary catheters were inserted in the emergency department. As a result, an education program for the both the nurse and providers in the emergency department about the indica- tions, and effects of indwelling catheters for patients during the entire hospitalization was carried out. All of these interventions resulted in approximately a 20 per- cent reduction of catheter days per patients and a pre- cipitous decline in hospital acquired urinary tract infec- tions. 7. CLOSTRIDIUM DIFFICILE COLITIS Cases identified by the 3M Poten tially Preventable Com- plication (PPC) software were compared with those re- ported to the National Health Safety Network (NHSN) at the Centers for Disease Control and Prevention (CDC) [15-17]. They were also cross referenced with clostrid- ium difficile colitis cases identified by Care fusion/Med mined Virtual Surveillance Indicators. After cases were identified and cross referenced, a total of 124 unique records identified as hospital onset were reviewed in detail using data found in the clinical documentation system, the orders system and the pharmacy system. Fi- nally, patient room assignments were reviewed. The initial review was carried out using the pharmacy system, Horizon Meds Management (HMM). The re- viewer reviewed notations made by pharmacist regarding antibiotic prescribing and indications. This documenta- tion is not part of the patient’s clinical record. The re- viewer attempted to identify the patient’s original infec- tion and the antibiotics used to treat it. When this was not documented in HMM, the clinical record was reviewed. The findings of infection requiring antibiotic treatment are listed in Table 1. Next the antibiotics used to treat these infections were review and counted. Vancomycin and Flagyl were ex- cluded from this count. The results are listed in Table 2. It is worthwhile to know that 84 percent of patients received at least one of the antibiotics listed in Table 2 and 45 percent of patients received at least two. These findings are consistent with the findings noted by Pepin et al. in their study “Emergence of Fluotoquinolones as the predominant risk factor for Clostridium Difficile- Associated Diarrhea: A cohort study during an epidemic in Quebec” [18]. 8. DECUBITUS ULCERS It was clear from an extensive review of patient records and careful comparisons of other data sets that a previ- ously identified quality improvement opportunity in the care of the decubitus ulcer PPC was far more theoretical Table 1. St. Joseph’s Hospital Health Center, infections treated with antibiotics in patients with C. Diff. Infection Count Pneumonia or rule out pneumonia 42 Urinary tract infections or urosep sis 22 Other infections including sepsis, preop, prophylaxis, cellulitis, and wound infections 60 Table 2. St. Joseph’s Hospital Health Center, antibiotics com- monly prescribed to patients who later developed C. Diff infec- tions. Antibiotic Number of C. Diff cases presecribed Zosyn 47 Ciprofloxacin 46 Cephalosporins 34 Ampicillin/Amoxicillin10 Moxifloxacin 8 Clindamycin 4 Zyvox 3 Azactam 2 Copyright © 2013 SciRes. OPEN ACCESS  R. Lagoe, J. Bick / Advances in Bioscience and Biotechnology 4 (2013) 118-125 121 than practical. Coding errors, careful nursing documenta- tion, poor initial patien t condition and co -morbidities and additional PPCs have conspired to negate any real finan- cial gain to be had from further improvements to decu- bitus care alone. 9. DATA ANALYSIS Analysis of the data involved the impact of interven tions for individual inpatient complications, as well as the de- velopment of summary tables including numbers of complications, at risk populations, and rates per 1000 discharges for St. Joseph’s Hospital Health Center. In order to define the full and most recent impacts of the program, one analysis included data for January-Decem- ber 2008-2011, while the other included data for January- March 2008-2012. In both analyses, data for individual and aggregate complications were identified. 10. RESULTS The first component of the results involved the individ- ual complications addressed by the project. Data con- cerning all individual complications are summarized in Tables 3 and 4 which follow. With respect to pneumonia, increased incentive spiro- metry use and documentation resulted in the direct re- duction of hospital acquired pneumonia. Changes in com- plication rates for pneumonia are identified in Tables 3 and 4 which follow. With respect to urinary tract infection, the association between urinary catheters and urinary tract infections was examined. The review looked at all of these infec- tions, as well as their relationship to indwelling urinary catheters. It found that 78% (n-76) of St. Joseph’s hospi- tal acquired urinary tract infections were in patients who had been catheterized during their admission. On average, a patient who developed a urinary tract infection had an indwelling catheter for 12 days. St. Joseph’s standard for catheter care is that it be performed and documented once daily. The rev iew found that only 25 percent (n-19) of patients with positive urine cultures received this care correctly. In 34 percent of the cases the patient received less than what was required (n-23) and curiously, 45 percent (n-34) of the patients received too much care, that is to say they had more episodes of care then rec- ommended. Changes in complication rates for urinary tract infection are identified in Tables 3 and 4 which follow. With respect to clostridium difficile colitis, another factor examined was the timeliness of isolation precau- tions associated with the onset of symptoms. To deter- mine this all of the nursing orders for “en teric” and “con- tact precautions C. difficile” were compared with orders for “Stool for C. difficile”. The basic presumption of this comparison was that for a “Stool for C. difficile” to be ordered there was reason to believe that the patient is in some way symptomatic of the disease. As such, if there was a reasonable expectation that a patient is symptom- matic, they were placed isolation in accordance with the hospitals isolation manual and the CDC’s current best practice guidelines. The examination included all inpa- tients who were placed on isolation and all of those who had an order for stool for C. diff. This produced 607 unique order combinations for inpatients that were ad- mitted for at least 48 hours. On average, patients who were placed on isolation in greater than one hour waited five hours for the is ol at ion order to be entered. Finally, an examination of positive clostridium diffi- cile colitis results was made, irrespective of the onset to determine if any other environmental factors could be identified. This review specifically looked at the rooms patients with positive results stayed in. It found that 15 patient rooms (7 percent of rooms) accounted for 54 (20 percent) of positive results. This was significant in that environmental contamination with C. Diff spores is a major contributing factor in developing the disease in pa- tients with other risk factors. Changes in complication rates for clostridium difficile colitis are identified in Ta- bles 3 and 4 which follow. With respect to decubitus ulcers, prolonged length of stay seemed to contribute to the development of the complication. In other words, the ulcer resulted from the extended stay, rather than the long stay resulting from the ulcer. Changes in complication rates for decubitus ulcer are identified in Tables 3 and 4 which follow. The second component of the results involved Poten- tially Preventable Complications at the aggregate and diagnosis specific levels for January-December 200 8- 20 1 1. Relevant data are summarized in Table 3. This information demonstrates that, at the aggregate level, the PPC rate per 1000 discharges at the hospital declined by 33.4 percent, from 56.11 to 37.37 during this period. This occurred as the number of PPCs declined by 13.4 percent from 1035 to 896, while the at risk popula- tion increased by 30.0 percent, from 18,446 to 23,975. It was notable that the hospital was able to reduce compli- cations at a time when its inpatient population was in- creasing substantially. At the PPC specific level, the principal drivers of the decline were high volume diagnoses that were addressed by specific interventions. For pneumonia (PPC 04) the rate declined by 45.7 percent from 14.07 to 7.64 per 1000 discharges between 2008 and 2011. Most of this reduction occurred between 2009 and 2011. For urinary tract infection (PPC 16), the rate declined by 23.7 per- cent from 8.37 to 6.39 between 2008 and 2011. As a re- sult of an increase between 2008 and 2009, all of the eline occurred during the last three years. d c Copyright © 2013 SciRes. OPEN ACCESS 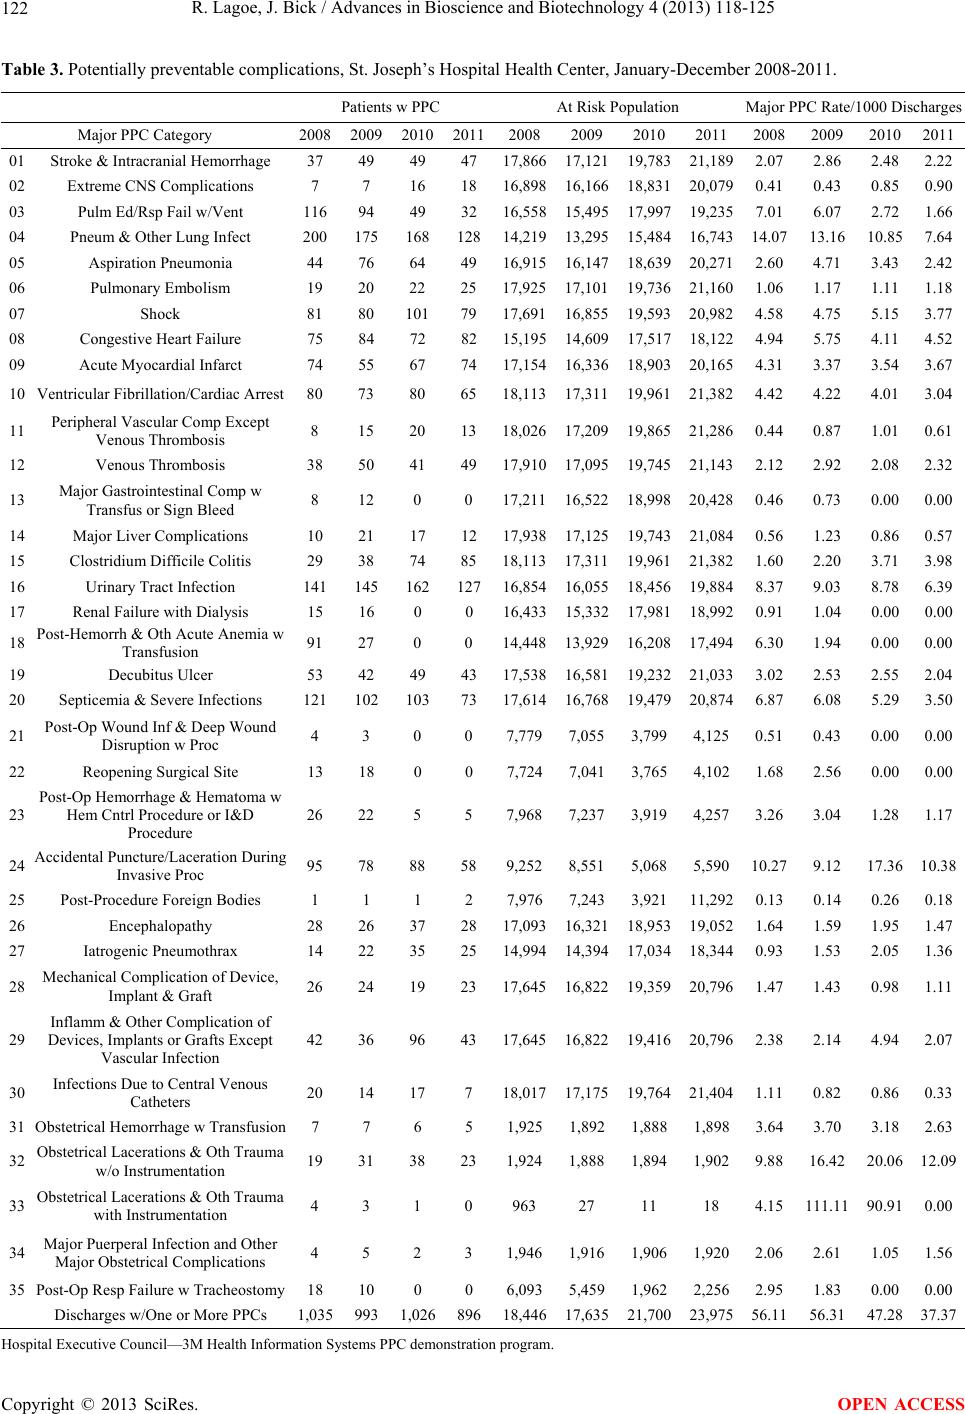 R. Lagoe, J. Bick / Advances in Bioscience and Biotechnology 4 (2013) 118-125 Copyright © 2013 SciRes. 122 OPEN ACCESS Table 3. Potentially preventable complications, St. Joseph’s Hospital Health Center, January-December 2008-2011. Patients w PPC At Risk Population Major PPC Rate/1000 Discharges Major PPC Category 2008 20092010201120082009201020112008 2009 20102011 01 Stroke & Intracranial Hemorrhage 37 49 49 47 17,86617,12119,78321,189 2.07 2.86 2.482.22 02 Extreme CNS Complications 7 7 16 18 16,89816,16618,83120,079 0.41 0.43 0.850.90 03 Pulm Ed/Rsp Fail w/Vent 116 94 49 32 16,55815,49517,99719,235 7.01 6.07 2.721.66 04 Pneum & Other Lung Infect 200 175 16812814,21913,29515,48416,743 14.07 13.16 10.857.64 05 Aspiration Pneumonia 44 76 64 49 16,91516,14718,63920,271 2.60 4.71 3.432.42 06 Pulmonary Embolism 19 20 22 25 17,92517,10119,73621,160 1.06 1.17 1.111.18 07 Shock 81 80 10179 17,69116,85519,59320,982 4.58 4.75 5.153.77 08 Congestive Heart Failure 75 84 72 82 15,19514,60917,51718,122 4.94 5.75 4.114.52 09 Acute Myocardial Infarct 74 55 67 74 17,15416,33618,90320,165 4.31 3.37 3.543.67 10 Ventricular Fibrillation/Cardiac Arrest 80 73 80 65 18,11317,31119,96121,382 4.42 4.22 4.013.04 11 Peripheral Vascular Comp Except Venous Thrombosis 8 15 20 13 18,02617,20919,86521,286 0.44 0.87 1.010.61 12 Venous Thrombosis 38 50 41 49 17,91017,09519,74521,143 2.12 2.92 2.082.32 13 Major Gastrointestinal Comp w Transfus or Sign Bleed 8 12 0 0 17,21116,52218,99820,428 0.46 0.73 0.000.00 14 Major Liver Complications 10 21 17 12 17,93817,12519,74321,084 0.56 1.23 0.860.57 15 Clostridium Difficile Colitis 29 38 74 85 18,11317,31119,96121,382 1.60 2.20 3.71 3.98 16 Urinary Tract Infe ctio n 141 145 16212716,85416,05518,45619,884 8.37 9 .03 8.786.39 17 Renal Failure with Dialysis 15 16 0 0 16,43315,33217,98118,992 0.91 1.04 0.000.00 18 Post-Hemorrh & Oth Acute Anemia w Transfusion 91 27 0 0 14,44813,92916,20817,494 6.30 1.94 0.000.00 19 Decubitus Ulcer 53 42 49 43 17,53816,58119,23221,033 3.02 2.53 2.552.04 20 Septicemia & Severe Infections 121 102 10373 17,61416,76819,47920,874 6.87 6.08 5.293.50 21 Post-Op Wound Inf & Deep Wound Disruption w Proc 4 3 0 0 7,7797,0553,7994,125 0.51 0.43 0.000.00 22 Reopening Surgical S ite 13 18 0 0 7,7247,0413,7654,102 1.68 2.56 0.000.00 23 Post-Op Hemorrhage & Hematoma w Hem Cntrl Procedure or I&D Procedure 26 22 5 5 7,9687,2373,9194,257 3.26 3.04 1.281.17 24 Accidental Puncture/Laceration During Invasive Proc 95 78 88 58 9,2528,5515,0685,590 10.27 9.12 17.3610.38 25 Post-Procedure Foreign Bodies 1 1 1 2 7,9767,2433,92111,292 0.13 0.14 0.260.18 26 Encephalopathy 28 26 37 28 17,09316,32118,95319,052 1.64 1.59 1.951.47 27 Iatrogenic Pneumothrax 14 22 35 25 14,99414,39417,03418,344 0.93 1.53 2.051.36 28 Mechanical Com plication of Device, Implant & Graft 26 24 19 23 17,64516,82219,35920,796 1.47 1.43 0.981.11 29 Inflamm & Other Complication of Devices, Implants or Grafts Except Vascular Infection 42 36 96 43 17,64516,82219,41620,796 2.38 2.14 4.942.07 30 Infections Due to Central Venous Catheters 20 14 17 7 18,01717,17519,76421,404 1.11 0.82 0.860.33 31 Obstetrical Hemorrhage w Tr an sf us ion 7 7 6 5 1,9251,8921,8881,898 3.64 3.70 3.182.63 32 Obstetrical Lacerations & Oth Trauma w/o Instrumentation 19 31 38 23 1,9241,8881,8941,902 9.88 16.42 20.0612.09 33 Obstetrical Lacerations & Oth Trauma with Instrumentation 4 3 1 0 963 27 11 18 4.15 111.11 90.910.00 34 Major Puerperal Infection and Other Major Obstetrical Complications 4 5 2 3 1,9461,9161,9061,920 2.06 2.61 1.051.56 35 Post-Op Resp Failure w Trache os to my 18 10 0 0 6,0935,4591,9622,256 2.95 1.83 0.000.00 Discharges w/One or More PPCs 1,035 993 1,02689618,44617,63521,70023,975 56.11 56.31 47.2837.37 Hospital Executive Council—3M Health Informati on S ystems PP C demonstration program. 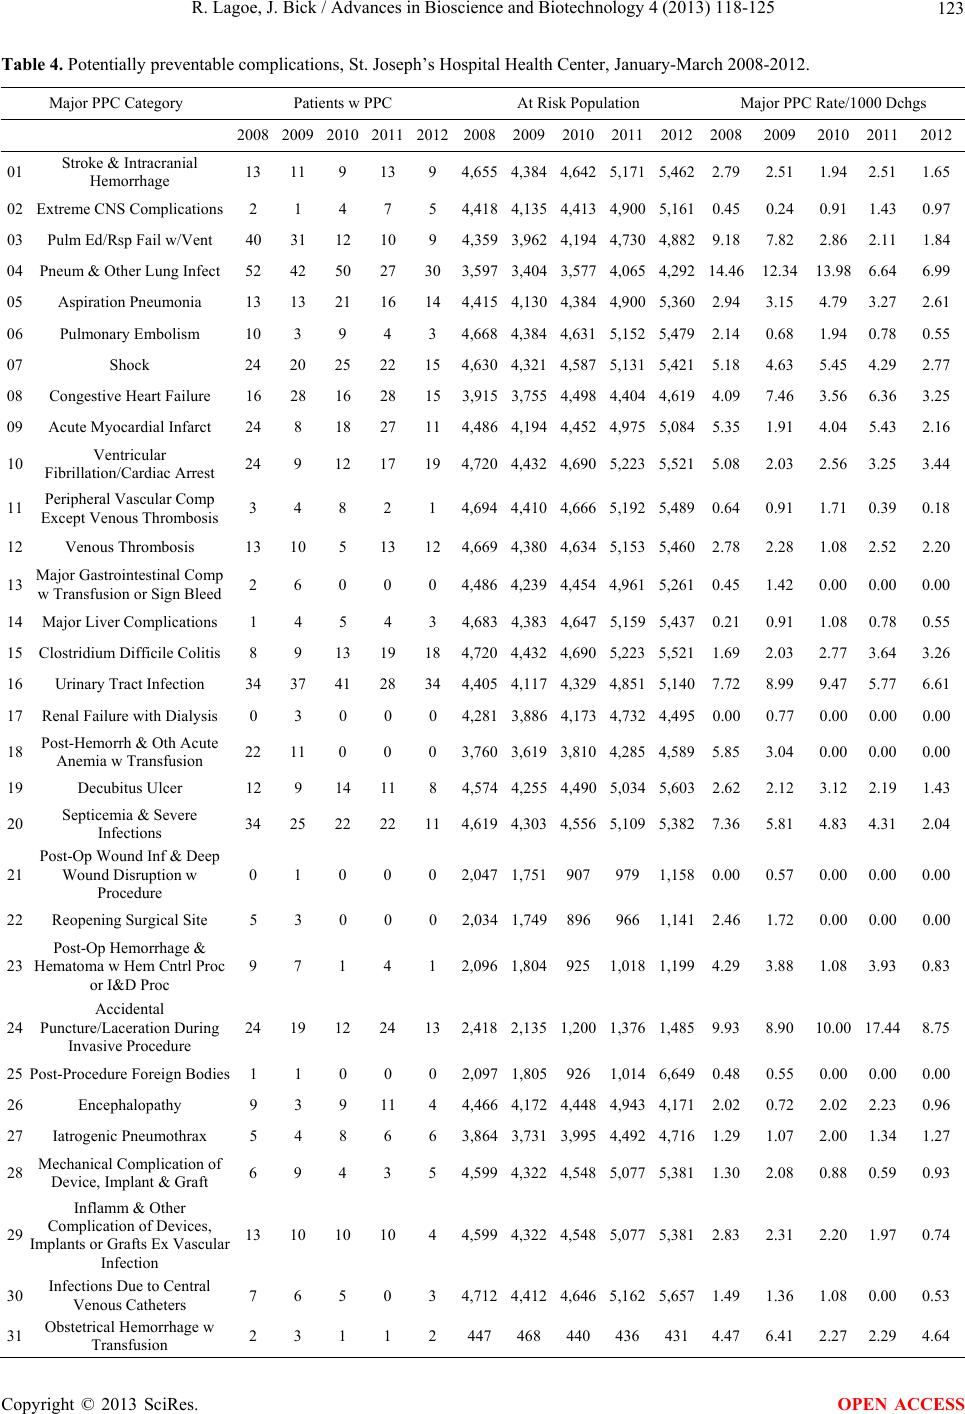 R. Lagoe, J. Bick / Advances in Bioscience and Biotechnology 4 (2013) 118-125 123 Table 4. Potentially preventable complications, St. Joseph’s Hospital Health Center, January-March 2008-2012. Major PPC Category Patients w PPC At Risk Population Major PPC Rate/1000 Dchgs 2008 2009 2010 20112012200820092010201120122008 2009 2010 20112012 01 Stroke & Intracranial Hemorrhage 13 11 9 139 4,6554,3844,6425,1715,4622.79 2.51 1.94 2.511.65 02 Extreme CNS Complications 2 1 4 7 5 4,4184, 13 54,4134,9005,1610.45 0. 24 0.91 1.430.97 03 Pulm Ed/Rsp Fail w/Vent 40 31 12 109 4,3593,9624,1944,7304, 8829.18 7.82 2.86 2.111.84 04 Pneum & Other Lung Infect 52 42 50 27303,5973,4043,5774,0654,29214.46 1 2.34 13.98 6.646.99 05 Aspiration Pneumonia 13 13 21 16144,4154,1304,3844,9005,3602.94 3.15 4.79 3.272.61 06 Pulmonary Embolism 10 3 9 4 3 4,6684,3844,6315,1525,4792.14 0.68 1.94 0.780.55 07 Shock 24 20 25 22154,6304,3214,5875,1315,4215.18 4.63 5.45 4.292.77 08 Congestive Heart Failure 16 28 16 28153,9153,7554,4984,4044,6194.09 7.46 3.56 6.363.25 09 Acute Myocardial Infarct 24 8 18 27 114,4864,1944,4524,9755,0845.35 1.91 4.04 5.43 2.16 10 Ventricular Fibrillation/Cardiac Arrest 24 9 12 17194,7204,4324,6905,2235,5215.08 2.03 2.56 3.253.44 11 Peripheral Vascular Comp Except Venous Thrombosis 3 4 8 2 1 4,6944,4104,6665,1925,4890.64 0.91 1.71 0.390.18 12 Venous Thrombosis 13 10 5 13124,6694,3804,6345,1535,4602.78 2.28 1.08 2.522.20 13 Major Gastrointestinal Comp w Transfusion or Sign Bleed 2 6 0 0 0 4,4864,2394,4544,9615,2610.45 1.42 0.00 0.000.00 14 Major Liver Complications 1 4 5 4 3 4,6834,3834,6475,1595,4370.21 0.91 1.08 0.780.55 15 Clostridium Difficile Colitis 8 9 13 19184,720 4,432 4,690 5,2235,5211.69 2.03 2.77 3.643.26 16 Urinary Tract Infection 34 37 41 28344,4054,1174,3294,8515,1407.72 8.99 9.47 5.776.61 17 Renal Failure with Dialysis 0 3 0 0 0 4,2813,8864,1734,7324,4950.00 0.77 0.00 0.000.00 18 Post-Hemorrh & Oth Acute Anemia w Transfusion 22 11 0 0 0 3,7603,6193,8104,2854,5895.85 3.04 0.00 0.000.00 19 Decubitus Ulcer 12 9 14 118 4,5744,2554,4905,0345,6032.62 2.12 3.12 2.191.43 20 Septicemia & Severe Infections 34 25 22 22114,6194,3034,5565,1095,3827.36 5.81 4.83 4.312.04 21 Post-Op Wound Inf & Deep Wound Disruption w Procedure 0 1 0 0 0 2,0471,7519079791,1580.00 0.57 0.00 0.000.00 22 Reopening Surgical Site 5 3 0 0 0 2,0341,7498969661,1412.46 1.72 0.00 0.000.00 23 Post-Op Hemorrhage & Hematoma w Hem Cntrl Proc or I&D Proc 9 7 1 4 1 2,0961,8049251,0181,1994.29 3.88 1.08 3.930.83 24 Accidental Puncture/Laceration During Invasive Procedure 24 19 12 24132,4182,1351,2001,3761,4859.93 8.90 10.00 17.448.75 25 Post-Procedure Foreign Bodies 1 1 0 0 0 2,0971,8059261,0146,6490.48 0.55 0.00 0.000.00 26 Encephalopathy 9 3 9 11 4 4,4664,1724,4484,9434,1712.02 0.72 2.02 2.230.96 27 Iatrogenic Pneumothrax 5 4 8 6 6 3,8643,7313,9954,4924,7161.29 1.07 2.00 1.341.27 28 Mechanical Complication of Device, Implant & Graft 6 9 4 3 5 4,5994,3224,5485,0775,3811.30 2.08 0.88 0.590.93 29 Inflamm & Other Complication of Devices, Implants or Grafts Ex Vascular Infection 13 10 10 104 4,5994,3224,5485,0775,3812.83 2.31 2.20 1.970.74 30 Infections Due to Central Venous Catheters 7 6 5 0 3 4,7124,4124,6465,1625,6571.49 1.36 1.08 0.000.53 31 Obstetrical Hemorrhage w Transfusion 2 3 1 1 2 4474684404364314.47 6.41 2.27 2.294.64 Copyright © 2013 SciRes. OPEN ACCESS 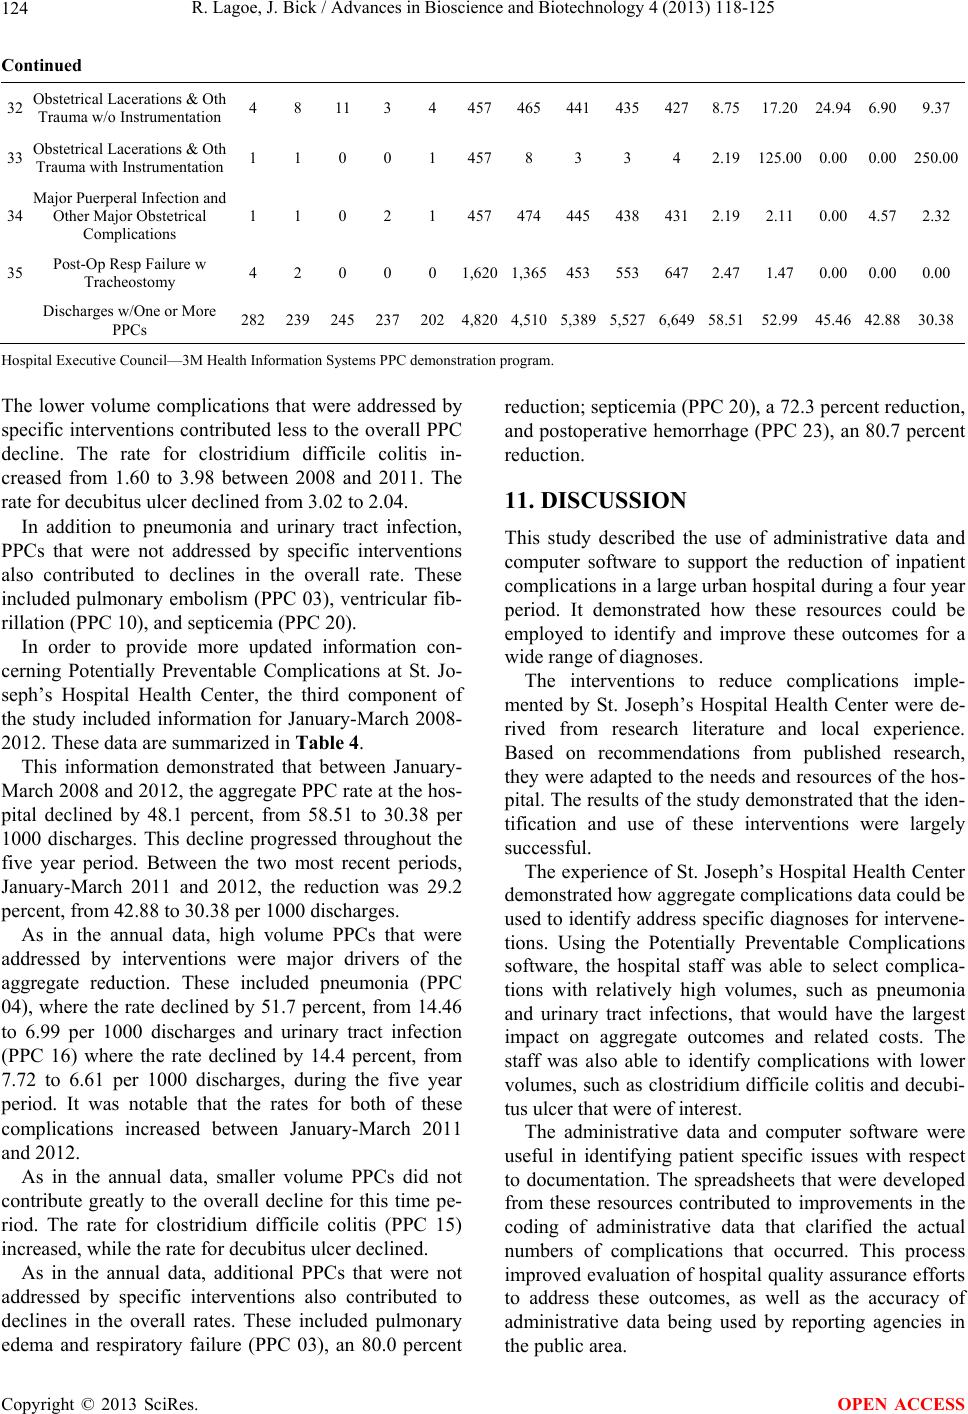 R. Lagoe, J. Bick / Advances in Bioscience and Biotechnology 4 (2013) 118-125 Copyright © 2013 SciRes. 124 OPEN ACCESS Continued 32 Obstetrical Lacerations & Oth Trauma w/o Instrumentation 4 8 11 3 4 4574654414354278.75 17.20 24.94 6.909.37 33 Obstetrical Lacerations & Oth Trauma with Instrumentation 1 1 0 0 1 4578 3 3 4 2.19 125.00 0.00 0.00250.00 34 Major Puerperal Infection and Other Major Obstetrical Complications 1 1 0 2 1 4574744454384312.19 2.11 0.00 4.572.32 35 Post-Op Resp Failure w Tracheostomy 4 2 0 0 0 1,6201,3654535536472.47 1.47 0.00 0.000.00 Discharges w/One or More PPCs 282 239 245 2372024,8204,5105,3895,5276,64958.51 52.99 45.46 42.8830.38 Hospital Executive Council—3M Health Informati on S ystems PP C demonstration program. The lower volume complications that were addressed by specific interventions contributed less to the o verall PPC decline. The rate for clostridium difficile colitis in- creased from 1.60 to 3.98 between 2008 and 2011. The rate for decubitus ulcer declined from 3.02 to 2.04. In addition to pneumonia and urinary tract infection, PPCs that were not addressed by specific interventions also contributed to declines in the overall rate. These included pulmonary embolism (PPC 03), ventricular fib- rillation (PPC 10), and septicemia (PPC 20). In order to provide more updated information con- cerning Potentially Preventable Complications at St. Jo- seph’s Hospital Health Center, the third component of the study included information for January-March 2008- 2012. These data are summarized in Table 4. This information demonstrated that between January- March 2008 and 2012, the aggregate PPC rate at the hos- pital declined by 48.1 percent, from 58.51 to 30.38 per 1000 discharges. This decline progressed throughout the five year period. Between the two most recent periods, January-March 2011 and 2012, the reduction was 29.2 percent, from 42.88 to 30.38 per 100 0 di scharges. As in the annual data, high volume PPCs that were addressed by interventions were major drivers of the aggregate reduction. These included pneumonia (PPC 04), where the rate declined by 51.7 percent, from 14.46 to 6.99 per 1000 discharges and urinary tract infection (PPC 16) where the rate declined by 14.4 percent, from 7.72 to 6.61 per 1000 discharges, during the five year period. It was notable that the rates for both of these complications increased between January-March 2011 and 2012. As in the annual data, smaller volume PPCs did not contribute greatly to the overall decline for this time pe- riod. The rate for clostridium difficile colitis (PPC 15) increased, while the rate for decubitus ulcer declined. As in the annual data, additional PPCs that were not addressed by specific interventions also contributed to declines in the overall rates. These included pulmonary edema and respiratory failure (PPC 03), an 80.0 percent reduction; septicemia (PPC 20), a 72.3 percent red uction , and postoperative hemorrhage (PPC 23), an 80.7 percent reduction. 11. DISCUSSION This study described the use of administrative data and computer software to support the reduction of inpatient complications in a large urban hospital d uring a four year period. It demonstrated how these resources could be employed to identify and improve these outcomes for a wide range of diagno s es. The interventions to reduce complications imple- mented by St. Joseph’s Hospital Health Center were de- rived from research literature and local experience. Based on recommendations from published research, they wer e adapted to the needs an d resources of th e hos- pital. The results of the study demonstrated that the id en- tification and use of these interventions were largely successful. The experience of St. Joseph’s Hospital Health Center demonstrated how aggregate complications data could be used to iden tify address specific diagnoses for interv ene- tions. Using the Potentially Preventable Complications software, the hospital staff was able to select complica- tions with relatively high volumes, such as pneumonia and urinary tract infections, that would have the largest impact on aggregate outcomes and related costs. The staff was also able to identify complications with lower volumes, such as clostridium difficile colitis and decubi- tus ulcer that were of interest. The administrative data and computer software were useful in identifying patient specific issues with respect to documentation. The spreadsheets that were developed from these resources contributed to improvements in the coding of administrative data that clarified the actual numbers of complications that occurred. This process improved evaluatio n of hospital quality assurance efforts to address these outcomes, as well as the accuracy of administrative data being used by reporting agencies in the public area.  R. Lagoe, J. Bick / Advances in Bioscience and Biotechnology 4 (2013) 118-125 125 The administrative data and computer software also made it possible to identify patients who received the program inventions, but also experienced the complica- tions. From this perspective, it provided information for evaluation of the impact of interventions over time on a patient specific basis. Through these applications, the staff of St. Joseph’s Hospital Health Center was able to use these resources at both the patient specific and aggregate levels to improve care and reduce related costs. The aggregate data pro- vided perspectives concerning this information across a wide range of individual complications and through total frequencies and rates. In summary, this approach to improving patient out- comes was simple and direct. It provided a means of communicating and managing outcomes data that could be understood and used by a wide variety of health care providers. REFERENCES [1] Fuller, R.L., McCullough, E.C., Bao, M.Z. and Averill, R.F. (2009) Estimating the costs of potentially prevent- able hospital acquired complications. Health Care Finan- cing Review, 30, 17-32. [2] Lagoe, R.J., Johnson, P.E. and Murphy, M.P. (2011) In- patient hospital complications and lengths of stay: A short report. BMC Research Notes, 4, 135. doi:10.1186/1756-0500-4-135 [3] Hoonhout, L.H., de Bruijne, M.C., Wagner, C., Zegers, M., Waaijman, R., Spreeuwenberg, P., Asscherman, H., van der Wal, G. and van Tulder, M.W. (2009) Direct me- dical costs of adverse events in Dutch hospitals. BMC Health Services Research, 9, 27. doi:10.1186/1472-6963-9-27 [4] Dentzer, S. (2011) Urgent measures for an old problem. Health Affairs, 30, 1626. doi:10.1377/hlthaff.2011.0961 [5] Marcus, A. (2009) Bending the curve: The twists and turns. Health Affairs, 28, 1256-1258. doi:10.1377/hlthaff.28.5.1256 [6] Skinner, J., Chandra, A., Goodman, D. and Fisher, E.S. (2009) The elusive connection between health care spen- ding and quality. Health Affairs, 28, w119-w123. doi:10.1377/hlthaff.28.1.w119 [7] Hughes, J.S., Averill, R.F. and Goldfield, N.J. (2006) Identifying potentially preventable complications using a present on admission indicator. Health Care Financing Review, 27, 63-82. [8] Lagoe, R.J. and Westert, G.P. (2010) Evaluation of hos- pital inpatient complications: A planning approach. BMC Health Services Research, 10, 200. doi:10.1186/1472-6963-10-200 [9] Lagoe, R., Pasinski, T., Kronenberg, P., Quinn, T. and Schaengold, P. (2006) Linking health services at the com- munity level. Canada Healthcare Quarterly, 9, 60-65. [10] National Center for Health Statistics (2009) International classification of diseases, tenth revision, clinical modifi- cation (ICD-10-CM). http://www.cdc.gov/nchs/about/otheract/icd9/icd10cm.ht ml [11] Centers for Disease Control and Prevention (1997) Gui- delines for prevention of nosocomial pneumonia. Mor- bidity and Mortality Weekly Report, 46, 1-79. [12] Niederman, M.S., Craven, D.E., Bonten M.J., et al. (2005) Guidelines for the management of adults with hospital ac- quired, ventilator-associated, and healthcare associated— Pneumonia. American Journal of Respiratory Critical Care Medicine, 171, 388-416. doi:10.1164/rccm.200405-644ST [13] McEachern, R. and Campbell Jr., G.D. (1998) Hospital- acquired pneumonia: Epidemiology, etiology, and treat- ment. Infectious Disease Clinics of North America, 12, 761-779. doi:10.1016/S0891-5520(05)70209-9 [14] Cohen, S.H., Gerding, D.N., Johnson, S., Kelly, C.P., Loo, V.G., McDonald, L.C. and Wilcox, M.H. (2010) Clinical practice guidelines for clostridium difficile infection in adults: 2010 update by the society for healthcare epide- miology of America and the infectious diseases society of America. Infection Control & Hospital Epidemiology, 31, 431-455. doi:10.1086/651706 [15] Gould, C.V., Umscheid, C.A., Agarwal, R.K., Kuntz, G. and Pegues, D.A. (2009) Guideline for prevention of ca- theter-associated urinary tract infection. Healthcare Infec- tion Control Practices Advisory Committee, Atlanta. [16] Grossman, S. and Mager, D. (2010) Clostridium difficile: Implications for nursing. MEDSURG Nursing, 19, 155- 158. [17] Novell, M.J. and Morreale, C.A. (2010) The relationship between inpatient fluoroquinolone use and clostridium dif- ficile-associated diarrhea. Annals of Pharmacotherapy, 44, 826-831. doi:10.1345/aph.1M696 [18] Pépin, J., Saheb, N., Coulombe, M.A., Alary, M.E., Cor- riveau, M.P., Authier, S. and Lanthier, L. (2005) Emer- gence of fluoroquinolones as the predominant risk factor for clostridium difficile-associated diarrhea: A cohort stu- dy during an epidemic in Quebec. Clinical Infectious Dis- ease, 41, 1254-1260. Copyright © 2013 SciRes. OPEN ACCESS
|