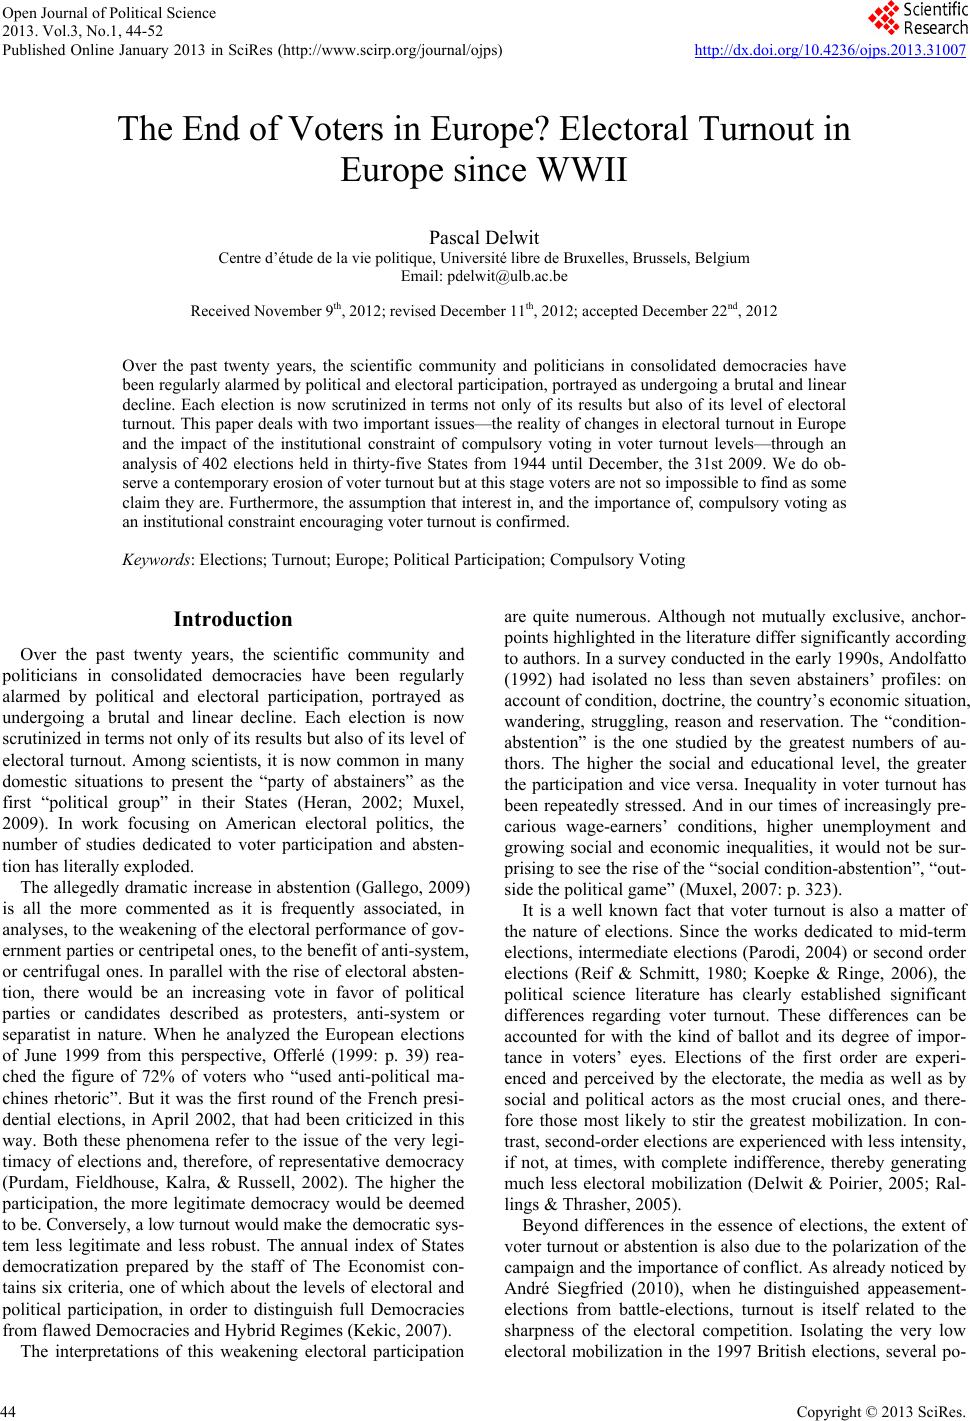
 Open Journal of Political Science 2013. Vol.3, No.1, 44-52 Published Online January 2013 in SciRes (http://www.scirp.org/journal/ojps) http://dx.doi.org/10.4236/ojps.2013.31007 Copyright © 2013 SciRes. 44 The End of Voters in Europe? Electoral Turnout in Europe since WWII Pascal Delwit Centre d’étude de la vie politique, Université libre de Bruxelles, Brussels, Belgium Email: pdelwit@u l b.ac.be Received November 9th, 20 12; revised December 11th, 2012; accepted December 22nd, 2012 Over the past twenty years, the scientific community and politicians in consolidated democracies have been regularly alarmed by political and electoral participation, portrayed as undergoing a brutal and linear decline. Each election is now scrutinized in terms not only of its results but also of its level of electoral turnout. This paper deals with two important issues—the reality of changes in electoral turnout in Europe and the impact of the institutional constraint of compulsory voting in voter turnout levels—through an analysis of 402 elections held in thirty-five States from 1944 until December, the 31st 2009. We do ob- serve a contemporary erosion of voter turnout but at this stage voters are not so impossible to find as some claim they are. Furthermore, the assumption that interest in, and the importance of, compulsory voting as an institutional constraint encouraging voter turnout is confirmed. Keywords: Elections; Turnout; Europe; Political Participation; Compulsory Voting Introduction Over the past twenty years, the scientific community and politicians in consolidated democracies have been regularly alarmed by political and electoral participation, portrayed as undergoing a brutal and linear decline. Each election is now scrutinized in terms not only of its results but also of its level of electoral turnout. Among scientists, it is now common in many domestic situations to present the “party of abstainers” as the first “political group” in their States (Heran, 2002; Muxel, 2009). In work focusing on American electoral politics, the number of studies dedicated to voter participation and absten- tion has literally exploded. The allegedly dramatic increase in abstention (Gallego, 2009) is all the more commented as it is frequently associated, in analyses, to the weakening of the electoral performance of gov- ernment parties or centripetal ones, to the benefit of anti-system, or centrifugal ones. In parallel with the rise of electoral absten- tion, there would be an increasing vote in favor of political parties or candidates described as protesters, anti-system or separatist in nature. When he analyzed the European elections of June 1999 from this perspective, Offerlé (1999: p. 39) rea- ched the figure of 72% of voters who “used anti-political ma- chines rhetoric”. But it was the first round of the French presi- dential elections, in April 2002, that had been criticized in this way. Both these phenomena refer to the issue of the very legi- timacy of elections and, therefore, of representative democracy (Purdam, Fieldhouse, Kalra, & Russell, 2002). The higher the participation, the more legitimate democracy would be deemed to be. Conversely, a low turnout woul d make the democratic sys- tem less legitimate and less robust. The annual index of States democratization prepared by the staff of The Economist con- tains six criteria, one of which about the levels of electoral and political participation, in order to distinguish full Democracies from flawed Democracies and Hybrid Regimes (Kekic, 2007). The interpretations of this weakening electoral participation are quite numerous. Although not mutually exclusive, anchor- points highlighted in the literature differ significantly according to authors. In a survey conducted in the early 1990s, Andolfatto (1992) had isolated no less than seven abstainers’ profiles: on account of condition, doctrine, the country’s economic situation, wandering, struggling, reason and reservation. The “condition- abstention” is the one studied by the greatest numbers of au- thors. The higher the social and educational level, the greater the participation and vice versa. Inequality in voter turnout has been repeatedly stressed. And in our times of increasingly pre- carious wage-earners’ conditions, higher unemployment and growing social and economic inequalities, it would not be sur- prising to see the rise of the “social condition-abstention”, “out- side the political game” (Muxel, 2007: p. 323). It is a well known fact that voter turnout is also a matter of the nature of elections. Since the works dedicated to mid-term elections, intermediate elections (Parodi, 2004) or second order elections (Reif & Schmitt, 1980; Koepke & Ringe, 2006), the political science literature has clearly established significant differences regarding voter turnout. These differences can be accounted for with the kind of ballot and its degree of impor- tance in voters’ eyes. Elections of the first order are experi- enced and perceived by the electorate, the media as well as by social and political actors as the most crucial ones, and there- fore those most likely to stir the greatest mobilization. In con- trast, second-order elections are experienced with less intensity, if not, at times, with complete indifference, thereby generating much less electoral mobilization (Delwit & Poirier, 2005; Ral- lings & Thrasher, 2005). Beyond differences in the essence of elections, the extent of voter turnout or abstention is also due to the polarization of the campaign and the importance of conflict. As already noticed by André Siegfried (2010), when he distinguished appeasement- elections from battle-elections, turnout is itself related to the sharpness of the electoral competition. Isolating the very low electoral mobilization in the 1997 British elections, several po-  P. DELWIT litical scientists have reminded us of that dimension and many voters’ perception of an election as being a foregone conclusion (Pattie & Johnston, 2001). As for majority polls, in constituen- cies where the outcome is strongly anticipated, the turnout proves to be very low (Duverger, 1992). The tightening of the limits of political action also makes it harder to understand the political game and therefore causes less incentive to vote. In a recent contribution, Kriesi (2008: p. 153) agreed with Franklin and Wattenberg (2002) on consider- ing that the “ideological convergence” of the main parties can account for a decisive erosion of voter turnout and the disen- chantment of the younger generation with the election act. Determinants of socio-demographic nature appear critical in relation to voter turnout. The level of educational capital is now considered as particularly important. Van Egmond, de Graaf & Van Der Eijk (1998) have identified it to account for the dif- ferences in voter turnout in the Dutch case. Note however, the existence of a conflict of interpretations. While many authors pin the relation with educational capital as a distinctive feature for different levels of participation, others highlight a rising trend in educational capital leading to... greater abstention. So, the level of diplomas stand as a discriminating factor in voter turnout, but it would not be the main element capable of ex- plaining the supposed increase in electoral abstention rates. Alternatively, the approach would be to see a drastic drop in voter turnout among social groups with low social and/or edu- cational capital (Pacek & Radcliff, 1995). This issue refers to rising individualism, interpreted in all its dimensions. The first, deemed positive, refers to individual freedom: having the choice to vote or not. In this respect, voters are said to be more demanding. Pierre Bréchon (2002: p. 84) put forward “Citizens in modern societies vote less a nd less out of a sense of duty or on principle; they want to be sure they have good reasons to vote before going out of their homes to the polls. Voting is getting more rationalized and individualized, which constitutes both its nobleness but also its fragility”. From this perspective, the electoral participation of younger genera- tions is cause of great concern among political authorities in many democratic States and it focuses the attention of political scientists. These explanations usually fall into the rational choice ap- proaches, also put forward by Narud and Valen (1996) in the Norwegian case, which were developed theoretically by Blais (2000), and which Crepaz (1990: p. 186) strongly objects to, however: “When people vote, they hardly do so on a narrow rational basis”. More generally, the rise of individualism is often associated with the decline of social support structures, whether cultural or political. However, these structures are of- ten vehicles of mobilization, including during elections. Rad- cliff and Davis (2000) have shown the impact of the strength of the labor movement and its organizations on the turnout in elections. The higher the rate of unionization, the higher the levels of voter turnout. However, taking only the examples of trade unions or political parties (Delwit, 2011; Van Biezen, Mair, & Poguntke, 2011), the level of Union membership or sympathizers’ adhesion rates will usually decline and electoral mobilization would be affected by it (Wattenberg, 2002). Although systematic abstention is still a minority phenome- non, it does seem to increase over time, confirming another explanation for the slump in voter turnout: the increase in with- drawal postures from society or political life. The growth of abstention would be a sign of indifference toward, and even distrust of, “the thing political” and its conventional actors: parties. Parties are now the most disliked among social and political organizations and institutions. Their alleged failure to act on citizens’ primary concerns, employment and unemploy- ment, led to a disillusionment that has translated itself in the polls. Franklin (1999: p. 206) makes this his central assumption: “My basic contention is simple:people vote in order to affect the outputs of government in ways that are meaningful to them. Low turnout thus reflects a paucity of choices for a lack of evi- dent connection between electoral choice and policy change”. What is the impact of the decline in voter turnout? As men- tioned earlie r the legitimacy of the vote and of the system itself would be affected. But the same applies to results. Volatility is said to be currently less important to grasp turnout evolutions. Marc Swyngedouw (2000) has shown how the victory of the French Left in the 1997 election was achieved thanks to a better mobilization of their constituents than of their center-right counterparts. And as was pointed out by Dolez (2004: p. 679), “at a time when abstainers sometimes outnumber voters, it re- minds us that the outcome of an election depends as much on voters staying away from the polls than on those who choose to cast their votes ”. Examined from a global perspective, what is the supposed impact of a drop in voter turnout? In their analysis of election results in 19 democracies between 1950 and 1990, Pacek and Radcliff (1995) have isolated a correlation between results and turnout levels: the lower the abstention, the higher left wing parties’ scores. Conversely, the lower the turnout, the lower the total votes in favor of left wing parties. The phenomenon is reportedly all the more striking as we are dealing with a left- wing that is closely linked to, and dependent on, the traditional working class vote. In other words, left wing parties would tend to be the hardest-hit by the growth of abstention. Faced with what is presented as a tidal-wave of abstention, several officials and political scientists have tried to find “re- medies”. A large part of the proposals revolved around techni- cal solutions: more open polling-stations, deferred voting, pos- tal voting, electronic voting, Internet or SMS voting. A more audacious solution is to advocate a change in the electoral sys- tem when the voting based on proportional representation would result in higher turnout than would the modes of mixed or majority voting in national elections (Lijphart, 1997); from 4 to 5 points—uninominal majority vote, to 11.5 points—major- ity multi-nominal vote (Blais & Carthy, 1990: p. 175). But in the field of institutional constraint, the most radical position aims at introducing or reintroducing compulsory voting. Arend Lijphart (1997: p. 11), in particular, has led the scientific debate by promoting this solution to the rise of abstention: “Compul- sory voting cannot solve the whole conflict between the ideals of participation and equality, but by making voting participa- tion as equal as possible, it is a valuable partial solution”. In this paper, we propose to return to two important issues: changes in electoral turnout and the impact of the institutional constraint of compulsory voting in voter turnout levels. Vis-à- vis these two themes, the conversation is recurrent but is often part of a perspective that is simultaneously monographic, short- term and sometimes prescriptive. Our goal is to address both these issues in a comparative perspective and over the long run. The issue of the time horizon is essential. In 1990, only 21 years ago, Blais and Carty (1990: p. 174) revealed... the upward trend in participation rates over time from an analysis of 509 ballots: “The average turnout across all the elections in our date Copyright © 2013 SciRes. 45  P. DELWIT set is 78%. And turnout has been increasing over time: it aver- aged around 70% in elections before War World I but, in the contemporary period, it is typically almost at 84%, which represents a 20% growth”. At present, the perception is radi- cally different. From this perspective, two hypotheses can be put forward: The contemporary period is marked by a rapid and system- atic decline in voter turnout. Compulsory voting may be described as an institutional constraint, effectively preventing the fall in turnout. Our survey focuses on elections deemed democratic in Eu- rope, from 1944 to December 2009. It is therefore appropriate at the outset to present certain methodological precautions and limitations to the work we have undertaken. In Europe, unlike in the United States, the turnout or absten- tion rates are calculated on the basis of registered voters. In some States, registration is both mandatory and automatic—in contrast to other configurations, where it is not automatic. It may eventually be compulsory and subject to a penalty for fail- ure to comply, or be free. In situations where registration is not automatic, a segment of the population does not bother to reg- ister as voters. For Bréchon, non-registration and abstention are in fact the two sides of same coin (Bréchon, 1998: p. 17). What is the magnitude of the phenomenon? It is difficult to assess but may reach 7% to 10% of the total population and much more in some social and cultural categories. During the 2006 presiden- tial election in Chile, three quarters of 18 to 24 years olds were not included in the electoral rolls. Despite the legal obligation, besides the liability of a fine, estimates of non-registration among black and ethnic minorities in Britain raises to almost 15% (Purdam, Fieldhouse, Kalra, & Russell, 2002: p. 19). In France, recent studies by Brouard and Tiberj estimate it at 23% of the French coming from North Africa, Turkey and sub-Sa- haran Africa, and at 7% for native French (Brouard & Tiberj, 2005). Overall, this registration may be experienced as a con- straint that is too high compared to the attraction of voting. A survey conducted at European level reported that up to 15% of voters in States where the vote was not compulsory explained their abstention as follows: the reason why they did not vote at the European elections had to do with problems regarding voter registration or notice to come and vote (Blondel, Sinnott, & Svensson, 1997). These observations remind us, as already pointed out by Lancelot (1968) more than four decades ago, that voter turnout in several States is lower than indicated by the abstention rate. Therefore, registration is an important indicator of electoral mobilization: “The American experience shows that a State fai- lure to take on this responsibility means in practice that a sub- stantial portion of the adult population is excluded from the voting process” (Rose, 1997: p. 45). Hence, improved registra- tion mechanisms or the introduction of a quasi automatic proc- ess increases abstention rates almost ipso facto. Data collected on abstention in Europe fails therefore to reveal the whole story of voter turnout. Basically, the participation rates discussed in this contribution are lower than those mentioned. Unfortunately, information about non-registration is regularly too sketchy to be included in a comparative and longitudinal analysis. Trends in European Voter Turnout since World War II To deal with the issue of the contemporary accelerated rise in abstention, we take into account all European states having held at least one ballot in a free and competitive framework, and whose results are validated domestically and internationally. Thirty-five States have been considered: Albania (2), Austria (20), Belgium (20), Bulgaria (7), Croatia (2), Cyprus (8), the Czech Republic (6), Denmark (25), Estonia (5), Finland (18), France (18), Germany (17), Greece (12), Hungary (5), Iceland (20), Ireland (19), Italy (17), Latvia (5), Lithuania (5), Luxem- burg (15), Macedonia (3), Malta (16), Montenegro (1), The Netherlands (19), Norway (17), Poland (6), Portugal (13), Ro- mania (6), Spain (10), Serbia (3), Slovakia (4), Slovenia (5), Sweden (20), Switzerland (16) and the United Kingdom (17). For each of these States, we took into account all genuinely democratic national parliamentary elections for the appointment of Members of Parliament, which took place from 1944 to 31 December 2009, namely a total of 402 elections were analyzed. Regarding the electoral data, we have always sought the pri- mary data from national electoral commissions and/or from the Ministry of the Interior. When this data was not available, we used secondary sources deemed most reliable—in particular, data collected by Mackie and Rose (1991) or by the Institute for Democracy and Electoral Assistance (2004). In the few in- stances when we used secondary data, we have consistently sought to cross-examine the information. This enabled us to fine-tune the information and correct a number of errors. The Average Change in Turnout in Europe: 1945-2009 To assess changes in voter turnout in Europe, we proceeded in several stages. We first calculated the average ten-year voter turnout across Europe. To calculate this average, we use two approaches. The first is to add all registered voters to all voters casting a vote in an election during the decade under compari- son. The second is to average the participation rate in all the States considered in the decade. All States are not taken into account throughout the period with respect to the democratic transitions that occurred in the 1970’s in some States in Southern Europe and in the 1990’s in Central and Eastern Europe. To perform longitudinal compari- sons, we present seven categories: the Europe of the 16 (de- mocratic States throughout the period), The Europe of the 4 (Cyprus, Greece, Portugal and Spain), the Europe of the 20 (EU 16 + EU 4), the Europe of the 10 (Bulgaria, Czech Republic, Estonia, Hungary, Latvia, Lithuania, Poland, Romania, Slova- kia and Slovenia), the Europe of the 30 (EU 20 + EU 10), the Europe of the 5 (Albania, Croatia, Macedonia, Montenegro and Serbia), the Europe of the 35 (EU 30 + EU 5). Moreover, the 1940s stand as a special case. It concerns only one luster, that is to say, only one single election taken into account in the States we analyze. Given this methodological precaution, what does the evolution of the ten-year average percentage of voter turn- out reveal? The results are presented in Table 1 for the calcula- tion on the total of votes and in Table 2 for the calculation on turnout in the States (see Tables 1 and 2). On analyzing the average turnout evolution, several lessons can be learnt. First, the curve is not linear, whatever the indica- tor used. From the forties to the seventies, the average turnout was both high and stable: between 82% and 84.5% of European voters took part in national elections. However, since the late seventies, the movement is clearly marked: electoral abstention s growing. Within two decadestwo thresholds were crossed. i , Copyright © 2013 SciRes. 46 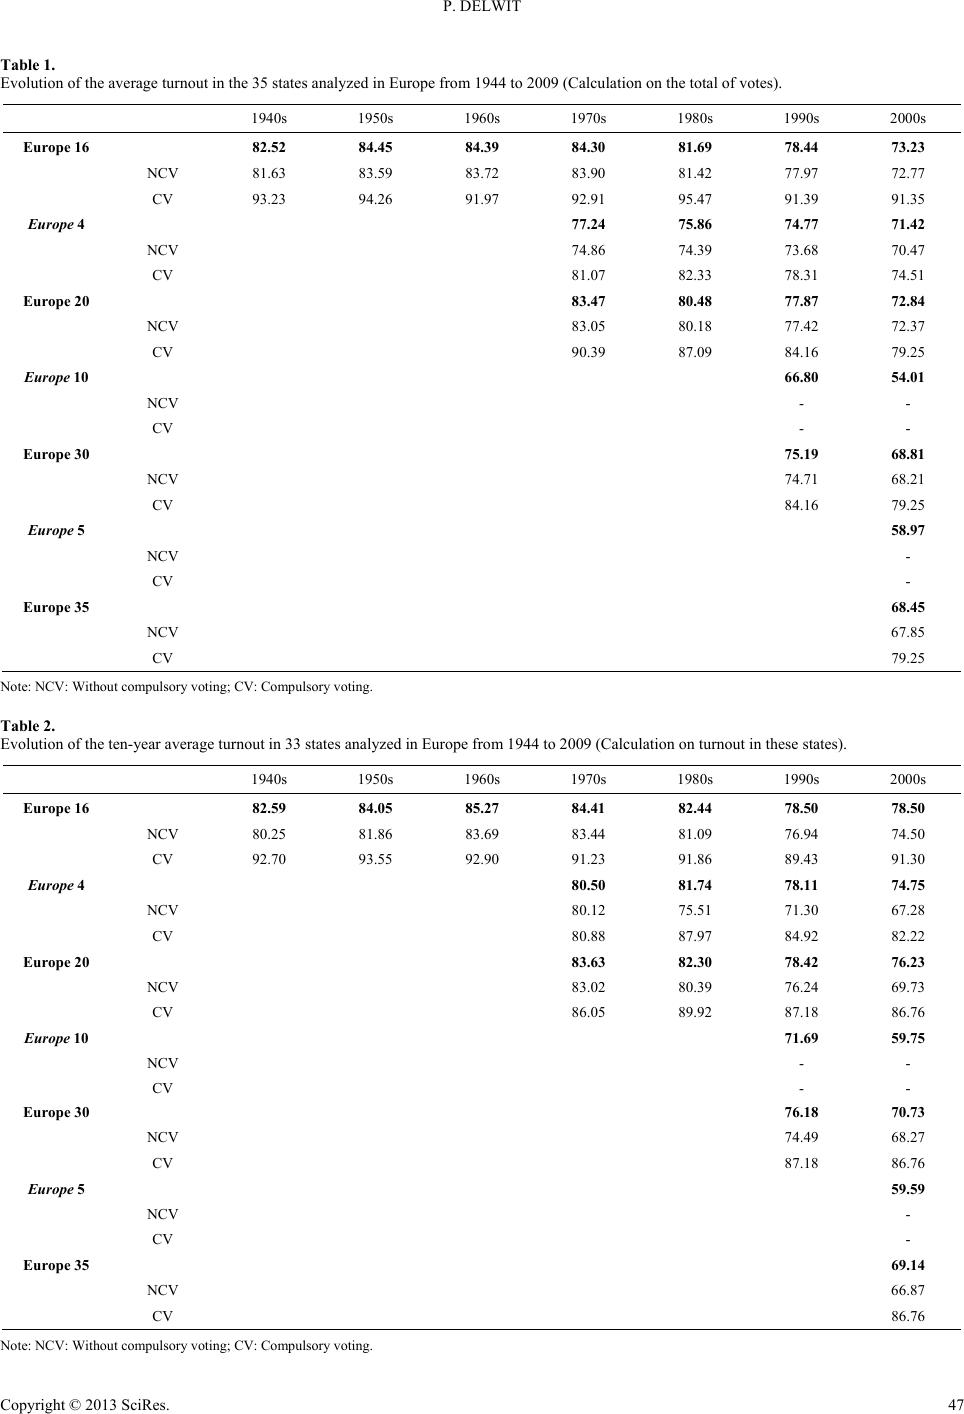 P. DELWIT Copyright © 2013 SciRes. 47 Table 1. Evolution of the average turnout in the 35 states analyzed in Europe from 1944 to 2009 ( Cal cu lat ion on th e total of votes). 1940s 1950s 1960s 1970s 1980s 1990s 2000s Europe 16 82.52 84.45 84.39 84.30 81.69 78.44 73.23 NCV 81.63 83.59 83.72 83.90 81.42 77.97 72.77 CV 93.23 94.26 91.97 92.91 95.47 91.39 91.35 Europe 4 77.24 75.86 74.77 71.42 NCV 74.86 74.39 73.68 70.47 CV 81.07 82.33 78.31 74.51 Europe 20 83.47 80.48 77.87 72.84 NCV 83.05 80.18 77.42 72.37 CV 90.39 87.09 84.16 79.25 Europe 10 66.80 54.01 NCV - - CV - - Europe 30 75.19 68.81 NCV 74.71 68.21 CV 84.16 79.25 Europe 5 58.97 NCV - CV - Europe 35 68.45 NCV 67.85 CV 79.25 Note: NC V: Without compulsory voting; C V: Compulsory voting. Table 2. Evolution of the ten- year average turnout in 3 3 s t a tes analyzed in Europe from 1944 to 2009 (Calculation on turnout in these states). 1940s 1950s 1960s 1970s 1980s 1990s 2000s Europe 16 82.59 84.05 85.27 84.41 82.44 78.50 78.50 NCV 80.25 81.86 83.69 83.44 81.09 76.94 74.50 CV 92.70 93.55 92.90 91.23 91.86 89.43 91.30 Europe 4 80.50 81.74 78.11 74.75 NCV 80.12 75.51 71.30 67.28 CV 80.88 87.97 84.92 82.22 Europe 20 83.63 82.30 78.42 76.23 NCV 83.02 80.39 76.24 69.73 CV 86.05 89.92 87.18 86.76 Europe 10 71.69 59.75 NCV - - CV - - Europe 30 76.18 70.73 NCV 74.49 68.27 CV 87.18 86.76 Europe 5 59.59 NCV - CV - Europe 35 69.14 NCV 66.87 CV 86.76 N ote: NCV : Without compulsory voting; CV: C ompulsory voting. 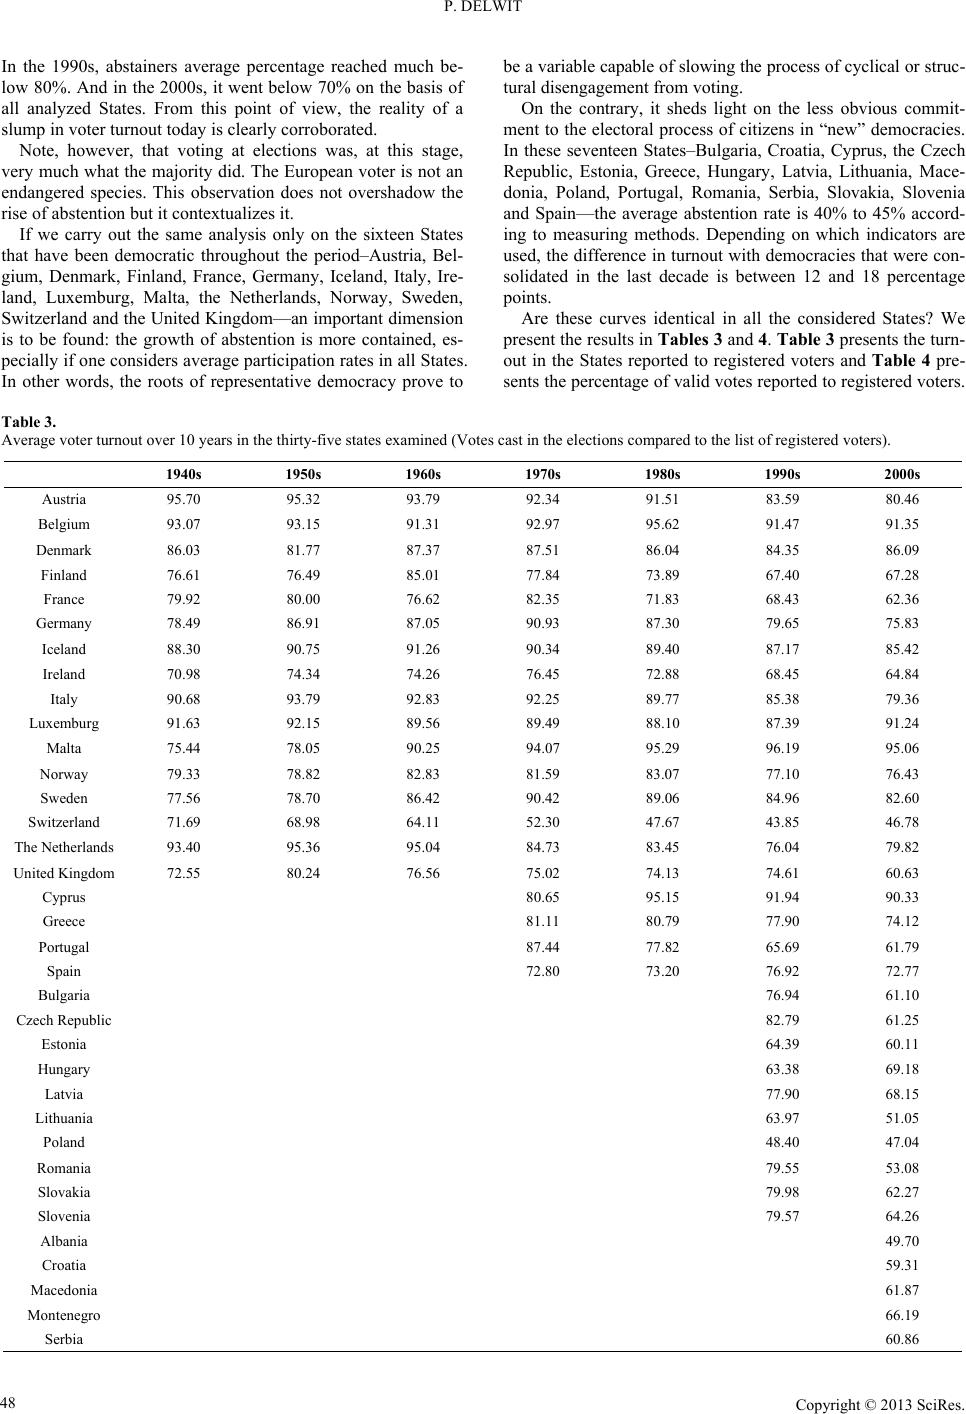 P. DELWIT In the 1990s, abstainers average percentage reached much be- low 80%. And in the 2000s, it went below 70% on the basis of all analyzed States. From this point of view, the reality of a slump in voter turnout today is clearly corroborated. Note, however, that voting at elections was, at this stage, very much what the majority did. The European voter is not an endangered species. This observation does not overshadow the rise of abstention but it contextual izes it. If we carry out the same analysis only on the sixteen States that have been democratic throughout the period–Austria, Bel- gium, Denmark, Finland, France, Germany, Iceland, Italy, Ire- land, Luxemburg, Malta, the Netherlands, Norway, Sweden, Switzerland and the United Kingdom—an important dimension is to be found: the growth of abstention is more contained, es- pecially if one considers average participation rates in all States. In other words, the roots of representative democracy prove to be a variable capable of slowing the process of cyclical or struc- tural disengagement from voting. On the contrary, it sheds light on the less obvious commit- ment to the electoral process of citizens in “new” democracies. In these seventeen States–Bulgaria, Croatia, Cyprus, the Czech Republic, Estonia, Greece, Hungary, Latvia, Lithuania, Mace- donia, Poland, Portugal, Romania, Serbia, Slovakia, Slovenia and Spain—the average abstention rate is 40% to 45% accord- ing to measuring methods. Depending on which indicators are used, the difference in turnout with democracies that were con- solidated in the last decade is between 12 and 18 percentage points. Are these curves identical in all the considered States? We present the results in Tables 3 and 4. Table 3 presents the turn- out in the States reported to registered voters and Table 4 pre- sents the percentage of valid votes reported to registered voters. Table 3. Average voter turnout over 10 years in the thirty-five states examined (Votes cast in the elections compared to the list of registered voters). 1940s 1950s 1960s 1970s 1980s 1990s 2000s Austria 95.70 95.32 93.79 92.34 91.51 83.59 80.46 Belgium 93.07 93.15 91.31 92.97 95.62 91.47 91.35 Denmark 86.03 81.77 87.37 87.51 86.04 84.35 86.09 Finland 76.61 76.49 85.01 77.84 73.89 67.40 67.28 France 79.92 80.00 76.62 82.35 71.83 68.43 62.36 Germany 78.49 86.91 87.05 90.93 87.30 79.65 75.83 Iceland 88.30 90.75 91.26 90.34 89.40 87.17 85.42 Ireland 70.98 74.34 74.26 76.45 72.88 68.45 64.84 Italy 90.68 93.79 92.83 92.25 89.77 85.38 79.36 Luxemburg 91.63 92.15 89.56 89.49 88.10 87.39 91.24 Malta 75.44 78.05 90.25 94.07 95.29 96.19 95.06 Norway 79.33 78.82 82.83 81.59 83.07 77.10 76.43 Sweden 77.56 78.70 86.42 90.42 89.06 84.96 82.60 Switzerland 71.69 68.98 64.11 52.30 47.67 43.85 46.78 The Netherlands 93.40 95.36 95.04 84.73 83.45 76.04 79.82 United Kingdom 72.55 80.24 76.56 75.02 74.13 74.61 60.63 Cyprus 80.65 95.15 91.94 90.33 Greece 81.11 80.79 77.90 74.12 Portugal 87.44 77.82 65.69 61.79 Spain 72.80 73.20 76.92 72.77 Bulgaria 76.94 61.10 Czech Republic 82.79 61.25 Estonia 64.39 60.11 Hungary 63.38 69.18 Latvia 77.90 68.15 Lithuania 63.97 51.05 Poland 48.40 47.04 Romania 79.55 53.08 Slovakia 79.98 62.27 Slovenia 79.57 64.26 Albania 49.70 Croatia 59.31 Macedonia 61.87 Montenegro 66.19 Serbia 60.86 Copyright © 2013 SciRes. 48 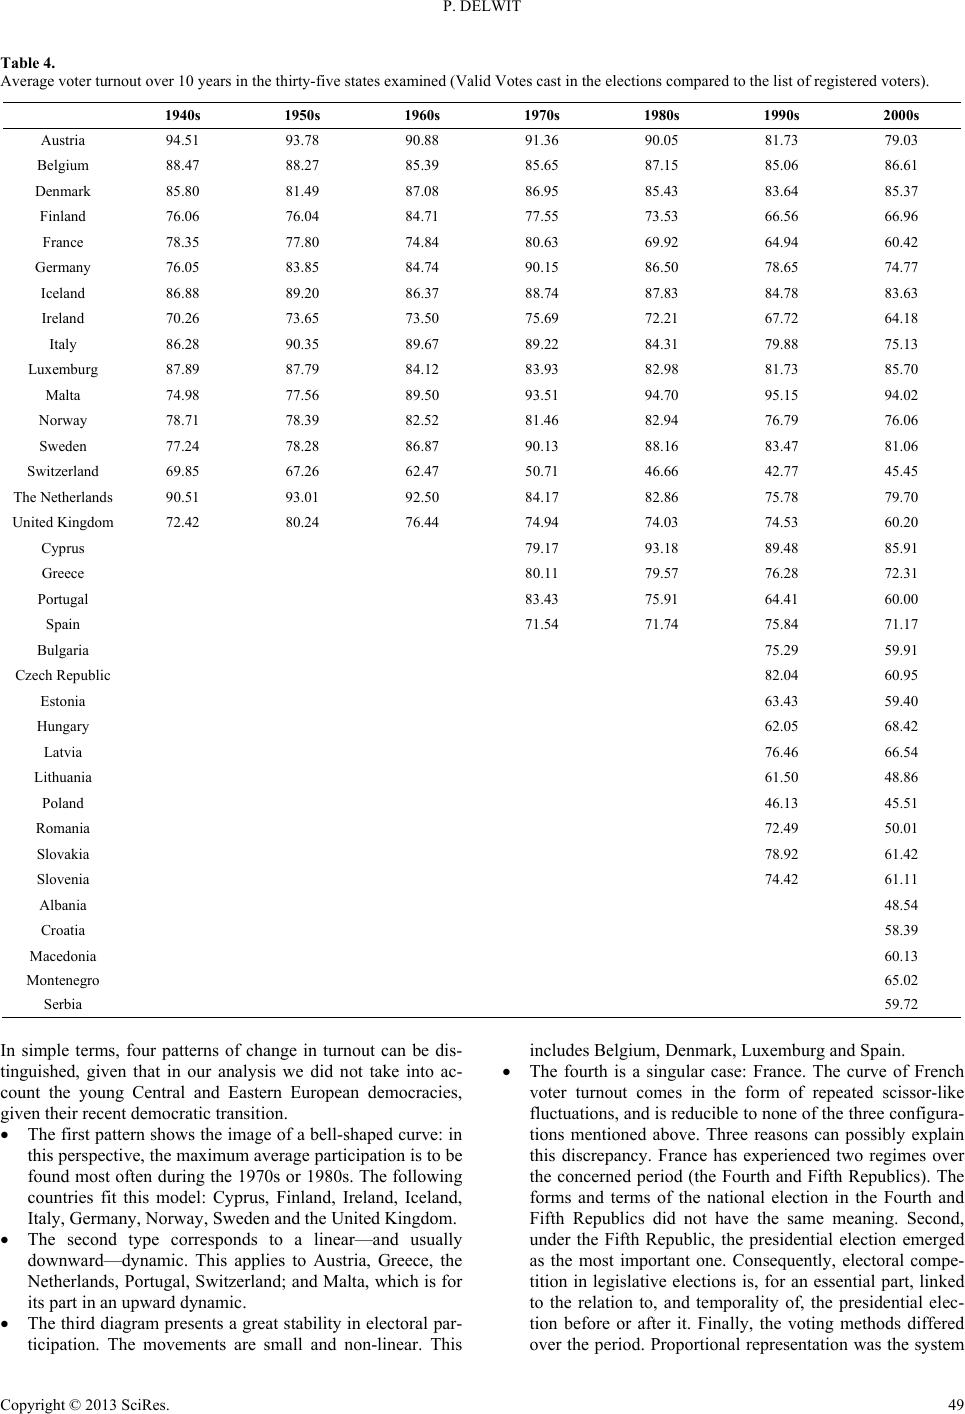 P. DELWIT Table 4. Average voter turnout over 10 years in the thirty-five states examined (Valid Votes cast in the elections compared to the list of registered voters). 1940s 1950s 1960s 1970s 1980s 1990s 2000s Austria 94.51 93.78 90.88 91.36 90.05 81.73 79.03 Belgium 88.47 88.27 85.39 85.65 87.15 85.06 86.61 Denmark 85.80 81.49 87.08 86.95 85.43 83.64 85.37 Finland 76.06 76.04 84.71 77.55 73.53 66.56 66.96 France 78.35 77.80 74.84 80.63 69.92 64.94 60.42 Germany 76.05 83.85 84.74 90.15 86.50 78.65 74.77 Iceland 86.88 89.20 86.37 88.74 87.83 84.78 83.63 Ireland 70.26 73.65 73.50 75.69 72.21 67.72 64.18 Italy 86.28 90.35 89.67 89.22 84.31 79.88 75.13 Luxemburg 87.89 87.79 84.12 83.93 82.98 81.73 85.70 Malta 74.98 77.56 89.50 93.51 94.70 95.15 94.02 Norway 78.71 78.39 82.52 81.46 82.94 76.79 76.06 Sweden 77.24 78.28 86.87 90.13 88.16 83.47 81.06 Switzerland 69.85 67.26 62.47 50.71 46.66 42.77 45.45 The Netherlands 90.51 93.01 92.50 84.17 82.86 75.78 79.70 United Kingdom 72.42 80.24 76.44 74.94 74.03 74.53 60.20 Cyprus 79.17 93.18 89.48 85.91 Greece 80.11 79.57 76.28 72.31 Portugal 83.43 75.91 64.41 60.00 Spain 71.54 71.74 75.84 71.17 Bulgaria 75.29 59.91 Czech Republic 82.04 60.95 Estonia 63.43 59.40 Hungary 62.05 68.42 Latvia 76.46 66.54 Lithuania 61.50 48.86 Poland 46.13 45.51 Romania 72.49 50.01 Slovakia 78.92 61.42 Slovenia 74.42 61.11 Albania 48.54 Croatia 58.39 Macedonia 60.13 Montenegro 65.02 Serbia 59.72 In simple terms, four patterns of change in turnout can be dis- tinguished, given that in our analysis we did not take into ac- count the young Central and Eastern European democracies, given their recent democratic transition. The first pattern shows the image of a bell-shaped curve: in this perspective, the maximum average participation is to be found most often during the 1970s or 1980s. The following countries fit this model: Cyprus, Finland, Ireland, Iceland, Italy, Germany, Norway, Sweden and the United Kingdom. The second type corresponds to a linear—and usually downward—dynamic. This applies to Austria, Greece, the Netherlands, Portugal, Switzerland; and Malta, which is for its part in an upward dynamic. The third diagram presents a great stability in electoral par- ticipation. The movements are small and non-linear. This includes Belgium, Denmark, Luxemburg and Spain. The fourth is a singular case: France. The curve of French voter turnout comes in the form of repeated scissor-like fluctuations, and is reducible to none of the three configura- tions mentioned above. Three reasons can possibly explain this discrepancy. France has experienced two regimes over the concerned period (the Fourth and Fifth Republics). The forms and terms of the national election in the Fourth and Fifth Republics did not have the same meaning. Second, under the Fifth Republic, the presidential election emerged as the most important one. Consequently, electoral compe- tition in legislative elections is, for an essential part, linked to the relation to, and temporality of, the presidential elec- tion before or after it. Finally, the voting methods differed over the period. Proportional representation was the system Copyright © 2013 SciRes. 49 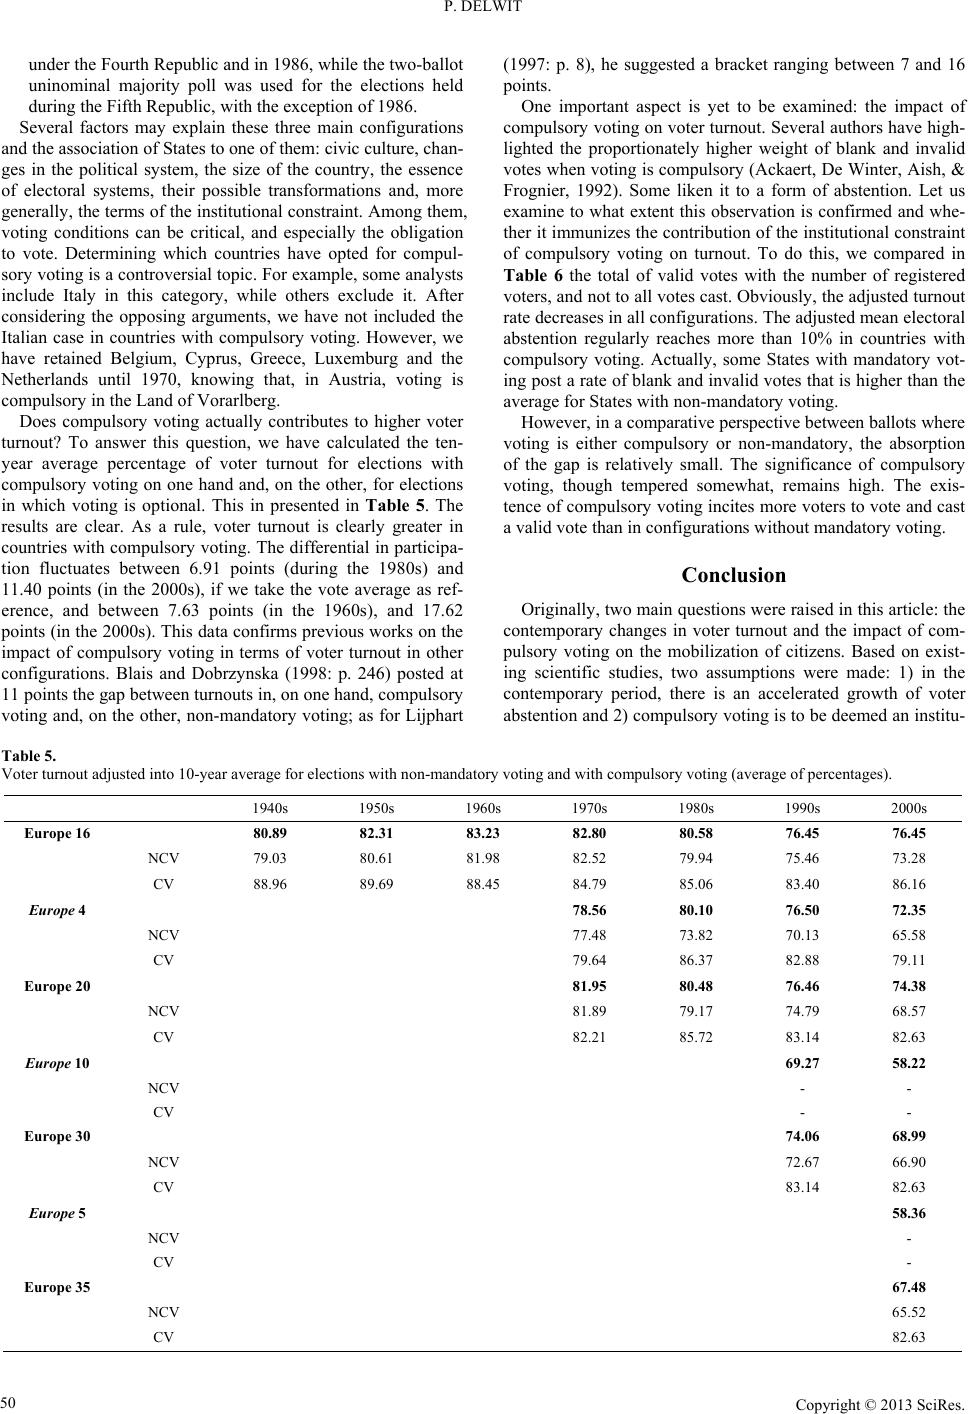 P. DELWIT under the Fourth Republic and in 1986, while the two-ballot uninominal majority poll was used for the elections held during the Fifth Republic, with the exception of 1986. Several factors may explain these three main configurations and the association of States to one of them: civic culture, chan- ges in the political system, the size of the country, the essence of electoral systems, their possible transformations and, more generally, the terms of the institutional constraint. Among them, voting conditions can be critical, and especially the obligation to vote. Determining which countries have opted for compul- sory voting is a controversial topic. For example, some analysts include Italy in this category, while others exclude it. After considering the opposing arguments, we have not included the Italian case in countries with compulsory voting. However, we have retained Belgium, Cyprus, Greece, Luxemburg and the Netherlands until 1970, knowing that, in Austria, voting is compulsory in the Land of Vorarlberg. Does compulsory voting actually contributes to higher voter turnout? To answer this question, we have calculated the ten- year average percentage of voter turnout for elections with compulsory voting on one hand and, on the other, for elections in which voting is optional. This in presented in Table 5. The results are clear. As a rule, voter turnout is clearly greater in countries with compulsory voting. The differential in participa- tion fluctuates between 6.91 points (during the 1980s) and 11.40 points (in the 2000s), if we take the vote average as ref- erence, and between 7.63 points (in the 1960s), and 17.62 points (in the 2000s). This data confirms previous works on the impact of compulsory voting in terms of voter turnout in other configurations. Blais and Dobrzynska (1998: p. 246) posted at 11 points the gap between turnouts in, on one hand, compulsory voting and, on the other, non-mandatory voting; as for Lijphart (1997: p. 8), he suggested a bracket ranging between 7 and 16 points. One important aspect is yet to be examined: the impact of compulsory voting on voter turnout. Several authors have high- lighted the proportionately higher weight of blank and invalid votes when voting is compulsory (Ackaert, De Winter, Aish, & Frognier, 1992). Some liken it to a form of abstention. Let us examine to what extent this observation is confirmed and whe- ther it immunizes the contribution of the institutional constraint of compulsory voting on turnout. To do this, we compared in Table 6 the total of valid votes with the number of registered voters, and not to all votes cast. Obviously, the adjusted turnout rate decreases in all configurations. The adjusted mean electoral abstention regularly reaches more than 10% in countries with compulsory voting. Actually, some States with mandatory vot- ing post a rate of blank and invalid votes that is higher than the average for States with non-mandatory voting. However, in a comparative perspective between ballots where voting is either compulsory or non-mandatory, the absorption of the gap is relatively small. The significance of compulsory voting, though tempered somewhat, remains high. The exis- tence of compulsory voting incites more voters to vote an d cast a valid vote than in configurations without mandatory voting. Conclusion Originally, two main questions were raised in this article: the contemporary changes in voter turnout and the impact of com- pulsory voting on the mobilization of citizens. Based on exist- ing scientific studies, two assumptions were made: 1) in the contemporary period, there is an accelerated growth of voter abstention and 2) compulsory voting is to be deemed an institu- Table 5. Voter turnout adjusted i n t o 10-year average for elections with non-m andatory voting and w it h compulsory voting ( average of percentages). 1940s 1950s 1960s 1970s 1980s 1990s 2000s Europe 16 80.89 82.31 83.23 82.80 80.58 76.45 76.45 NCV 79.03 80.61 81.98 82.52 79.94 75.46 73.28 CV 88.96 89.69 88.45 84.79 85.06 83.40 86.16 Europe 4 78.56 80.10 76.50 72.35 NCV 77.48 73.82 70.13 65.58 CV 79.64 86.37 82.88 79.11 Europe 20 81.95 80.48 76.46 74.38 NCV 81.89 79.17 74.79 68.57 CV 82.21 85.72 83.14 82.63 Europe 10 69.27 58.22 NCV - - CV - - Europe 30 74.06 68.99 NCV 72.67 66.90 CV 83.14 82.63 Europe 5 58.36 NCV - CV - Europe 35 67.48 NCV 65.52 CV 82.63 Copyright © 2013 SciRes. 50 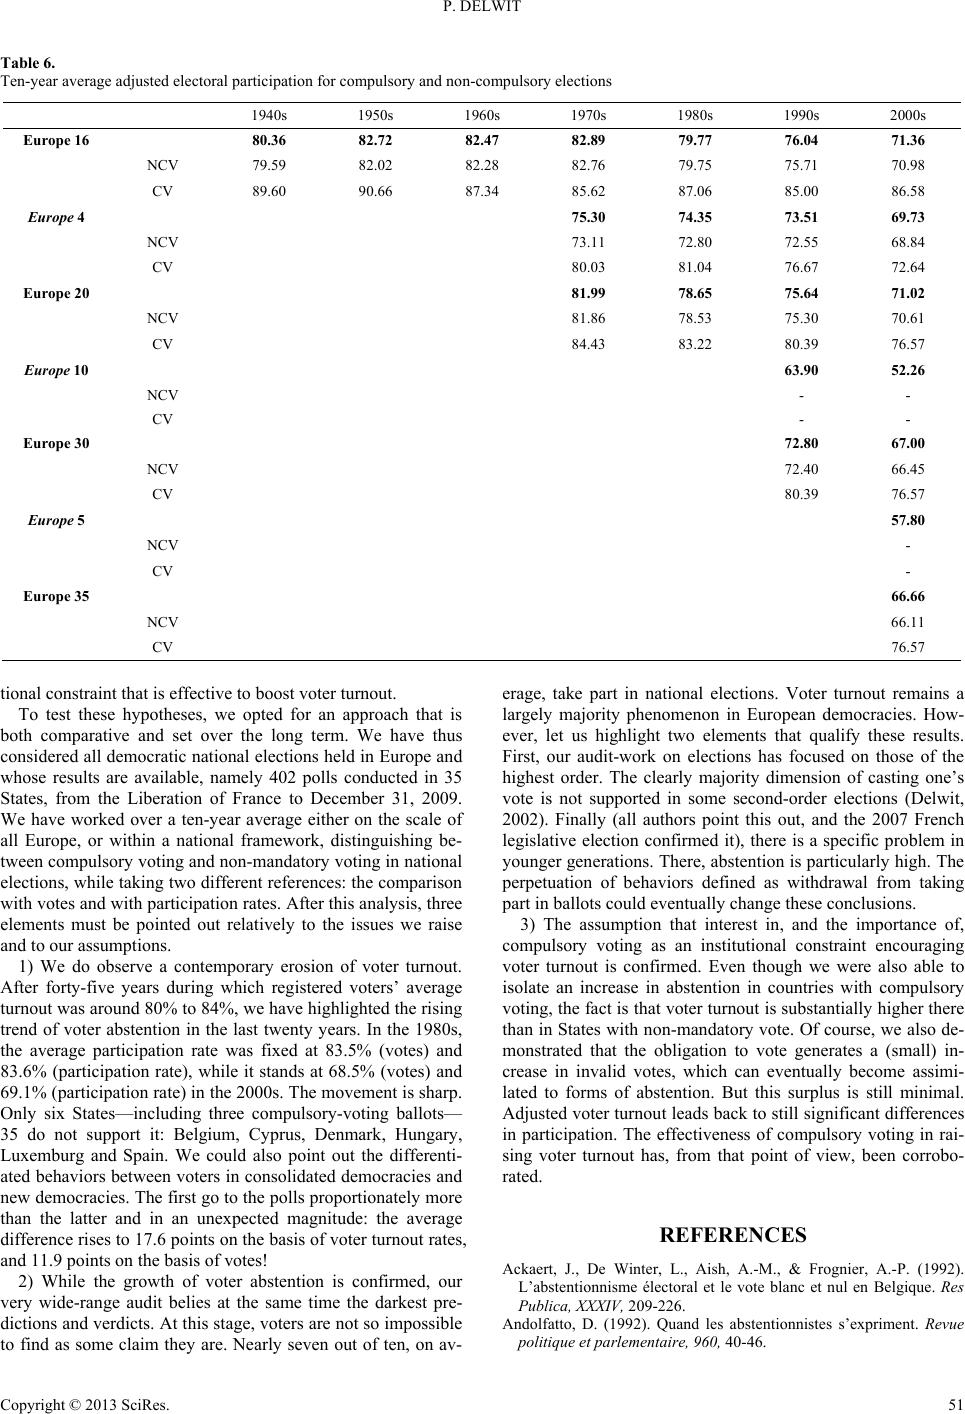 P. DELWIT Table 6. Ten-year average adjusted electoral participation for c ompulsory and non-compulsory elections 1940s 1950s 1960s 1970s 1980s 1990s 2000s Europe 16 80.36 82.72 82.47 82.89 79.77 76.04 71.36 NCV 79.59 82.02 82.28 82.76 79.75 75.71 70.98 CV 89.60 90.66 87.34 85.62 87.06 85.00 86.58 Europe 4 75.30 74.35 73.51 69.73 NCV 73.11 72.80 72.55 68.84 CV 80.03 81.04 76.67 72.64 Europe 20 81.99 78.65 75.64 71.02 NCV 81.86 78.53 75.30 70.61 CV 84.43 83.22 80.39 76.57 Europe 10 63.90 52.26 NCV - - CV - - Europe 30 72.80 67.00 NCV 72.40 66.45 CV 80.39 76.57 Europe 5 57.80 NCV - CV - Europe 35 66.66 NCV 66.11 CV 76.57 tional constraint that is effective to boost voter turnout. To test these hypotheses, we opted for an approach that is both comparative and set over the long term. We have thus considered all democratic national elections held in Europe and whose results are available, namely 402 polls conducted in 35 States, from the Liberation of France to December 31, 2009. We have worked over a ten-year average either on the scale of all Europe, or within a national framework, distinguishing be- tween compulsory voting and non-mandatory voting in national elections, while taking two different references: the comparison with votes and with participation rates. After this analysis, three elements must be pointed out relatively to the issues we raise and to our assumptions. 1) We do observe a contemporary erosion of voter turnout. After forty-five years during which registered voters’ average turnout was around 80% to 84%, we have highlighted the rising trend of voter abstention in the last twenty years. In the 1980s, the average participation rate was fixed at 83.5% (votes) and 83.6% (participation rate), while it stands at 68.5% (votes) and 69.1% (participation rate) in the 2000s. The movement is sharp. Only six States—including three compulsory-voting ballots— 35 do not support it: Belgium, Cyprus, Denmark, Hungary, Luxemburg and Spain. We could also point out the differenti- ated behaviors between voters in consolidated democracies and new democracies. The first go to the polls proportionately more than the latter and in an unexpected magnitude: the average difference rises to 17.6 points on the basis of voter turnout rates, and 11.9 points on the basis of votes! 2) While the growth of voter abstention is confirmed, our very wide-range audit belies at the same time the darkest pre- dictions and verdicts. At this stage, voters are not so impossible to find as some claim they are. Nearly seven out of ten, on av- erage, take part in national elections. Voter turnout remains a largely majority phenomenon in European democracies. How- ever, let us highlight two elements that qualify these results. First, our audit-work on elections has focused on those of the highest order. The clearly majority dimension of casting one’s vote is not supported in some second-order elections (Delwit, 2002). Finally (all authors point this out, and the 2007 French legislative election confirmed it), there is a specific problem in younger generations. There, abstention is particularly high. The perpetuation of behaviors defined as withdrawal from taking part in ballots could eventually change these conclusions. 3) The assumption that interest in, and the importance of, compulsory voting as an institutional constraint encouraging voter turnout is confirmed. Even though we were also able to isolate an increase in abstention in countries with compulsory voting, the fact is that voter turnout is substantially higher there than in States with non-mandatory vote. Of course, we also de- monstrated that the obligation to vote generates a (small) in- crease in invalid votes, which can eventually become assimi- lated to forms of abstention. But this surplus is still minimal. Adjusted voter turnout leads back to still significant differences in participation. The effectiveness of compulsory voting in rai- sing voter turnout has, from that point of view, been corrobo- rated. REFERENCES Ackaert, J., De Winter, L., Aish, A.-M., & Frognier, A.-P. (1992). L’abstentionnisme électoral et le vote blanc et nul en Belgique. Res Publica, XXXIV, 209-226. Andolfatto, D. (1992). Quand les abstentionnistes s’expriment. Revue politique et parlementaire, 960, 40-46. Copyright © 2013 SciRes. 51  P. DELWIT Blais, A. (2000). To vote or not to vote: The merits and limits of ra- tional choice theory. Pittsburgh: University of Pittsburgh Press. Blais, A., & Dobrzynska, A. (1998). Turnout in electoral democracies. European Journal of Political Resea rch, 33, 239-262. doi:10.1111/1475-6765.00382 Blais, A., & Carty, R. K. (1990). Does proportional representation fos- ter voter turnout? European Journal of Political Research, 18, 167- 181. doi:10.1111/j.1475-6765.1990.tb00227.x Blondel, J., Sinnott, R., & Svensson, P. (1997). Representation and voter participation. European Journal of Political Research, 32, 243- 272. doi:10.1111/1475-6765.00341 Bréchon, P. (2002). Comprendre les logiques d’abstention. Revue poli- tique et parlementaire, 1020-1 021, 83- 93. Bréchon, P. (1998). La France aux urnes. Cinquante ans d’histoire électorale. Paris: Les études de la Documentation Française. Brouard, S., & Tiberj, V. (2005). Français comme les autres? Enquête sur les citoyens d’origine maghrébine, africaine et turque. Paris: Presses de Sciences Po. Crepaz, M. (1990). The impact of party polarization and postmaterial- ism on voter turnout. European Journal of Political Research, 18, 183-205. doi:10.1111/j.1475-6765.1990.tb00228.x Delwit, P. (2011). Still in decline? Party membership in Europe. In E. van Haute, (Ed.), Party membership in Europe: Exploration into the anthills of party politics (pp. 25-42). Brussels: Editions de l’Univer- sité de Bruxelles. Delwit, P. (2002). Electoral participation and the European poll: A limited legitimacy. In P. Perrineau, G. Grunberg, & C. Ysmal (Eds.), Europe at the polls. The European Elections of 1999 (pp. 207-222). New York: Palgrave. Delwit, P., & Poirier, Ph. (2005). Parlement p uissant, électeurs absents. Les élections européennes de juin 2004. Brussels: Editions de l’Uni- versité de Bruxelles . Dolez, B. (2004). A la recherche de l’abstentionnisme différentiel. Actualité d’une vieille question. Revue Française de Science Politi- que, 54, 669-680. doi:10.3917/rfsp.544.0669 Duverger, M. (1992). Les partis politiques. Paris: Points-Seuil, Franklin, M. N. (1999). Electoral engineering and cross-national turn- out differences: What role for compulsory voting? British Journal of Political Science, 29, 205-224. doi:10.1017/S0007123499210095 Gallego, A. (2009). Where else does turnout decline come from? Edu- cation, age, generation and period effects in three European countries. Scandinavian Politi c a l S t u di e s , 32, 23- 44. doi:10.1111/j.1467-9477.2008.00212.x Héran, F. (2002). Voter toujours, parfois ou… jamais. In B. Cautrès, & N. Mayer (Eds.), Le nouveau désordre électoral. Les leçons du 21 avril 2002 (pp. 351-358). Paris: Presses de Sciences Po. Institute for Democracy and Electoral Assistance (2004). Voter turnout in Western Europe since 1945. A Regional Report. Stockholm: In- ternational IDEA. Institute for Democracy and Electoral Assistance (2004). Elections in the European Union. A comparative overview. Stockholm: IDEA. Kekic, L. (2007). The Economist Intelligence Unit’s index of democ- racy. In Democracy Index. The World in 2007. The Economist. Koepke, R., & Ringe, N. (2006). The second-order election model in an enlarged Europe. European Union Politics, 7, 321-346. doi:10.1177/1465116506066259 Kriesi, H. P. (2008). Political mobilisation, political participation and the power of vote. West European Politics, 31, 147-168. doi:10.1080/01402380701834762 Lancelot, A. (1968). L’abstentionnisme électoral en France. Paris: Presses de la Fondatio n Nationale des Sciences Politiques. Lijphart, A. (1997). Unequal participation: Democracy’s unresolved dilemma. American Political Science Review, 91, 1-14. doi:10.2307/2952255 Mackie, Th. T., & Rose, R. (1991). The international almanach of elec- toral history. London: MacMillan. Muxel, A. (2009). La participation électorale: Un déficit inégalé. Revue Internationale de Politique Comparée, 16, 569-581. doi:10.3917/ripc.164.0569 Muxel, A. (2007), La mobilisation électorale. L’envers de 2002 et un sursaut généralisé. Revue Française de Science Politique, 57, 315- 328. doi:10.3917/rfsp.573.0315 Narud, H. M., & Valen, H. (1996), Decline of electoral turnout: The case of Norway. European Journal of Political Research, 29, 235- 256. doi:10.1111/j.1475-6765.1996.tb00650.x Offerlé, M. (1999). Elections européennes. Des voix qui parlent: Les élections du 13 juin 1999 e n France. Regards sur l’actualité, 24-44. Pacek, A., & Radcliff, B. (1995). Turnout and the vote for left-or-centre parties: A cross-national analysis. British Journal of Political Science, 25, 137-143. doi:10.1017/S0007123400007109 Parodi, J.-L., (2004). Les élections « intermédiaires » du printemps 2004: Entre structure et événement. Revue française de science politique, 54, 533-543. doi:10.3917/rfsp.544.0533 Pattie, Ch., & Johnston, R. (2001). A low turnout landslide: Abstention at the British general election of 1997. Political Studies, 49, 286-305. doi:10.1111/1467-9248.00314 Purdam, K., Fieldhouse, E., Kalra, V., & Russell, A. (2002). Voter engagement among black and minority ethnic communities. Research Report. The Electoral Commission. Radcliff, B., & Davis, P. (2000). Labor organization and electoral par- ticipation in industrial democracies. American Journal of Political Science, 44, 132-141. doi:10.2307/2669299 Rallings, C., & Thrasher, M. (2005). Not all “second-order” contests are the same: Turnout and party choice at the concurrent 2004 local and European parliament elections in England. British Journal of Po- litical Science and International Relations, 7, 584-597. doi:10.1111/j.1467-856X.2005.00207.x Reif, K., & Schmitt, H. (1980). Nine second-order national elections: A conceptual framework for the analysis of European election results. European Journal of Political Resea rch, 8, 3-44. doi:10.1111/j.1475-6765.1980.tb00737.x Rose, R. (1997). Evaluating election turnout. In Voter turnout from 1945 to 1997: A global report on political participation. Stockholm: International IDEA. Siegfried, A. (2010). Tableau politique de la France de l’Ouest. Brus- sels: Editions de l’Université de Bruxelles. Swyngedouw, M., Boy, D., & Mayer, N. (2000). Mesures de la volati- lité électorale en France (1993-1997). Revue française de science politique, 50, 489-514. doi:10.3406/rfsp.2000.395485 Van Biezen, I., Mair, P., & Poguntke, Th. (2011). Going, going… gone? The decline of party membership in contemporary Europe. European Journal for Political Research, 51, 24-56. doi:10.1111/j.1475-6765.2011.01995.x Van Egmond, M., de Graaf, N., & Van Der Eijk, D. (1998). Electoral participation in the Netherlands: Individual and contextual influences. European Journal of Political Resea rch, 34, 281-300. Wattenberg, M. P. (2002). The decline of party mobilization. In J. Dal- ton Russell, & M. P. Wattenberg (Eds.), Parties without partisans political change in advanced industrial democracies (pp. 64-75). Ox- ford: Oxford University Press. doi:10.1111/1475-6765.00408 Copyright © 2013 SciRes. 52
|