 Vol.2, No.9, 1035-1043 (2010) Natural Science http://dx.doi.org/10.4236/ns.2010.29127 Copyright © 2010 SciRes. OPEN ACCESS Spectroscopic, thermal and magnetic properties of some transition metal complexes derived from 1-Phenyl-3-Substituted-4-Nitroso-5-Pyrazolones Samir A. Abdel-Latif1*, Yousry M. Issa2 1Chemistry Department, Faculty of Science, Helwan University, Helwan, Egypt; *Corresponding Author: salatif_1@yahoo.com 2Chemistry Department, Faculty of Science, Cairo University, Giza, Egypt Received 25 June 2010; revised 28 July 28 2010; accepted 5 August 2010. ABSTRACT Complexes derived from some 1-Phenyl-3-meth- yl-4-nitroso-5-pyrazolone (L1), 1,3-diphenyl-4- nitroso-5-pyrazolone (L2) and 1-phenyl-3-anilino- 4-nitroso-5-pyrazolone (L3) with Mn2+, Co2+, Ni2+, Cu2+ and Zn2+ metal ions have been prepared. Structural investigation of the ligands and their complexes has been made based on elemental analysis, infrared (FT-IR), ultraviolet and visible spectra (UV-Vis.), proton nuclear magnetic reso- nance (1H NMR), magnetic susceptibility (eff.) and thermal analysis (TG and DTG). The effect of solvents has been carried out in organic solvents of varying polarity. The observed tran- sition energy and oscillator strengths were also calculated. The data obtained show that all of the prepared complexes contain water mole- cules in their coordination sphere. The investi- gated ligands acts as neutral bidentate ligands bonded to the metal ions through the two oxy- gen atoms of the carbonyl and nitroso groups. The isolated complexes behave as non-electro- lyte in DMF solution. The Mn2+, Co2+, Ni2+ and Cu2+ complexes show high spin configurations as the ground state. The high spin values of ma- gnetic susceptibility may be due to the ligands being weak ligands. The Mn2+, Co2+, Ni2+, Cu2+ and Zn2+ complexes exhibit an octahedral or distorted octahedral coordination with the in- vestigated ligands. Keywords: Nitrosopyrazolones; Transition Metal Complexes; Spectroscopic; Thermal; Magnetic studies 1. INTRODUCTION Pyrazolones and their pyrazol derivatives are formed by the reaction between hydrazines and -keto esters e.g. 3-methy-1-phenylpyrazolone was prepared from phenyl- hydrazine and ethyl acetoacetate. This on methylation gives antipyrine which is used in medicine as an antipy- retic [1]. Nitrosopyrazolones are used as analytical re- agents. Pyrazolone derivatives are capable of forming complexes with a large number of transition metal ions [2-5]. The formed complexes are characterized by their high stability due to the formation of six-membered rings. 4-Nitroso-2-pyrazolin-5-one derivatives have sig- nificant activity against Pyricularia oryzae [6,7]. Com- plexation behaviour of 4-hydroxy-2,2,6,6-tetramethylpi- pridine-1-oxyl, oximido-benzotetronic acid and 4-nitroso- 3-methyl-1-phenyl-2-pyrazoline-5-one each containing the same NO coordination group was complexed with some transition metal ions [8]. 1,3-Dimethyl-4-nitrosopy- razol-5-ol dissolved in methanol or DMSO together with small amount of H2O2 gives rise to nitroxide radicals when irradiated by UV light [9]. Nitrosation at C-4 of 1-n-alkyl-3-methyl-5-pyrazolone was achieved with so- dium nitrite in hydrochloric acid medium. A tautomeric equilibrium in solution with a proton moving from OH at C-5 to nitrosated pyrazolones was proposed [10]. The structure and relative stabilities of the tautomers and isomers of 4-nitroso-pyrazolones were investigated at HF, DFT and MPn (n = 2, 4) quantum chemical levels. 1H, 13C and 15N NMR chemical shielding and coupling constants were calculated [11]. The present study deals with the preparation of Mn2+ , Co2+, Ni2+, Cu2+ and Zn2+ complexes with the investi- gated ligands (L1-L3). The complexes obtained were subjected to many analytical tools such as elemental analysis, infrared (FT-IR), thermogravimetric (TG) and derivative thermogravimetric analysis (DTG), molar conductance, magnetic susceptibility (eff.) and elec- tronic spectra to throw some light on the bonds formed and on their structure.  S. A. Abdel-Latif et al. / Natural Science 2 (2010) 1035-1043 Copyright © 2010 SciRes. OPEN ACCESS 1036 2. EXPERIMENTAL All chemicals used in this work were chemically pure, obtained from BDH chemicals. They include MnCl2. 4H2O, CoCl2.6H2O, NiCl2.6H2O, CuCl2.2H2O and ZnCl2, NH4OH, sodium nitrite, ethyl acetoacetate, phenylhy- drazine, ethyl benzoylacetate, 1-phenyl-3-amino-5-pyra- zolone, aniline, sodium ethoxide, ethyl cyanoacetate. The solvents used were methanol, ethanol, deutrated dimethyl sulfoxide (d6-DMSO), dimethyl formamide (DMF), chl- oroform, cyclohexane, isopropanol, dioxane, hydrochlo- ric acid and sodium hydroxide. 2.1. Synthesis of the Ligands The 1-phenyl-3-methyl-5-pyrazolone was prepared from ethyl acetoacetate and phenylhydrazine according to the method described by Vogel [12], m.p. 127℃. 1,3-Dip- henyl-5-pyrazolone was prepared from ethyl benzoy- lacetate and phenylhydrazine [12]. 1-Phenyl-3-anilino- 5-pyrazolone was obtained by the method described by Weissberger [13] from a mixture of 1-phenyl-3-amino-5- pyrazolone and aniline, m.p. 221℃. The investigated ligands were prepared [14] as follows, the nitrosation reactions were carried out by acidifying the cold aqueous solution of 1-phenyl-3-substituted-5-pyrazolone deriva- tives (0.1 mol) at 0℃ in sodium hydroxide solution con- taining equivalent amount of sodium nitrite (0.1 mol) with hydrochloric acid. The precipitated ligands were filtered off, washed several times with water and recrys- tallized from ethanol. The purity of the compounds was determined from the results of elemental analysis and are summarized in Table 1, IR and 1H NMR spectra. The resulting ligands have the following general formulae: R N NO NO where R = CH3-, (1-phenyl-3-methyl-4-nitroso-5-pyra- zolone), (L1) R = C6H5-, (1,3-diphenyl-4-nitroso-5-pyrazolone), (L2) R = C6H5-NH-, (1-phenyl-3-anilino-4-nitroso-5-pyrazo- lone), (L3) 2.2. Synthesis of the Complexes The 1:1 or 1:2 complexes were prepared by mixing a hot alcoholic solution of the investigated ligands (0.001 or 0.002 mol) with the calculated (0.001 mol) of metal salt solution. The reaction mixture was refluxed for 4 h. The pH of the solution was maintained at a value of 5.0-6.0 by the addition of dilute ammonia solution (1:10). The solid complexes were dried on a steam bath with stirring, then filtered off and washed several times with etha- nol-water mixture, (1:1 v/v) till a colorless filtrate was obtained. The solid complexes were dried by suction and finally kept in vacuum desiccators. 2.3. Physical Measurements The FT-IR spectra were recorded in the range 4000-400 cm-1 on a Jasco FT-IR spectrophotometer as KBr discs. The NMR spectra were measured using Varian Gemini 200-200 MHz spectrometer and the spectra were re- corded from 0-15 ppm using TMS as an internal stan- dard in dimethylsulfoxide (d6-DMSO) as the solvent. Thermal analyses (TG and DTG) were obtained in a nitrogen atmosphere using a type TGA 50 of Shimadzu derivatograph thermal analyzer. The molar conductivi- ties were carried out using a Jenway 4310 conductivity meter. Electronic spectra were recorded in the range 200-800 nm, on Jasco V-530 UV-Vis. spectrophotometer. Magnetic susceptibility values were obtained at room temperature using magnetic susceptibility balance (Sher- wood scientific), Cambridge Science Park, Cambridge, England. 3. RESULTS AND DISCUSSION 3.1. Characterization of the Ligands The structures of the investigated ligands (L1-L3) were established by the use of elemental analysis in Table 1, IR, UV-Vis and 1H NMR spectra. 3.1.1. Infrared Studies The infrared spectra of the investigated ligands and the most important IR band assignments that affect the structural features are listed in Table 2. The NH ap- pears as a medium broad one at 3210 cm-1 for ligand L3. The band appearing at 1705, 1678 and 1688 cm-1 are ascribed to the stretching frequency of the C=O group for ligands L1-L3, respectively. The band observed within the range 1410-1359 cm-1 assigned to N = O [14]. 3.1.2. 1H NMR Spectra The different types of protons in DMSO of the investi- gated ligands (L1-L3) were obtained. The spectra of the ligands L1-L3 exhibit a sharp singlet signal at 2.23 ppm. This signal is assigned to the aliphatic proton at position number 4 [15,16] as shown in Figure:  S. A. Abdel-Latif et al. / Natural Science 2 (2010) 1035-1043 Copyright © 2010 SciRes. OPEN ACCESS 103 1037 Table 1. Elemental analyses and magnetic moments for Mn2+, Co2+, Ni2+, Cu2+ and Zn2+ complexes with the investigated ligands (L1-L3). Ligands and Complexes Tentative Formula M:L m.p℃ C H % Calculated N (found) Cl M eff. L1 C10H9N3O2 -- 155 59.11 (59.3) 4.43(4,2) 20.68 (20.4)-- -- -- L2 C15H11N3O2 -- 235 67.64 (67.8) 4.15 (4.5) 15.84 (15.6)-- -- -- L3 C15H12N4O2 -- 241 64.28 (64.2 4.24 (4.3) 20.00 (19.8)-- -- -- Mn-L1 [MnC10H21N3O8Cl2] 1:1 325 27.52 (27.5) 4.81 (4.3) 9.63 (9.4) 16.05 (16.3) 12.59 (13.0)5.94 Mn-(L1)2 [MnC20H20N6O6] 1:2 330 48.49 (48.2) 4.04 (3.9) 16.97 (17.2)-- 11.09 (10.8)5.86 Co-L1 [CoC10H15N3O5Cl2] 1:1 345 31.09 (30.9) 3.88 (3.7) 10.88 (11.1)18.13 (18.5) 15.26 (14.9)3.91 Co-(L1)2 [CoC20H24N6O8] 1:2 344 44.86 (44.4) 4.48 (4.5) 15.70 (15.9)-- 11.01 (10.9)3.98 Ni-L1 [NiC10H29N3O12Cl2] 1:1 343 23.45 (23.2) 5.66 (5.8) 8.20 (8.4) 13.67 (13.8) 11.47 (11.1)3.12 Ni-(L1)2 [NiC20H22N6O7] 1:2 335 46.44 (46.4) 4.25 (4.1) 16.25 (16.2)-- 11.36 (11.4)3.10 Cu-L1 [CuC10H17N3O6Cl2] 1:1 305 29.37(28.9) 4.16 (4.3) 10.28 (10.4)17.13 (16.9) 15.54 (15.8)1.99 Cu-(L1)2 [CuC20H26N6O9] 1:2 343 43.04 (43.2) 4.66 (4.2) 15.06 (15.2)-- 11.39 (11.5)2.10 Zn-L1 [ZnC10H15N3O5Cl2] 1:1 335 30.58 (30.7) 3.82 (3.9) 10.70 (10.9)17.83 (17.9) 16.66 (16.8)-- Zn-(L1)2 [ZnC20H22N6O7] 1:2 355 45.85 (45.9) 4.20 (4.1) 16.04 (16.3)-- 12.49 (12.8)-- Mn-L2 [MnC15H19N3O6Cl2] 1:1 342 38.96 (38.5) 4.11( 4.0) 9.09 (8.9) 15.15 (15.3) 11.88 (11.7)5.84 Mn-(L2)2 [MnC30H28N6O8] 1:2 320 54.97 (55.1) 4.27 (4.4) 12.82 (12.8)-- 8.38 (8.6) 5.66 Co-L2 [CoC15H17N3O5Cl2] 1:1 328 40.18 (40.4) 3.97 (3.6) 9.37 (9.2) 15.62 (15.4) 13.15 (12.8)3.81 Co-(L2)2 [CoC30H28N6O8] 1:2 335 54.63 (54.6) 4.24 (4.4) 12.74 (12.5)-- 8.93 (8.7) 3.78 Ni-L2 [NiC15H17N3O5Cl2] 1:1 350 40.20 (40.6) 3.79 (3.9) 9.38 (9.5) 15.63 (15.7) 13.11 (13.4)2.99 Ni-(L2)2 [NiC30H28N6O8] 1:2 337 54.65 (54.7) 4.25 (4.4) 12.75 (13.1)-- 8.91 (8.6) 3.00 Cu-L2 [CuC15H17N3O5Cl2] 1:1 281 39.77 (39.8) 3.75 (3.9) 9.28 (9.4) 15.46 (15.7) 14.03 (14.4)2.05 Cu-(L2)2 [CuC30H26N6O7] 1:2 290 55.77 (55.4) 4.02 (4.1) 13.01 (13.1)-- 9.83 (9.9) 1.98 Zn-L2 [ZnC15H17N3O5Cl2] 1:1 355 39.61 (39.4) 3.74 (3.8) 9.24 ( 9.4) 15.40 (15.6) 14.39 (14.5)-- Zn-(L2)2 [ZnC30H28N6O8] 1:2 334 54.10 (54.3) 4.20 (4.3) 12.62 (12.7)-- 9.82 (9.7) -- Mn-L3 [MnC15H28N4O10Cl2] 1:1 341 32.79 (32.6) 5.10 (5.3) 10.20 (9.9) 12.75 (13.2) 10.00 (9.8) 5.74 Mn-(L3)2 [MnC30H30N8O8] 1:2 327 52.56 (52.6) 4.38 (4.9) 16.35 (17.2)-- 8.01 (7.82 5.86 Co-L3 [CoC15H20N4O6Cl2] 1:1 348 37.42 (37.7) 4.15 (4.3) 11.64 (11.9)14.55 (14.8) 12.24 (12.4)3.87 Co-(L3)2 [CoC30H26N8O5Cl2] 1:2 345 50.92 (50.6) 3.67 (3.4) 15.84 (15.9)9.90 (9.8) 8.33 (8.1) 3.91 Ni-L3 [NiC15H16N4O4Cl2] 1:1 345 40.47 (40.3) 3.59 (3.3) 12.59 (13.4)15.74 (16.3) 13.19 (12.7)2.90 Ni-(L3)2 [NiC30H36N8O10Cl2] 1:2 335 45.18 (45.6) 4.51 (4.6) 14.05 (13.9)8.78 (9.5) 7.36 (6.9) 2.88 Cu-L3 [CuC15H16N4O4Cl2] 1:1 295 40.04 (40.6)3.55 (3.9) 12.45 (12.8)15.57 (15.2) 14.12 (14.3)1.99 Cu-(L3)2 [CuC30H28N8O7] 1:2 306 53.29 (53.4) 4.14 (4.3) 16.58 16.7) -- 9.40 (9.7) 1.84 Zn-L3 [ZnC15H16N4O4Cl2] 1:1 338 39.87 (40.3) 3.54 (3.6) 12.40 (11.9)15.50 (15.3) 14.48 (15.0)-- Zn-(L3)2 [ZnC30H30N8O8] 1:2 357 51.76 (51.6) 4.31 (4.2) 16.10 (16.4)-- 9.40 (9.5) --  S. A. Abdel-Latif et al. / Natural Science 2 (2010) 1035-1043 Copyright © 2010 SciRes. OPEN ACCESS 1038 Table 2. IR band assignments for the investigated ligands (L1-L3). L1 L2 L3 Band assignment -- -- 3210 m NH 3050 m 3048 m 3070 m CH 1705 w 1678 w 1688 w C=O 1652 m 1595 m 1629 m C=N 1499 m 1493 m 1494 m C=C 1410 s 1414 s 1395 s N=O R 1 2 34 5 N NO NO H For ligand L1, a singlet observed at 2.40 ppm is as- signed to CH3 protons (the integration curve shows three protons). The signals observed at 7.23-7.84, 7.20-8.17 and 7.03-7.87 ppm are assigned to the aromatic hydro- gen protons (the integration curve shows five and ten protons for the investigated ligands L1-L3, respectively). The spectrum of ligand L3 exhibits a singlet signal ob- served at 6.43 ppm is assigned to NH proton (the inte- gration curve shows one proton). 3.1.3. Electronic Spectral Studies The electronic spectral band of the investigated ligands scanned in different organic solvents are depicted in Ta- ble 3. In methanol solution, ligands L1 and L2 show three bands, the first one at 253-268 nm referred to -* transition within the phenyl rings. The second band ob- served at 317-321 nm is ascribed to n-* transition of the carbonyl group. The third band at 385-400 nm arises from a transition involving electron migration along the entire conjugate system of the ligand i.e. comprises charge transfer (CT) from phenyl ring to the carbonyl group by resonance and from hetero ring by induction [17]. In case of chloroform, cyclohexane, isopropanol and dioxane, the spectra show two bands within the range 260-423 nm. The first band at 260-263 nm is as- signed to -* transition within the phenyl rings. The second band at 403-423 nm is ascribed to charge transfer interaction from the phenyl ring to the carbonyl group. For ligand L3 only one absorption band observed at 248-259 nm which may be ascribed to the high energy -* transition within the phenyl rings. The ionization potential (Ip) of the investigated ligands (L1-L3) is calculated from their electronic spec- tral data applying the relationships previously applied [18-20]. The value of the experimental transition ener- gies (ECT) and oscillator strengths (f) were calculated from max of the electronic spectra applying the equa- tions previously reported [18-20]. The calculated ECT values, as well as, the correspond- ing ionization potential (Ip) of the investigated ligands L1-L3 in different organic solvents are listed in Table 3. The variation in Ip values was found to follow the same order as max of the CT band. 3.2. Characterization of the Complexes The solid complexes were subjected to elemental analy- sis and metal content, infrared (FT-IR), ultraviolet and visible spectra (UV-Vis.), magnetic susceptibility (eff.) and thermal analysis. The results of elemental analysis are given in Table 1 and are in good agreement with those calculated by the proposed formulae for 1:1 and 1:2 (M:L) solid complexes. 3.2.1. Conductimetric Measurements Conductimetric titrations of Mn2+, Co2+, Ni2+, Cu2+ and Zn2+ metal ions with the investigated nitrosopyrazolone derivatives (L1-L3) were obtained by plotting the calcu- lated molar ratio [L]/[M] against the corrected molar conductance values. The results indicate that the con- ductance increases with the addition of the metal ion solution due to the release of the highly conducting hy- drogen ions which may be present in nitroso-oxime tautomers as a result of chelation [10,16]. The titration curves show the presence of two distinctive breaks at metal to ligand 1:1 and 1:2 (M:L), respectively. The prepared solid complexes of Mn2+, Co2+, Ni2+, Cu2+ and Zn2+ metal ions with the investigated ligands (L1-L3) were subjected to elemental analysis for their C, H, N, Cl and metal content [21], infrared (FT-IR), ultra- violet and visible spectra (UV-Vis.), magnetic suscepti- bility (eff.) and thermal analysis. 3.2.2. Infrared Studies Infrared spectral data of the investigated complexes dis- play interesting changes which may give a reasonable idea about these complexes. However, if these changes were interpreted in relation to elemental analysis in Ta- ble 1, also the thermogravimetric analysis, molar con- ductance, electronic spectra and magnetic susceptibility measurements, the structure of the solid complexes may be clarified. In the spectra of the complexes (Table 4) the band observed within the range 1410-1395 cm-1 [14] assigned to N=O in the free ligands shiftes to lower wave num- 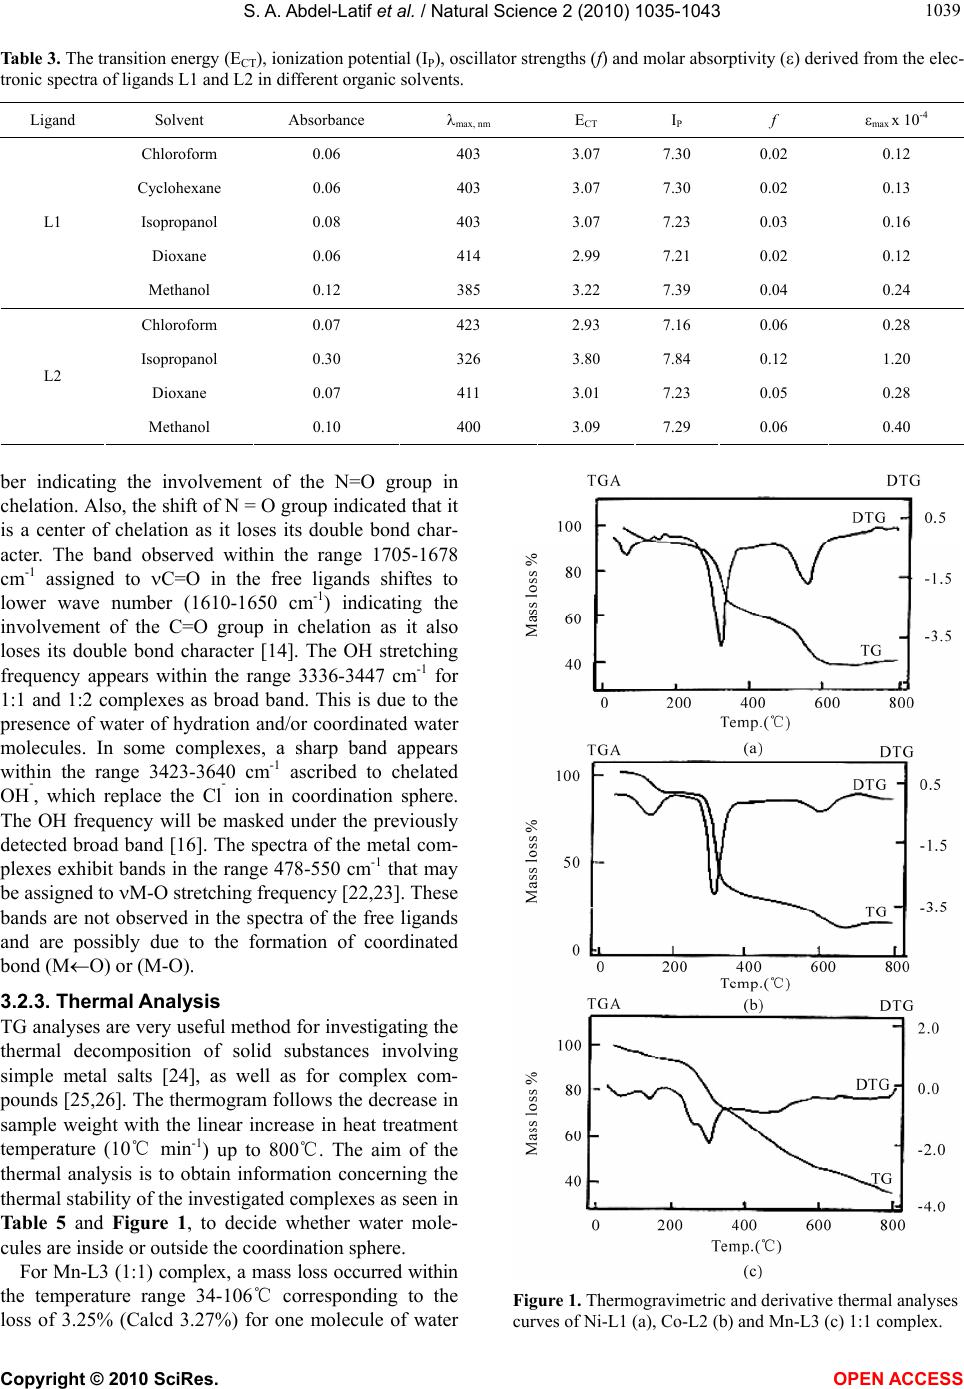 S. A. Abdel-Latif et al. / Natural Science 2 (2010) 1035-1043 Copyright © 2010 SciRes. OPEN ACCESS 103 1039 Table 3. The transition energy (ECT), ionization potential (IP), oscillator strengths (f) and molar absorptivity () derived from the elec- tronic spectra of ligands L1 and L2 in different organic solvents. Ligand Solvent Absorbance max, nm ECT I P f max x 10-4 Chloroform 0.06 403 3.07 7.30 0.02 0.12 Cyclohexane 0.06 403 3.07 7.30 0.02 0.13 Isopropanol 0.08 403 3.07 7.23 0.03 0.16 Dioxane 0.06 414 2.99 7.21 0.02 0.12 L1 Methanol 0.12 385 3.22 7.39 0.04 0.24 Chloroform 0.07 423 2.93 7.16 0.06 0.28 Isopropanol 0.30 326 3.80 7.84 0.12 1.20 Dioxane 0.07 411 3.01 7.23 0.05 0.28 L2 Methanol 0.10 400 3.09 7.29 0.06 0.40 ber indicating the involvement of the N=O group in chelation. Also, the shift of N = O group indicated that it is a center of chelation as it loses its double bond char- acter. The band observed within the range 1705-1678 cm-1 assigned to C=O in the free ligands shiftes to lower wave number (1610-1650 cm-1) indicating the involvement of the C=O group in chelation as it also loses its double bond character [14]. The OH stretching frequency appears within the range 3336-3447 cm-1 for 1:1 and 1:2 complexes as broad band. This is due to the presence of water of hydration and/or coordinated water molecules. In some complexes, a sharp band appears within the range 3423-3640 cm-1 ascribed to chelated OH-, which replace the Cl- ion in coordination sphere. The OH frequency will be masked under the previously detected broad band [16]. The spectra of the metal com- plexes exhibit bands in the range 478-550 cm-1 that may be assigned to M-O stretching frequency [22,23]. These bands are not observed in the spectra of the free ligands and are possibly due to the formation of coordinated bond (MO) or (M-O). 3.2.3. Thermal Analysis TG analyses are very useful method for investigating the thermal decomposition of solid substances involving simple metal salts [24], as well as for complex com- pounds [25,26]. The thermogram follows the decrease in sample weight with the linear increase in heat treatment temperature (10℃ min-1) up to 800℃. The aim of the thermal analysis is to obtain information concerning the thermal stability of the investigated complexes as seen in Table 5 and Figure 1, to decide whether water mole- cules are inside or outside the coordination sphere. For Mn-L3 (1:1) complex, a mass loss occurred within the temperature range 34-106℃ corresponding to the loss of 3.25% (Calcd 3.27%) for one molecule of water Figure 1. Thermogravimetric and derivative thermal analyses curves of Ni-L1 (a), Co-L2 (b) and Mn-L3 (c) 1:1 complex. 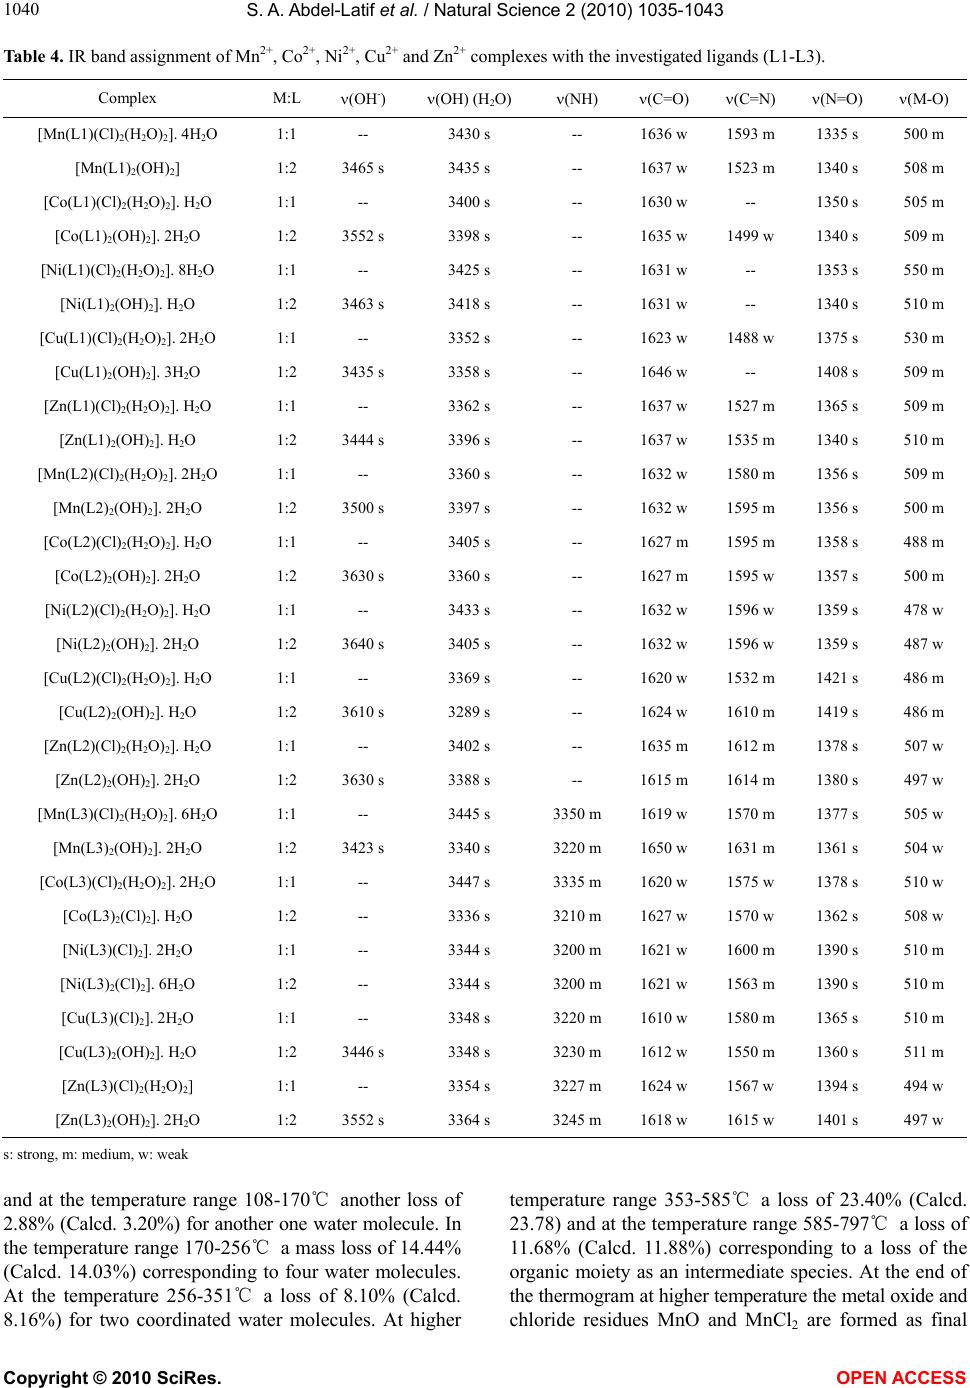 S. A. Abdel-Latif et al. / Natural Science 2 (2010) 1035-1043 Copyright © 2010 SciRes. OPEN ACCESS 1040 Table 4. IR band assignment of Mn2+, Co2+, Ni2+, Cu2+ and Zn2+ complexes with the investigated ligands (L1-L3). Complex M:L (OH-) (OH) (H2O) (NH) (C=O) (C=N) (N=O) (M-O) [Mn(L1)(Cl)2(H2O)2]. 4H2O 1:1 -- 3430 s -- 1636 w 1593 m 1335 s 500 m [Mn(L1)2(OH)2] 1:2 3465 s 3435 s -- 1637 w 1523 m 1340 s 508 m [Co(L1)(Cl)2(H2O)2]. H2O 1:1 -- 3400 s -- 1630 w -- 1350 s 505 m [Co(L1)2(OH)2]. 2H2O 1:2 3552 s 3398 s -- 1635 w 1499 w 1340 s 509 m [Ni(L1)(Cl)2(H2O)2]. 8H2O 1:1 -- 3425 s -- 1631 w -- 1353 s 550 m [Ni(L1)2(OH)2]. H2O 1:2 3463 s 3418 s -- 1631 w -- 1340 s 510 m [Cu(L1)(Cl)2(H2O)2]. 2H2O 1:1 -- 3352 s -- 1623 w 1488 w 1375 s 530 m [Cu(L1)2(OH)2]. 3H2O 1:2 3435 s 3358 s -- 1646 w -- 1408 s 509 m [Zn(L1)(Cl)2(H2O)2]. H2O 1:1 -- 3362 s -- 1637 w 1527 m 1365 s 509 m [Zn(L1)2(OH)2]. H2O 1:2 3444 s 3396 s -- 1637 w 1535 m 1340 s 510 m [Mn(L2)(Cl)2(H2O)2]. 2H2O 1:1 -- 3360 s -- 1632 w 1580 m 1356 s 509 m [Mn(L2)2(OH)2]. 2H2O 1:2 3500 s 3397 s -- 1632 w 1595 m 1356 s 500 m [Co(L2)(Cl)2(H2O)2]. H2O 1:1 -- 3405 s -- 1627 m 1595 m 1358 s 488 m [Co(L2)2(OH)2]. 2H2O 1:2 3630 s 3360 s -- 1627 m 1595 w 1357 s 500 m [Ni(L2)(Cl)2(H2O)2]. H2O 1:1 -- 3433 s -- 1632 w 1596 w 1359 s 478 w [Ni(L2)2(OH)2]. 2H2O 1:2 3640 s 3405 s -- 1632 w 1596 w 1359 s 487 w [Cu(L2)(Cl)2(H2O)2]. H2O 1:1 -- 3369 s -- 1620 w 1532 m 1421 s 486 m [Cu(L2)2(OH)2]. H2O 1:2 3610 s 3289 s -- 1624 w 1610 m 1419 s 486 m [Zn(L2)(Cl)2(H2O)2]. H2O 1:1 -- 3402 s -- 1635 m 1612 m 1378 s 507 w [Zn(L2)2(OH)2]. 2H2O 1:2 3630 s 3388 s -- 1615 m 1614 m 1380 s 497 w [Mn(L3)(Cl)2(H2O)2]. 6H2O 1:1 -- 3445 s 3350 m 1619 w 1570 m 1377 s 505 w [Mn(L3)2(OH)2]. 2H2O 1:2 3423 s 3340 s 3220 m 1650 w 1631 m 1361 s 504 w [Co(L3)(Cl)2(H2O)2]. 2H2O 1:1 -- 3447 s 3335 m 1620 w 1575 w 1378 s 510 w [Co(L3)2(Cl)2]. H2O 1:2 -- 3336 s 3210 m 1627 w 1570 w 1362 s 508 w [Ni(L3)(Cl)2]. 2H2O 1:1 -- 3344 s 3200 m 1621 w 1600 m 1390 s 510 m [Ni(L3)2(Cl)2]. 6H2O 1:2 -- 3344 s 3200 m 1621 w 1563 m 1390 s 510 m [Cu(L3)(Cl)2]. 2H2O 1:1 -- 3348 s 3220 m 1610 w 1580 m 1365 s 510 m [Cu(L3)2(OH)2]. H2O 1:2 3446 s 3348 s 3230 m 1612 w 1550 m 1360 s 511 m [Zn(L3)(Cl)2(H2O)2] 1:1 -- 3354 s 3227 m 1624 w 1567 w 1394 s 494 w [Zn(L3)2(OH)2]. 2H2O 1:2 3552 s 3364 s 3245 m 1618 w 1615 w 1401 s 497 w s: strong, m: medium, w: weak and at the temperature range 108-170℃ another loss of 2.88% (Calcd. 3.20%) for another one water molecule. In the temperature range 170-256℃ a mass loss of 14.44% (Calcd. 14.03%) corresponding to four water molecules. At the temperature 256-351℃ a loss of 8.10% (Calcd. 8.16%) for two coordinated water molecules. At higher temperature range 353-585℃ a loss of 23.40% (Calcd. 23.78) and at the temperature range 585-797℃ a loss of 11.68% (Calcd. 11.88%) corresponding to a loss of the organic moiety as an intermediate species. At the end of the thermogram at higher temperature the metal oxide and chloride residues MnO and MnCl2 are formed as final 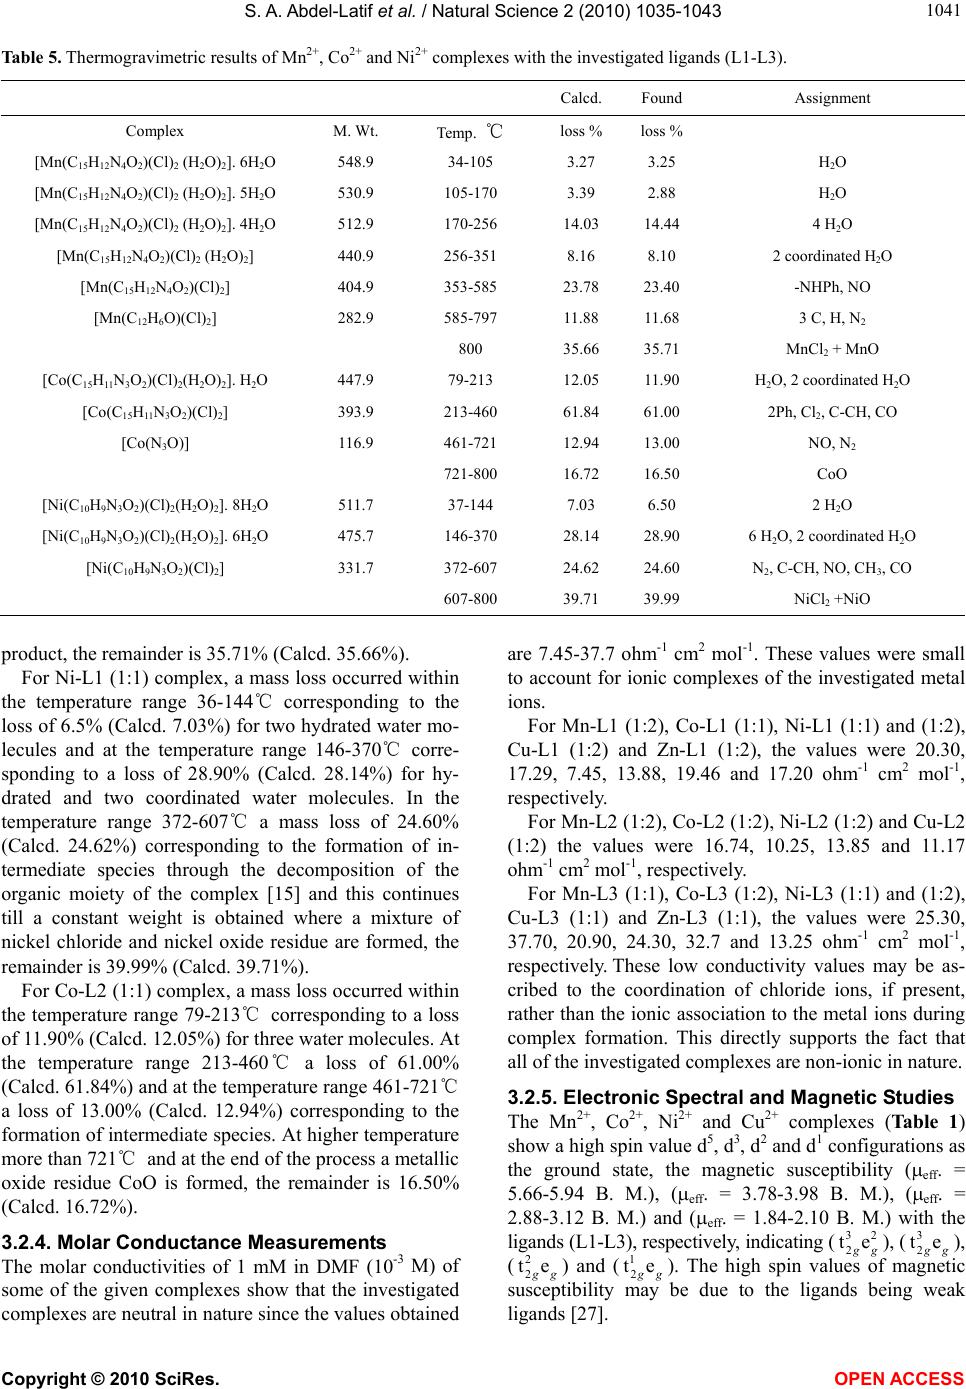 S. A. Abdel-Latif et al. / Natural Science 2 (2010) 1035-1043 Copyright © 2010 SciRes. OPEN ACCESS 104 1041 Table 5. Thermogravimetric results of Mn2+, Co2+ and Ni2+ complexes with the investigated ligands (L1-L3). Calcd. Found Assignment Complex M. Wt. Temp. ℃ loss % loss % [Mn(C15H12N4O2)(Cl)2 (H2O)2]. 6H2O 548.9 34-105 3.27 3.25 H2O [Mn(C15H12N4O2)(Cl)2 (H2O)2]. 5H2O 530.9 105-170 3.39 2.88 H2O [Mn(C15H12N4O2)(Cl)2 (H2O)2]. 4H2O 512.9 170-256 14.03 14.44 4 H2O [Mn(C15H12N4O2)(Cl)2 (H2O)2] 440.9 256-351 8.16 8.10 2 coordinated H2O [Mn(C15H12N4O2)(Cl)2] 404.9 353-585 23.78 23.40 -NHPh, NO [Mn(C12H6O)(Cl)2] 282.9 585-797 11.88 11.68 3 C, H, N2 800 35.66 35.71 MnCl2 + MnO [Co(C15H11N3O2)(Cl)2(H2O)2]. H2O 447.9 79-213 12.05 11.90 H2O, 2 coordinated H2O [Co(C15H11N3O2)(Cl)2] 393.9 213-460 61.84 61.00 2Ph, Cl2, C-CH, CO [Co(N3O)] 116.9 461-721 12.94 13.00 NO, N2 721-800 16.72 16.50 CoO [Ni(C10H9N3O2)(Cl)2(H2O)2]. 8H2O 511.7 37-144 7.03 6.50 2 H2O [Ni(C10H9N3O2)(Cl)2(H2O)2]. 6H2O 475.7 146-370 28.14 28.90 6 H2O, 2 coordinated H2O [Ni(C10H9N3O2)(Cl)2] 331.7 372-607 24.62 24.60 N2, C-CH, NO, CH3, CO 607-800 39.71 39.99 NiCl2 +NiO product, the remainder is 35.71% (Calcd. 35.66%). For Ni-L1 (1:1) complex, a mass loss occurred within the temperature range 36-144℃ corresponding to the loss of 6.5% (Calcd. 7.03%) for two hydrated water mo- lecules and at the temperature range 146-370℃ corre- sponding to a loss of 28.90% (Calcd. 28.14%) for hy- drated and two coordinated water molecules. In the temperature range 372-607℃ a mass loss of 24.60% (Calcd. 24.62%) corresponding to the formation of in- termediate species through the decomposition of the organic moiety of the complex [15] and this continues till a constant weight is obtained where a mixture of nickel chloride and nickel oxide residue are formed, the remainder is 39.99% (Calcd. 39.71%). For Co-L2 (1:1) complex, a mass loss occurred within the temperature range 79-213℃ corresponding to a loss of 11.90% (Calcd. 12.05%) for three water molecules. At the temperature range 213-460℃ a loss of 61.00% (Calcd. 61.84%) and at the temperature range 461-721℃ a loss of 13.00% (Calcd. 12.94%) corresponding to the formation of intermediate species. At higher temperature more than 721℃ and at the end of the process a metallic oxide residue CoO is formed, the remainder is 16.50% (Calcd. 16.72%). 3.2.4. Molar Conductance Measurements The molar conductivities of 1 mM in DMF (10-3 M) of some of the given complexes show that the investigated complexes are neutral in nature since the values obtained are 7.45-37.7 ohm-1 cm2 mol-1. These values were small to account for ionic complexes of the investigated metal ions. For Mn-L1 (1:2), Co-L1 (1:1), Ni-L1 (1:1) and (1:2), Cu-L1 (1:2) and Zn-L1 (1:2), the values were 20.30, 17.29, 7.45, 13.88, 19.46 and 17.20 ohm-1 cm2 mol-1, respectively. For Mn-L2 (1:2), Co-L2 (1:2), Ni-L2 (1:2) and Cu-L2 (1:2) the values were 16.74, 10.25, 13.85 and 11.17 ohm-1 cm2 mol-1, respectively. For Mn-L3 (1:1), Co-L3 (1:2), Ni-L3 (1:1) and (1:2), Cu-L3 (1:1) and Zn-L3 (1:1), the values were 25.30, 37.70, 20.90, 24.30, 32.7 and 13.25 ohm-1 cm2 mol-1, respectively. These low conductivity values may be as- cribed to the coordination of chloride ions, if present, rather than the ionic association to the metal ions during complex formation. This directly supports the fact that all of the investigated complexes are non-ionic in nature. 3.2.5. Electronic Spectral and Magnetic Studies The Mn2+, Co2+, Ni2+ and Cu2+ complexes (Table 1) show a high spin value d5, d3, d2 and d1 configurations as the ground state, the magnetic susceptibility (eff. = 5.66-5.94 B. M.), (eff. = 3.78-3.98 B. M.), (eff. = 2.88-3.12 B. M.) and (eff. = 1.84-2.10 B. M.) with the ligands (L1-L3), respectively, indicating (32 2 te g), (3 2 te g), (2 2 te g) and (1 2 te g). The high spin values of magnetic susceptibility may be due to the ligands being weak ligands [27]. 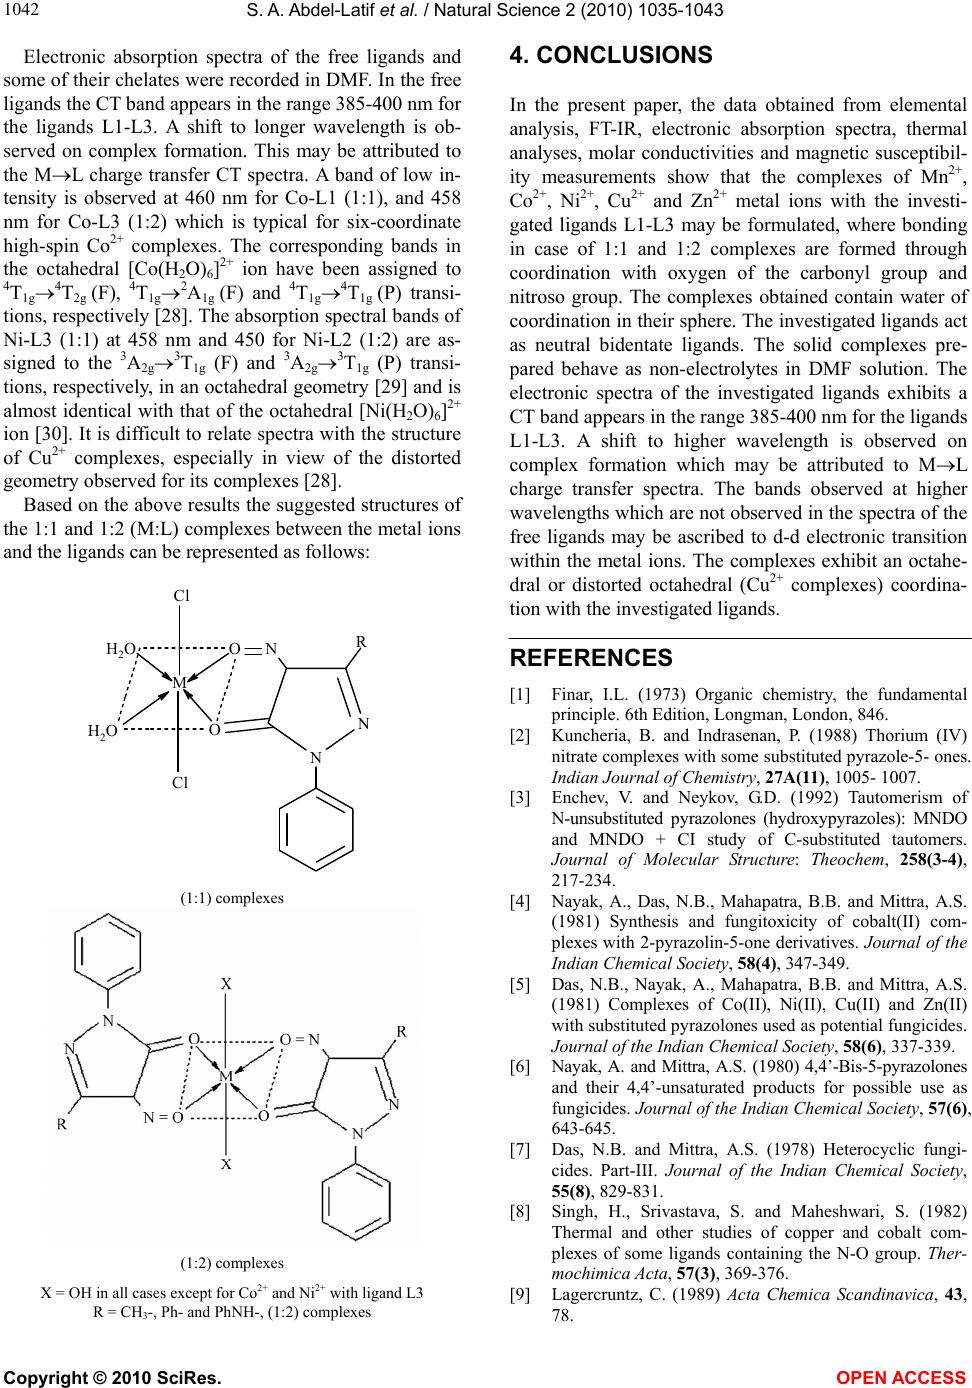 S. A. Abdel-Latif et al. / Natural Science 2 (2010) 1035-1043 Copyright © 2010 SciRes. OPEN ACCESS 1042 Electronic absorption spectra of the free ligands and some of their chelates were recorded in DMF. In the free ligands the CT band appears in the range 385-400 nm for the ligands L1-L3. A shift to longer wavelength is ob- served on complex formation. This may be attributed to the ML charge transfer CT spectra. A band of low in- tensity is observed at 460 nm for Co-L1 (1:1), and 458 nm for Co-L3 (1:2) which is typical for six-coordinate high-spin Co2+ complexes. The corresponding bands in the octahedral [Co(H2O)6]2+ ion have been assigned to 4T1g4T2g (F), 4T1g2A1g (F) and 4T1g4T1g (P) transi- tions, respectively [28]. The absorption spectral bands of Ni-L3 (1:1) at 458 nm and 450 for Ni-L2 (1:2) are as- signed to the 3A2g3T1g (F) and 3A2g3T1g (P) transi- tions, respectively, in an octahedral geometry [29] and is almost identical with that of the octahedral [Ni(H2O)6]2+ ion [30]. It is difficult to relate spectra with the structure of Cu2+ complexes, especially in view of the distorted geometry observed for its complexes [28]. Based on the above results the suggested structures of the 1:1 and 1:2 (M:L) complexes between the metal ions and the ligands can be represented as follows: M Cl Cl R H2O H2O N N O NO (1:1) complexes (1:2) complexes X = OH in all cases except for Co2+ and Ni2+ with ligand L3 R = CH3-, Ph- and PhNH-, (1:2) complexes 4. CONCLUSIONS In the present paper, the data obtained from elemental analysis, FT-IR, electronic absorption spectra, thermal analyses, molar conductivities and magnetic susceptibil- ity measurements show that the complexes of Mn2+, Co2+, Ni2+, Cu2+ and Zn2+ metal ions with the investi- gated ligands L1-L3 may be formulated, where bonding in case of 1:1 and 1:2 complexes are formed through coordination with oxygen of the carbonyl group and nitroso group. The complexes obtained contain water of coordination in their sphere. The investigated ligands act as neutral bidentate ligands. The solid complexes pre- pared behave as non-electrolytes in DMF solution. The electronic spectra of the investigated ligands exhibits a CT band appears in the range 385-400 nm for the ligands L1-L3. A shift to higher wavelength is observed on complex formation which may be attributed to ML charge transfer spectra. The bands observed at higher wavelengths which are not observed in the spectra of the free ligands may be ascribed to d-d electronic transition within the metal ions. The complexes exhibit an octahe- dral or distorted octahedral (Cu2+ complexes) coordina- tion with the investigated ligands. REFERENCES [1] Finar, I.L. (1973) Organic chemistry, the fundamental principle. 6th Edition, Longman, London, 846. [2] Kuncheria, B. and Indrasenan, P. (1988) Thorium (IV) nitrate complexes with some substituted pyrazole-5- ones. Indian Journal of Chemistry, 27A(11), 1005- 1007. [3] Enchev, V. and Neykov, G.D. (1992) Tautomerism of N-unsubstituted pyrazolones (hydroxypyrazoles): MNDO and MNDO + CI study of C-substituted tautomers. Journal of Molecular Structure: Theochem, 258(3-4), 217-234. [4] Nayak, A., Das, N.B., Mahapatra, B.B. and Mittra, A.S. (1981) Synthesis and fungitoxicity of cobalt(II) com- plexes with 2-pyrazolin-5-one derivatives. Journal of the Indian Chemical Society, 58(4), 347-349. [5] Das, N.B., Nayak, A., Mahapatra, B.B. and Mittra, A.S. (1981) Complexes of Co(II), Ni(II), Cu(II) and Zn(II) with substituted pyrazolones used as potential fungicides. Journal of the Indian Chemical Society, 58(6), 337-339. [6] Nayak, A. and Mittra, A.S. (1980) 4,4’-Bis-5-pyrazolones and their 4,4’-unsaturated products for possible use as fungicides. Journal of the Indian Chemical Society, 57(6), 643-645. [7] Das, N.B. and Mittra, A.S. (1978) Heterocyclic fungi- cides. Part-III. Journal of the Indian Chemical Society, 55(8), 829-831. [8] Singh, H., Srivastava, S. and Maheshwari, S. (1982) Thermal and other studies of copper and cobalt com- plexes of some ligands containing the N-O group. Ther- mochimica Acta, 57(3), 369-376. [9] Lagercruntz, C. (1989) Acta Chemica Scandinavica, 43, 78.  S. A. Abdel-Latif et al. / Natural Science 2 (2010) 1035-1043 Copyright © 2010 SciRes. OPEN ACCESS 104 1043 [10] Bartulin, J., Belmar, J., Gallardo, H. and Leon, G. (1994) Journal of Heterocyclic Chemistry, 31, 561. [11] Enchev, V. and Angelova, S. (2009) Does tautomeric equilibrium exist in 4-nitroso-5-pyrazolones? Journal of Molecular Structure: Theochem, 897(1-3), 55-60. [12] Vogel, A.I. (1989) A text book of practical organic chem- istry. 5th Edition, Longman Scientific and Technical, London, 807. [13] Weissberger, A. and Porter H.D. (1942) Investigation of pyrazole compounds. I, The reaction product of phenyl- hydrazine and ethyl cyanoacetate. Journal of the Ameri- can Chemical Society, 64(9), 2133-2136. [14] Abdel-Latif, S.A., El-Roudi, O.M. and Mohamed, M.G.K. (2003) Chelation behavior of nitrosopyrazolones with Mn(II), Co(II), Ni(II), Cu(II) and Zn(II), Journal of Thermal Analysis and Calorimetry, 73(3), 939-950. [15] Abdel-Latif, S.A. (2001) Synthesis and characterization of some 3-phenyl-4-arylazo-5-pyrazolones with La(III), Ce(III), Th(IV) and UO2(VI) complexes. Synthesis and Reactivity in Inorganic and Metal-Organic Chemistry, 31(8), 1355-1374. [16] Hassib, H.B. and Abdel-Latif, S.A. (2003) Potentiometric, spectrometric thermal and conductimetric studies on some 3-phenyl-4-(arylazo)-5-pyrazolones and their com- plexes with divalent cobalt metal ion. Spectrochimica Acta Part A, 59(11), 2425-2434. [17] El-Inany, G.A., El-Wahab, S.A. and Issa, Y.M. (1982) Spectrophotometric studies on some 1-phenyl-3- methyl-4-arylhydrazone-5-pyrazolones and their com- plexes with some divalent transition metal ions. Egyptian Journal of Chemistry, 25(2), 101-105. [18] Wentworth, W.E. and Becker, R.S. (1962) Potential method for the determination of electron affinities of molecules: Application to some aromatic hydrocarbons Journal of the American Chemical Society, 84(22), 4263-4266. [19] Becker, R.S. and Wentworth, W.E. (1963) Electron af- finities and ionization potentials of aromatic hydrocar- bons. Journal of the American Chemical Society, 85(15), 2210-2214. [20] Weat, D.C. (1970) Hand book of chemistry and physics. 50th Edition, The Chemical Rubber Company, Ohio, 969. [21] Macdonald, A.M.G. and Sirichanya, P. (1969) The deter- mination of metals in organic compounds by oxy- gen-flask combustion or wet combustion. Microchemical Journal, 14(2), 199-206. [22] Temel, H., Cakir, Ü., Otludil, B. and Ugras, H.I. (2001) Synthesis, spectral and biological studies of Mn(II), Ni(II), Cu(II), and Zn(II) complexes with a tetradentate Schiff base ligand. Complexation studies and the deter- mination of stability constants (Ke). Synthesis and Reac- tivity in Inorganic and Metal-Organic Chemistry, 31(8), 1323-1337. [23] El-Shazly, R.M., Al-Hazmi, G.A.A., Ghazy, S.E., El-Shahawi, M.S. and El-Asmy, A.A. (2005) Spectro- scopic, thermal and electrochemical studies on some nickel (II) thiosemicarbazone complexes. Spectrochimica Acta Part A, 61(1-2), 243-252. [24] Greeg, S.J. (1962) Surface chemistry of solids, Chapman and Hall, London. [25] West, D.X. and Kohrman, R.E. (1979) 2-Acetylpyridine N-oxide complexes of various lanthanide(III) ions. Journal of Inorganic and Nuclear Chemistry, 41(11), 1569-1571. [26] West, D.X., Kohrman, R.E. (1979) Methyl substituted 2-picolinamine N-oxide complexes of copper(II). Jour- nal of Inorganic and Nuclear Chemistry, 41(4), 477-480. [27] Speca, A.N., Karayanis, N.M. and Pyltewski, L.L. (1974) Chromium (III) and iron (III) perchlorate with the mono-N-oxides of 2,2’-bipyridine and 1,10-phe- nanthroline. Inorganica Chimica Acta, 9(C), 87-93. [28] Lever, A.B.P. (1984) Inorganic electronic spectroscopy. 2nd Edition, Elsevier, Amsterdam. [29] El-Asmy, A.A. and Mounir, M. (1988) Electrical conduc- tivity, spectral and magnetic properties of some transition metal complexes derived from dimedone bis (4-phenylthiosemicarbazone). Transition Metal Chemis- try, 13(2), 143-145. [30] Moawad, M.M. (2002) Complexation and thermal stud- ies of uric acid with some divalent and trivalent metal ions of biological interest in the solid state. J. Coord. Chem., 50(1), 61-78.
|