Paper Menu >>
Journal Menu >>
 Journal of Environmental Protec tion, 2013, 4, 80-85 doi:10.4236/jep.2013.41b015 Published Online January 2013 (http://www.SciRP.org/journal/jep) Copyright © 2013 SciRes. JEP Assessment of Dissolved Heavymetal Pollution in Five Provinces of Zambia Kabunga Nachiyunde1, Hideo Ikeda1, Tetsuji Okuda2, Wataru Nishijima2 1Graduate School for International Development and Cooperation, Hiroshima University, Kagamiyama, Higashihiroshima, Hiroshi- ma, Japan ; 2Environmental Resea rch and Manage ment Cen tre, Hiroshima Universi ty, Kagamiyama, Higashi-Hiroshima, Hiroshima, Japan. Email: bungman@live.jp Received 2013 ABSTRACT Zamb ia’s ec ono my is hin ged o n mining a ctivi ties with Cu being t he ma in metal . Zn a nd P b were mi ned at o ne po int in Kabwe town. There are also known deposits of Co and Mn. The study focused on comparing heavy metal pollution from different regions across Zambia with a view of determining the impact of the stage of social development and econo mic activities on the e nvir onment. T he water analys ed was ob tained near d ump sites, farmlands, pit la trine s, water reservo i rs or dams, major rive rs and small streams that tr avers e Lusaka city and towns in the Copperbelt,and water from several public taps. Analysis revealed that Mn was the largest pollution factor study areas; groundwater both near illegal dumpsites and on-site sanitation facilities d id not reveal any severe p ollution prob lems beyond drinking water permissi- ble values (PV). Furthermore, principal component analysis (PCA) and Pearson correlation (r) found a strong correla- tion between Mn, and the t wo metals - Cu a nd N i at r = 0.632 andr = 0.676 respectively. The other parameters (Cd, Cr, As, Zn & Pb) were not a sig nificant factor in explaining the disso lved metal po llution in Zambia. Keywords: Heavy Metals; Manganese Pollution; Copper Mining 1. Introduction In Zambia, there is a well-developed mining sector which is the backbone of the economy. The mining sector is dominated by Cu and Co production. The country is also among the major producers of gem-quality emerald, a variety of mineral commodities for the construction in- dustry, and other gemstones (primarily amethyst, beryl, aquamarine and tourmaline) and has a high potential of coal production [1]. There is an effort to decrease to a minimum or elimi- nate penetration of the most serious contaminants into the food chain and therefore also into the human body. One of the tool in this str uggle is to tar get the monitoring of relevant contaminants in raw materials and foods of animal origin and water which is the main component utilised by plants. In order to do this, the study focused on a wide area of Zambia spanning five provinces and analysing water samples from 74 sites. Dissolved metal analysis was the focus of the study because the concen- trations of metals in dissolved form are also readily available for absorption by plants, and direct intake by animals. Most of the published work in Zambia about pollution has to a large extent been confined to study of heavy metals in food, soils and sediments [2-5]. There are high incidences of pathogens such as typhoid, cholera, strep- tococci, salmonella, poliomyelitis, and protozoans; in fact many cholera outbreaks have been reported over the past years and from as early as 1977[6], as a result, heav y metal contamination has largely been ignored in Zambia (e.g. by the media) although the scientific community makes occasion effort to determine heavy metal loadings in different en vironments (water, sediments/soil) [7 ]. 1.1. Descrip tion o f the Stu dy Areas by Province 1.1.1. Kabwe town (Central Province) Kabwe, in central Zambia, is located about 150 kilome- tres north of the nation's capital, Lusaka, and was Zam- bia’s thriving industrial base. In 1902, rich deposits of Zn and Pb were discovered there. Mining and smelting commenced thereafter and continued until 1994 without add ressing t he po tential dange rs of Pb contami nation. Cd and Ag were also produced as by-products. The mi ne a nd smelter are no longer operating but have left a city poi- soned and scared by debilitating concentrations of Pb dust in the soil. In one study conducted in Kabwe, the dispersal in soils containing Pb, Cd, Cu, and Zn extended over a 20 km radius at levels much higher than those  Assessment of Dissolved Heavymetal Poll ution in Five Provinces of Zambia Copyright © 2013 SciRes. JEP 81 recommended by the World Health Organization [5]. Mining is Zambia’s economic lifeblood, but Kabwe’s mining activitiesceased in 1994, when heavy financial losses forced the state-run Zambia Consolidated Copper Mines (ZCCM) company to shut down operations. Once was Africa’s la r gest and richest mining town, Ka bwe was left with a legacy of toxic was te . 1.1.2. Solwezi (North Western Province) Solwezi is the capital of the North Western Province of Zambia. The district had approximately 239,051 inhabi- tants as s hown b ythe 2 010 census [8] . The main i ndustry in Sol we zi i s C u mini ng a t Kansans hi M ine located about 10 km north, and Lumwana Mine located about 65 km west out of the town centre, run by First Quantum Min- era l s and E quinox Minerals respectively. Kansanshi Mine exploits Cu-Au ore from Kansanshi Anticlinal. The mining site has been in operation since 19th century for Cu and Au successively. Lumwana on the other hand was discovered in 1961, no serious work was carried out there until Eq uino x Minera ls Ltd b eca me involved in 1999. The water from this region was sampled and analysed for dissolved heavy metal pollution. It is our proposition that it will be in the best i nterest of the Zambian govern- ment to carry out a similar, independent, study in the same area after some years of sustained mineral explora- tion because Solwezi is home to some of the newest mines in the country and negative environmental effects may not have reached their climax yet. 1.1.3. Mazabuka District and its Satellite Town of Magoye (Southern Province) Mazabuka and Magoye are predominantly agricultural towns. In Zambia, fertilizer ap plication primaril y follo ws a blanket recommendation. Historical evident exists that continued fertilizer use without guided recommendation and lack of proper soil management resulted in declining soil productivity. A so il fertility survey was carried out in 2001 in Eastern, Central and Southern Provinces of Zambia whose objective was to prepare fertilizer rec- ommendations based on soil analysis for use by farmers in these regions. A total of 651 composite soil samples were collected from small-scale farmers in several dis- tricts and among them Mazabuka district. Ninety per cent of the total soil samples from the districts sampled were found to have low to very low exchangeable magnesium and 49% very low exchangeable calcium. Soil samples from Eastern, Southern and Central Provinces were found to have medium to very high exchangeable potas- sium. It was strongly recommended that lime be consi- dere d as one of the majo r inp uts i n the far ming s yste m of the surveyed provinces. Inorganic fertilizer recommenda- tions based on soil analysis were also given particularly for Central, So uthern a nd some parts of Ea stern Distric ts of Zambia [10]. Published research on heavy metals is lacking in these predominantly rural districts of Zambia. Most studies have focused on agriculture related ele- ments; the common anions and cations. 1.1.4. Lusaka City (Lusaka Province) From its earliest days of settlement in the early 1900s, the suitability of Lusaka city’s location has been a source of great controversy, the major one having been hitherto the nature of the bedrock and the hydrogeological regime under lyin g t he cit y. D uri ng t he c ity’s fou ndin g, it us uall y experienced periodic rises of the water table close to the ground surface, causing occasional flooding. There are many issues related to threats of water resources, one contentious issue being the sanitation provision in Lusa- ka which is unacceptably insufficient, as in most citie s in sub-Saharan Africa: most people do not have access to a hygienic toilet; large amounts of faecal waste are dis- charged to the environment without adequate treatment. There are also large amounts of backyard dumpsites; this is likely to have major impacts on groundwater (and streams/rivers) considering the shallow geology of Lu- saka. A variety of industries are concentrated in Lusaka city and disp osal of the waste they generate i s questiona- ble. The Environ mental Coun cil of Zambia (EC Z) has no capacity to effectively monitor all the industries. On the other hand, abstraction of ground and surface water for householduse is common in Lusaka city; it was impera- tive to investigate the anthropogenic pollution due to dissolved metal pollution on the vast Lusaka water re- sources. 1.1.5. Mufulira, C hi ngola, Kit we, Ndola (Coppe r be l t Province) Streams and rivers are a major source of fresh water in Zambia. The Kafue River, for example, is a major sup- plier of fresh water to most residential areas in the Cop- perbelt region including the mining and chemical indus- tries where large quantities of water are used to wash miner a l o re s i n o r d er to ext ra c t metals s uc h a s C u and Co . In the process, they generate effluents, which have po- tential to pollute the environment. The effluents are dis- charged into streams and rivers as a way of disposing them. The wastewaters (sometimespre-treated)are dis- charging to the surface waters of streams and reach ground water s thro ugh pe rcola tion and to the atmosp here by evaporation. Acid mine drainage, a condition created by effluents when disposed into stream and river waters, affects the water quality [11]. Water samples from four mining towns, their network of rivers and tributaries were collected and analysed fo r dissolved heavy metals. 2. Method 2.1. Sampling Sites and Instrumentation  Assessment of Dissolved Heavymetal Poll ution in Five Provinces of Zambia Copyright © 2013 SciRes. JEP 82 The water samples were collected in September and Oc- tober 2011. The following metals As, Cd, Cu and Ni were determined by the Varian 720-ES Inductively Coupled Plasma (ICP) optical emission spectrome- ter-model 720 ICPOES. The metals Cr, Mn, Pb and Zn were determined by a Perkin Elmer Analyst 100 Flame Atomic Absorption Spectrophotometer (AAS) using an air/acet y- lene flame. The determination of pH and tem- perature was determined by As One 392R pH meter. Further interpretation of the data was done by spearman correlation (r) and Principal Compone nt Analysis (PCA) using SPSS statistical package version 17.0 (SPSS Inc., Chicago, III). 2.2. Water Pollution Index (WPI) Par t of the a nal ysis in volved use o f the Nemerow- Sumi- tomo Water Pollution Index (WPI). The function of this method was to standardize the concentrations ranges for the parameters such that the different concentrations ranges for each water parameter were rescaled by the equation to produce a relative value that lies within a comparable range [12]. Based on chemical loadings relative to their permissi- ble values (PVs), the re sults fr om the wate r sample s were classified into 4 categories. The classification used in this study reflects the suitability of the water for human con- sumption because only PVs fo r dr inki ng wa t er were used . The PVs utilised in this study are based on Zambia Bu- reau of Standards (ZBS). Utilizing the PVs obtained from ZBS, the WPI was classified into four categories ex- pressing the surface and groundwater pollution levels as categorised below. 0.0 ≤WPI ≤1.0 = clean water (meets the PV criteria) 1.0 >WPI ≤5.0 = slightly polluted water 5.0 >WPI ≤10 = moderately polluted water WPI> 10 = highly polluted water 3. Data Analysis 3.1. Preliminary Analysis of the Raw Data Table 1 shows the parameters relative to their PVs. Ar- senic is one parameterwhose maximum recordable value exceeded its recommended value in drinking water. Cd on the other hand was undetectable in all the sam- ples a sse ssed in thi s s tud y. I n all the p ar a mete rs a s sessed , the average values were far below their PVs except for Mn and Ni. The other parameters whose maximum re- cordable values exceeded their permissible values were Mn, As, Cr, Ni, and Pb. 3.2. Statistical Treatment The communalities ranged from 88.7% for Mn to 25.8% for Pb. Three factors were extracted by PCA. Anal ysis of the rotated matrix showed that Mn had the greatest in- fluence in this category (F1) and was associated with Ni Table 1. Summary of the pollution data obtained from 74 locations around Zambia. Parameter Min Average Max Permissible Value SD pH 5.750 7.680 8.440 6.0-8.5 0.429 Temperature 20.50 23.59 27.00 1.42 As (ppm) 0.000 0.009 0.506 0.050 0.058 Cd (ppm) 0.000 0.000 0.000 0.005 0.000 Cr (ppm) 0.000 0.010 0.089 0.050 0.028 Cu (ppm) 0.000 0.012 0.270 1.000 0.037 Mn (ppm) 0.000 0.369 10.389 0.100 1.618 Ni (ppm) 0.000 0.015 0.698 0.010 0.083 Pb (ppm) 0.000 0.003 0.094 0.050 0.015 Zn (ppm) 0.000 0.075 1.210 5.000 0.206 and Cu. The second factor (F2) was do minat ed by Z n and associated with Cr and Pb. The third factor (F3) only consisted ofAs. The factors extracted suggest that Cu, Ni and Mn may have the same origin. This fact is further reinforced by the Pearson correlation which shows that Mn correlates strongly with Cu and Ni. Cd, though ana- lysed, wa s no t included in thedata analysis because it was undetectable in all thewater samples from the 74 sites. Pollution due to three metals (Mn, Ni, & Cu) explained 61.1% of the variance. The WPI reveals that out of all the water collected from Lusaka city, 72% is not compromised (it’s safe for human consumption); out of the water samples collected from the Copperbelt and North-western (the mining provinces), only 46% was safe for human consumption and none of the samples from southern and central re- vealed traces of heav y metal p ollution. Overall, the Cop- perbelt region had the worst polluted water (by per cent of the water which meet the clean water criteria). 3.3. Pattern o f the Pollu tion Despite the widespread Cu mining activities in Zambia, there were no s ignific ant levels of disso lved Cu in all the regions that were sampled. However, there was signifi- cant p oll utio n due to M n as sh o wn in Ta ble 1. Mn pollu- tion was also a major pollution factor even in Lusaka even though it is not a mining city; surface water was more polluted compared to groundwater. The ground water collected near high density residential areas with a rudimentary sewer system and with widespread use of on-site sanitation and ahigh prevalence of backyard dumpsites did not prove to have any serious heavy metal loadings beyond what is permissible in drinking water. Kabwe is reported as one of the most polluted towns in 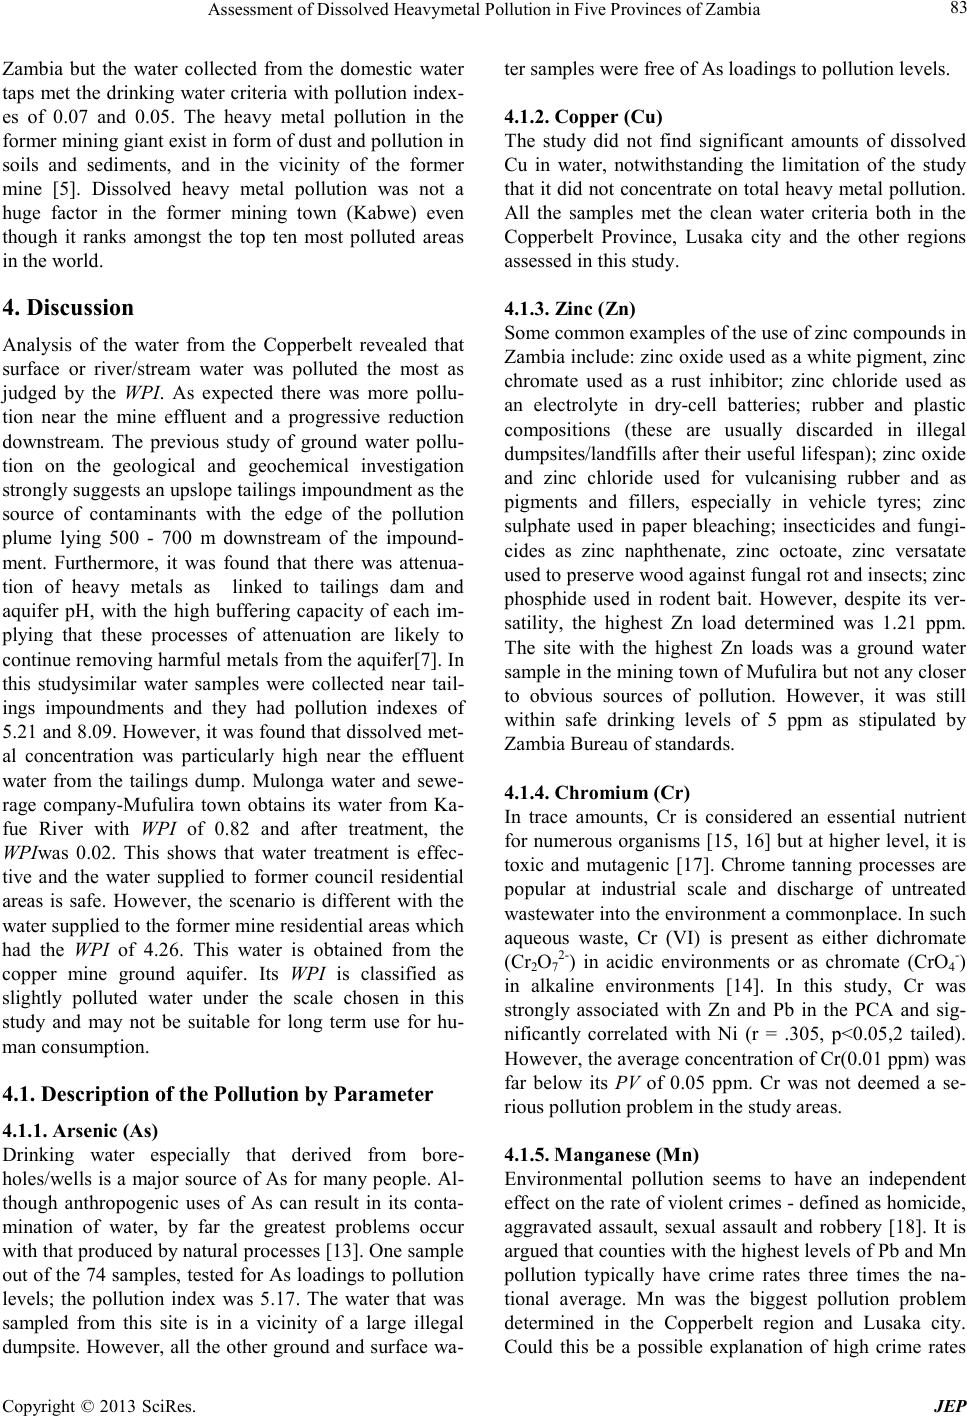 Assessment of Dissolved Heavymetal Poll ution in Five Provinces of Zambia Copyright © 2013 SciRes. JEP 83 Zambia but the water collected from the domestic water taps met the dr inking water criteria with pollution index- es of 0.07 and 0.05. The heavy metal pollution in the former mining giant exist in form of dust and pollution in soils and sediments, and in the vicinity of the former mine [5]. Dissolved heavy metal pollution was not a huge factor in the former mining town (Kabwe) even though it ranks amongst the top ten most polluted areas in the world. 4. Discussion Analysis of the water from the Copperbelt revealed that surface or river/stream water was polluted the most as judged by the WPI. As expected there was more pollu- tion near the mine effluent and a progressive reduction downstream. The previous study of ground water pollu- tion on the geological and geochemical investigation strongly suggests an upslope tailings impoundment as the source of contaminants with the edge of the pollution plume lying 500 - 700 m downstream of the impound- ment. Furthermore, it was found that there was attenua- tion of heavy metals as linked to tailings dam and aquifer pH, with the high buffering capacity of each im- plying that these processes of attenuation are likely to continue removi n g harmf ul met al s from the a quifer [ 7] . In this studysimilar water samples were collected near tail- ings impoundments and they had pollution indexes of 5.21 and 8.09. However, it was found that dissolved met- al concentration was particularly high near the effluent water from the tailings dump. Mulonga water and sewe- rage company-Mufulira town obtains its water from Ka- fue River with WPI of 0.82 and after treatment, the WPIwas 0.02. This shows that water treatment is effec- tive and the water supplied to former council residential areas is safe. However, the scenario is different with the water supplied to the former mine residential areas which had the WPI of 4.26. This water is obtained from the copper mine ground aquifer. Its WPI is classified as slightly polluted water under the scale chosen in this study and may not be suitable for long term use for hu- man consumption. 4.1. Description of the Pollution by Parameter 4.1.1. Arsenic (As) Drinking water especially that derived from bore- holes/wells is a major source of As for many people. Al- though anthropogenic uses of As can result in its conta- mination of water, by far the greatest problems occur with that produced by natural processes [13]. One sample out of the 74 samples, tested for As loadings to pollution levels; the pollution index was 5.17. The water that was sampled from this site is in a vicinity of a large illegal dumpsite. However, all the other ground and surface wa- ter samples were free of As loadings to pollution levels. 4.1.2. Copper (Cu) The study did not find significant amounts of dissolved Cu in water, notwithstanding the limitation of the study that it did not concentrate o n total heavy metal po llution. All the samples met the clean water criteria both in the Copperbelt Province, Lusaka city and the other regions asses sed in this study. 4.1.3. Zinc (Zn) Some common examples of the use of zinc compounds i n Zambia include: zinc oxide used as a white pigment, zinc chromate used as a rust inhibitor; zinc chloride used as an electrolyte in dry-cell batteries; rubber and plastic compositions (these are usually discarded in illegal dumpsites/la ndfills after their use ful lifespan); zinc o xide and zinc chloride used for vulcanising rubber and as pigments and fillers, especially in vehicle tyres; zinc sulphate used in paper bleaching; insecticides and fungi- cides as zinc naphthenate, zinc octoate, zinc versatate used to preserve wood against fungal rot and insects; zinc phosphide used in rodent bait. However, despite its ver- satility, the highest Zn load determined was 1.21 ppm. The site with the highest Zn loads was a ground water sampl e i n t he mi ni ng town o f Mu ful i ra b ut no t an y c lo se r to obvious sources of pollution. However, it was still within safe drinking levels of 5 ppm as stipulated by Zambia Bureau of standards. 4.1.4. Chromium (Cr) In trace amounts, Cr is considered an essential nutrient for numerous organisms [15, 16] but at higher level, it is toxic and mutagenic [17]. Chrome tanning processes are popular at industrial scale and discharge of untreated wastewater into the environment a commonplace. In such aqueous waste, Cr (VI) is present as either dichromate (Cr2O72-) in acidic environments or as chromate (CrO4-) in alkaline environments [14]. In this study, Cr was strongly associated with Zn and Pb in the PCA and sig- nificantly correlated with Ni (r = .305, p<0.05,2 tailed). However, the average concentration of Cr(0.01 ppm) was far below its PV of 0.05 ppm. Cr was not deemed a se- rious pollution pr oble m in the study areas. 4.1.5. Manganese (M n) Environmental pollution seems to have an independent effect on the rate of violent crimes - defined as homicide, aggravated assault, sexual assault and robbery [18]. It is argue d t hat co u nties wit h the hig he st le vel s o f P b a nd M n pollution typically have crime rates three times the na- tional average. Mn was the biggest pollution problem determined in the Copperbelt region and Lusaka city. Could this be a possible explanation of high crime rates  Assessment of Dissolved Heavymetal Poll ution in Five Provinces of Zambia Copyright © 2013 SciRes. JEP 84 reported in these regio ns notwithstanding the other caus- es of crime such as poverty (subject to further research)? The aver age Mn p ol lutio n wa s 0 .37 ppm well be yond the PV of 0.10 ppm. The site with the highest Mn level was 100 times the PV for drinking water. It is worth noting that high levels of Mn and Cu pollution in urban areas are linked to increased risk of Parkinson’s disease, ac- cording to a large-scale analysis of urban pollution and Parkinson’s incidence in the U nited Sta tes [19]. 4.1.6. Nickel (Ni) Fro m PC A analysis a nd Pe arson co rrelati on anal ysis, the results show that Ni strongly correlated with Mn (r = .676, p < 0.01, 2 tailed), which is also the single most significant pollution problem in Zambia. It was detecta- ble in the Zambian water samples beyond the recom- mendable value of 0.01 ppm; the maximum value regis- tered was 0.70 ppm. 4.1.7. Lead (Pb) In the absence of any recycling of Pb-acid batteries and other Pb containing products in Zambia, it can be as- sumed that P b-acid batteries contribute a high percentage of Pb pollution in the municipal so lid waste. Pb in petrol used in Zambia was only phased out in March 2008. Be- cause of the persistent nature of heavy metal in the soil, it was expected that groundwater would test for Pb. Through plant uptake, Pb enters food chains. It is ar- gued t ha t P b 2+, being similar to Ca2+, gets accu mulated in the bones and is subsequently remobilised along with phosphates from bones which exert a toxic effect [20]. Analysis of correlation coefficient revealed that levels of Pb did not correlate with any other metal. The average concentration was 0.003 ppm,well below the PV val ue o f 0.05 ppm. The highest concentration determined being 0.094 ppm. Despite the numerous reports documenting the historical negative effects of the obsolete Kabwe mine on the environment, dissolved Pb pollut ion was not beyond the recommended PV in all the samples except two sites, onein the Copperbelt region and the other in Lusaka city. The samples from the former, and only Pb mining town, were free of any Pb contamination. 5. Conclusion Contrary to popular belief and what other researchers may have reported about Zambia that soil sediments are contaminated with heavy metals. This study found no apparent serious problems, involving all heavy metals, which can be considered as being beyond remediation. There were no significant metal loadings in high density informal settlements and near illegal or backyard dump- sites. The heavy metal pollution problems are to a large extent confined to the mining towns and are mostly due to Mn. Even though Zambia is a mining country and the seventh producer of refined Cu as of 2010 [21], the pol- lution due to dissolved Cu is insignificant even from the effluent water discharged by the mines in Mufulira and Chingola towns. The high levels of heavy metal, espe- cially Mn, loads in the Copperbelt are a probable conse- quence of the lack of control and remediation measures duri ng and a fter mining o pera tions. F actor 1, usi ng PC A, showed that Mn was the most influential factor explain- ing 30.4 per cent of variance observed in the analysis. The statistical analysis further revealed that Mn corre- lates positive ly and significa ntl y with Cu and Ni. Despite environmental protection legislation and monitoring by ECZ and other controlling bodies being in existence, the minin g indu str y is the main source of the observed water pol lutio n and e spec iall y Mn. On the o ther ha nd, N chan ga tailings leach plant in Chingola manages a Cu tailings leach plant. The processes range from reclamation, con- centrator tails, thicke ning/de wate ring, filtration, leaching, concentration in counter current decantation thickeners, purification in solvent extraction/electro winning and neutralizatio n of final ta ils with lime fro m the li me plant. Despite all these processes the pH did not show any ano malie s not onl y fro m the Ncha nga mine or the Mu fu- lira mine effluent with similar o peratio ns, but all samples across Zambia except for one sample from Lusaka city which was slig htly acidic at p H 5.75. 6. Acknowledgement The authors would like to earnestly express their grati- tude to the Global Environmental Leaders (GEL) pro- gram of Hiroshima University for the generous financial support. REFERENCES [1] Ministry of Mines and Minerals Development, “Mining in Zambia,”n.d.. http://www.zambiamining.co.zm/industrialminerals.htm [2] K. C. Choongo, M. S. Syakalima and M. Mwase, “Coef- ficient of Condition in Relation to Copper Levels in Mus- cle of Serranochromis Fish and Sediment from the Kafue River, Zambia,”Bulletin of Environmental Contamination and Toxicology, Vol.75, No. 4, 2005, pp. 645-651. doi:10.1007/s00128-005-0801-1 [3] J. Holden, “How do the public and policy makers com- municate their perceptions of environmental risk to aca- demics?”Geophysical Research Abstracts, Vol. 12, 2010, EGU2010-15422. http://meetingorganizer.copernicus.org/EGU2010/EGU20 10-15422.pdf [4] I. Sherameti an dA.Varma, “Soi l Heavy Metals,” Springer, 2009. [5] B. D. Tembo, K. Sichilongoand J. Cernak, “Distribution  Assessment of Dissolved Heavymetal Poll ution in Five Provinces of Zambia Copyright © 2013 SciRes. JEP 85 of copper, lead, cadmium and zinc concentrations in soils around Kabwe town in Zambia,”Chemosphere, Vol. 63, No. 3,2 00 6, pp. 497–501. doi:10.1016/j.chemosphere.2005.08.002 [6] WHO (2011). Global task force on cholera control. Chol- era country profile: Zambia. Retrieved from http://www.who.int/cholera/countries/ZambiaCountryPro file2011.pdf [7] C. J. von der Heyden andM. G. New, Groundwater pollu- tion on the Zambian Copperbelt: deciphering the source and the risk. Science of The Total Environment, Vol. 327, No.1–3, 2004, pp.17–30. doi:10.1016/j.scitotenv.2003.08.028 [8] Central Statistical Office, “2010 census of Pollution and Housing - Republic of Zambia,” 2011. http://unstats.un.org/unsd/demographic/sources/census/20 10_phc/Zambia/PreliminaryReport.pdf [9] ZARI, “Soil Fertility Research: Critical levels of Zinc in Intensive Agriculture,” n.d.. http:// www.zari.gov.zm/soil_fertility_research.ph [10] F. W. NtengweandK. K. Maseka, “The impact of efflu- ents co ntain ing zin c and ni ckel metals o n str eam and ri ver water bodies: The case of Chambishi and Mwambashi streams in Zambia,”Physics and Chemistry of the Earth, Parts A/B/C, Vol. 31 No.15–16, 2006, pp. 814–820.doi:10.1016/j.pce.2006.08.027 [11] N. L. Nemerow, and H. Sumitomo, “Benefits of Water Quality Enhancement,” Report No 16110 DAJ, prepared for the US Protection Agency. Syracuse University, Syracuse, NY, 1970. [12] C. BairdandM. Cann, “Environmental Chemistry,” 4th editi on, W. H. Freeman, 200 8. [13] S. Yadav, O. P. Shuklaand U.N. Rai, “Chromium pollu- tion and bioremediation,”Environews Newsletter of ISEB India, V ol. 11, No. 1, 2005. [14] W. Mertz, “The essential trace elements,”Science, Vol. 213, No. 4514, 1981, pp. 1332–1338. doi:10.1126/science.7022654 [15] A. Pechova andL. Pavlata, “Chromium as an essential nutrient: a review,”Veterinarni Medicina, Vol. 52, No. 1, 2007, pp . 1–18. [16] M. Cieslak-Golonka, “Toxic and Mutagenic Effects of Chromium(VI). A Review,”Polyhedron, Vol. 15, No. 21, 1996, pp . 3667–3689. [17] A. Motluk, “Lead and Manganese Pollution may Lead to a Life of Crime,”LEAD Action News, Vol. 5, N o. 3, 1997. [18] SustainableBusiness.com News., “Manganese, Copper Pollution Linked to Parkinson's disease,” 2010. http://www.sustainablebusiness.com/index.cfm/go/news.d isplay/id/21358 [19] V. K. AhluwaliaandS. Malhotra, “Environmental Sci- ence,” Boca Raton: CRC, 20 07. [20] British Geology Survey, “World Mineral Production, 2006-10,” Keyworth, Nottingham: British Geological Survey, 2012 |

