Paper Menu >>
Journal Menu >>
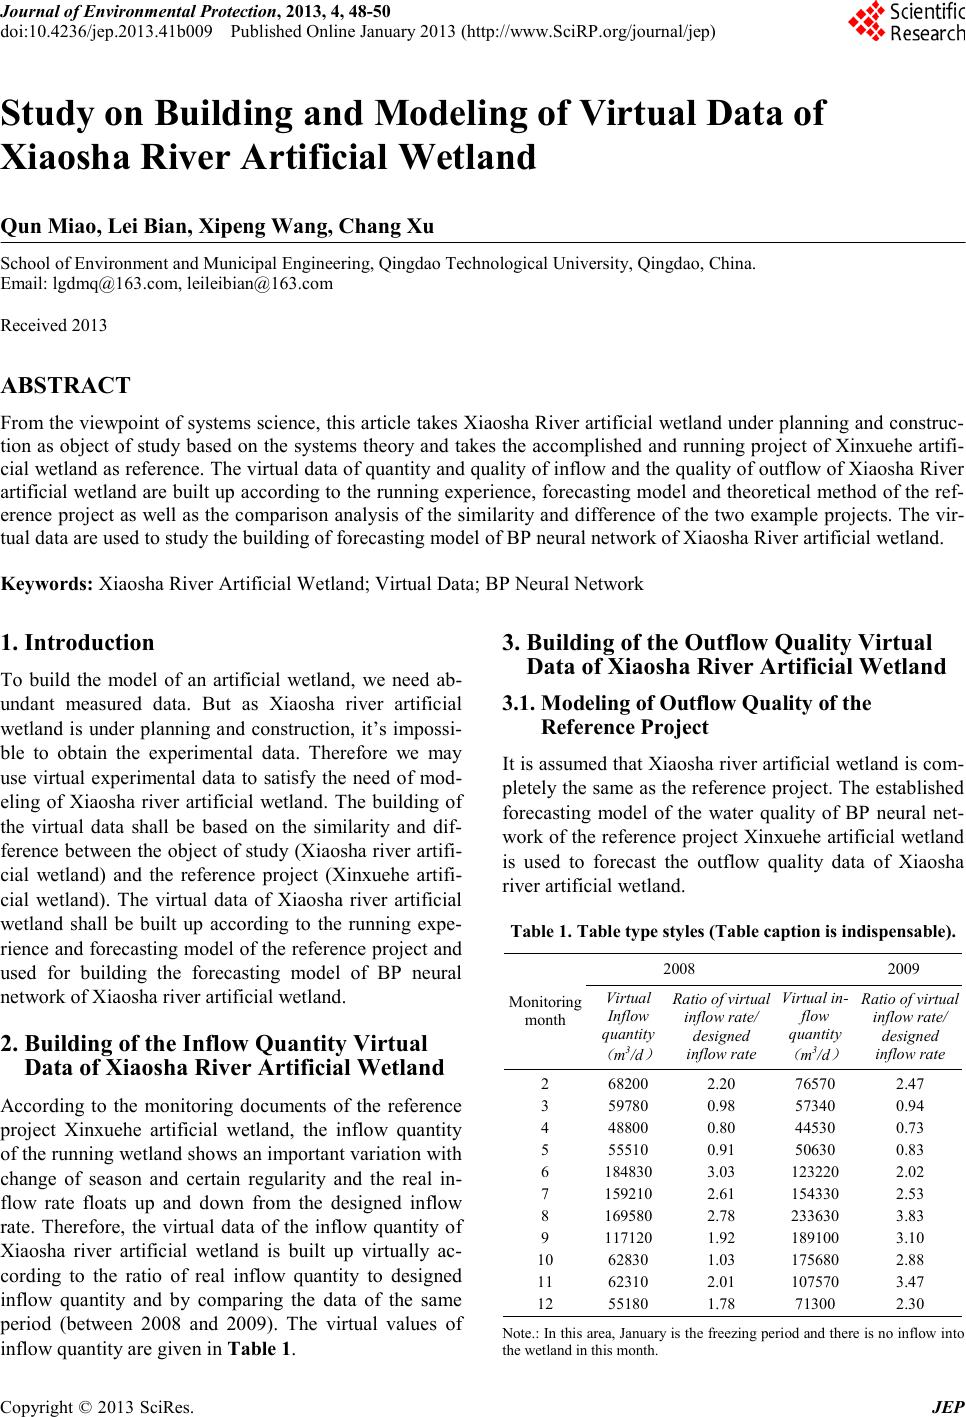 Journal of Environmental Protec tion, 2013, 4, 48-50 doi:10.4236/jep.2013.41b009 Published Online January 2013 (http://www.SciRP.org/journal/jep) Copyright © 2013 SciRes. JEP Study on Building and Modeling of Virtual Data of Xiaosha River Artificial Wetland Qun Miao, Lei Bian, Xipeng Wang, Chang Xu School of Environment and Municipal Engineering, Qingdao Technological University, Qingdao, China. Email: lgdmq@163.com, leileibian@163.com Received 2013 ABSTRACT From the vie wpoint of syste ms science, this artic le takes Xi aosha River artificial wetland under p lanning and co nstruc- tion as object of study based on the systems theory and takes the accomplished and r unning pr oject of Xinxuehe artifi- cial wetland as reference. The virtual data of quantity and quality of inflow and the quality of outflow of Xiaosha River artificial wetland are built up according to the running experience, forecasting model and theoretical method of the ref- erence project as well as the comparison analysis of the similarity and difference of the two example projects. The vir- tual data are used to study the building of forecasting model of BP neural network of Xiaosha River artificial wetland. Keywords: Xiaosha River Artificial Wetland; Virtual Data; BP Neura l N e twork 1. Introduction To build the model of an artificial wetland, we need ab- undant measured data. But as Xiaosha river artificial wetla nd is und er pla nning a nd const ructio n, it’s impo ssi- ble to obtain the experimental data. Therefore we may use virtual experimental data to satisfy the need of mod- eling of Xiaosha river artificial wetland. The building of the virtual data shall be based on the similarity and dif- ference between the object of study (Xiaosha river artifi- cial wetland) and the reference project (Xinxuehe artifi- cial wetland). The virtual data of Xiaosha river artificial wetland shall be built up according to the running expe- rience and forecasting model of the reference project and used for building the forecasting model of BP neural network of Xiaosha river artificial wetland. 2. Building of the Inflow Quantity Virtual Data of Xiaosha River Artificial Wetland According to the monitoring documents of the reference project Xinxuehe artificial wetland, the inflow quantity of the r u n ni ng wet la nd s ho ws an i mpo r ta n t var ia ti o n wit h change of season and certain regularity and the real in- flow rate floats up and down from the designed inflow rate. Therefore, the virtual data of the inflow quantity of Xiaosha river artificial wetland is built up virtually ac- cording to the ratio of real inflow quantity to designed inflow quantity and by comparing the data of the same period (between 2008 and 2009). The virtual values of inflow quantity are given i n Table 1. 3. Building of the Outflow Quality Virtual Data of Xiaosha River Artificial Wetland 3.1. Modeling of Outflow Quality of the Reference Project It is assumed that Xiaos ha river ar tificial wetland is co m- pletely the same as the reference proj ect. The established forecasting model of the water quality of BP neural net- work of the reference project Xinxuehe artificial wetland is used to forecast the outflow quality data of Xiaosha river artificial wetland. Table 1. Table ty pe styles (Table capti on is indispensable). Monitoring month 2008 2009 Vir tu al Inflow quantity ( m3/d ) Rati o of virtua l inflow rate/ designed inflow rate Virtu al in- flow quantity ( m3/d ) Rati o of virtua l inflow rate/ designed inflow rate 2 3 4 5 6 7 8 9 10 11 12 68200 59780 48800 55510 184830 159210 169580 117120 62830 62310 55180 2.20 0.98 0.80 0.91 3.03 2.61 2.78 1.92 1.03 2.01 1.78 76570 57340 44530 50630 123220 154330 233630 189100 175680 107570 71300 2.47 0.94 0.73 0.83 2.02 2.53 3.83 3.10 2.88 3.47 2.30 Note. : In this area, Janu ary is th e freezing pe riod and there is no inflow int o the wetland in this month.  Study on Building and Modeling of Virtual Data of Xiaosha River Artificial Wetland Copyright © 2013 SciRes. JEP 49 According to the virtual data building method, the building of the outflow quality data of Xiaosha river ar- tificial wetland is based on the forecasting model of the reference project Xinxuehe artificial wetland, i.e. the inflow data of Xiaosha river can be taken as input to forecast the outflow quality of Xiaosha river artificial wetland when the two projects are completely the same. Therefore, it’s necessary to build up a forecasting model of BP neural network of the reference project with inflow quantity and quality as input and outflow quality as out- put. The fore c a sting model is built up for thre e seasons of February ~ May, June ~ September and October ~ De- cember. This model is in a structure of a three-layer neural network[1], in which there’re 3 input layer neural ele- ments and 2 output layer neural elements, the transfer function of the hidden layer neural element is logsig, the transfer function of the output layer neural element is purelin, the maximum number of study cycles of the network is 10000, the target error is 0.001, the study speed is 0.1. For the three seasons, the number of nodes is 9, 11 and 11 respectively and the training function of the network is trainrp, trainscg and trainrp. The relative error of the sample test is within the acceptable range after testing. The relative error of the forecasting of water quanti ty, CO DCr a nd NH3-N o f the neur al net work mod- el of February ~ May i s 4.46% and 7.34%; the rela- tive error of the forecasting of the model of June ~ Sep- tember is 6.00% and 7.21%; the relative error of the fo- recasting of the model of October ~ December is 6.94% and 7.97% respectively. The error of the forecasting model in each season of the reference project is from -11.38% to 12.43%. Ac- cording to the criterion rule o f the forecasti ng model [2]- [3], the training result is acceptable when the relative error is below 30%~40% during the analog forecasting of BP neural network. Therefore, the network training is successful and its performance can meet the requirement of real application and can be used to build the virtual data of Xiaosha river artificial wetland. 3.2. Building of Outflow Quality Virtual Data of Xiaosha River Artificial Wetland \Xiaosha river artificial wetland and the reference project are similar and different at the same time. These differ- ences decide that the outflow quality of the wetland is different when the inflow quantity and quality are the same for the two projects. Therefore, the outflow quality virtual data o f Xiaosha river ar tificial wetla nd need to be adjusted according to the difference between the two projects. The adjusted data are the outflow quality virtual data of Xiaosha river artificial wetland. The analysis shows that the difference consists in the optimization of the design of Xiaosha river artificial wetland, mainly including the enlargement of wetland size, the regularity of geometry of wetland and the reinforcement of wetland function zone. The determination of the favor- able impact of the three optimizing factors on the elimi- nating rate of pollutant of the wetland in each season needs to be obtained from the analysis of abundant ex- perimental data. But Nansihu basin wetland ecological recovery project is now under demonstration study phase, so it’s only possible to make the above qualitative analy- sis on the favorable impact of the three optimizing fac- tor s in each se ason, but no t po ssible t o make q uanti tative determination by using mathematics method. Therefore, it’s necessary to transform the qualitative analysis into quantitative analysis to realize the building of outflow quality virtual data of Xiaosha river artificial wetland. This article tr ansforms the qualitative ana lysis into quan- titat ive analysi s by us ing exper t rat ing metho d. To make the adjusting coefficient as accurate as possible, during the study, we invited some experts who have many years of study experience to rate for the artificial wetland. Before rating, we provided them with the doc- ument s re late d to the co nstr ucti on and run ning o f the two example projects and the experts rated for the two indices CODCr and NH3-N according to their own study expe- rience and result [4-5]. The statistics result of the experts’ ratings shows that the adjusting coe fficient of CODCr of t he outflo w quali ty data of Xiaosha river artificial wetland from February to May is 0.72; the adjusting coefficient of CODCr from June to September is 0.42; the adjusting coefficient of CODCr from October to December is 0.47. The adjusting coefficient of NH3-N from February to May is 0.82; the adjusting co efficient of NH3-N fro m June to September is 0.61; the adjusting coefficient of NH3-N from October to December is 0.72. Therefore, the outflow quality virtual data of Xiaosha river artificial wetland in 2008 and 2009 are gi ven in Tabl e 2. 4. Building of Neural Network Forecasting Model of Xiaosha River Artificial Wetland The BP neural network forecasting model apt for Xiao sha river artif icial wetla nd is built up for three seaso ns o f February ~ May, June ~ September and October ~ De- cember based on the virtual data of Xiaosha river artifi- cial wetland and using matlab software. The forecasting model of Xiaosha river artificial wet- land is a three-layer neural network, in which there’re 2 input layer neural elements and 3 output layer neural elements. A fter rep etitive trial s: the nu mber of the hidd en layer neural ele ments for model Februar y ~ May is 9; the number of neural elements of June ~ September is 12; the number of neural elements of October ~ December is 13. The parameters of the forecasting model of Xiaosha river artificial wetland are deter min ed as: t he max imum nu mber 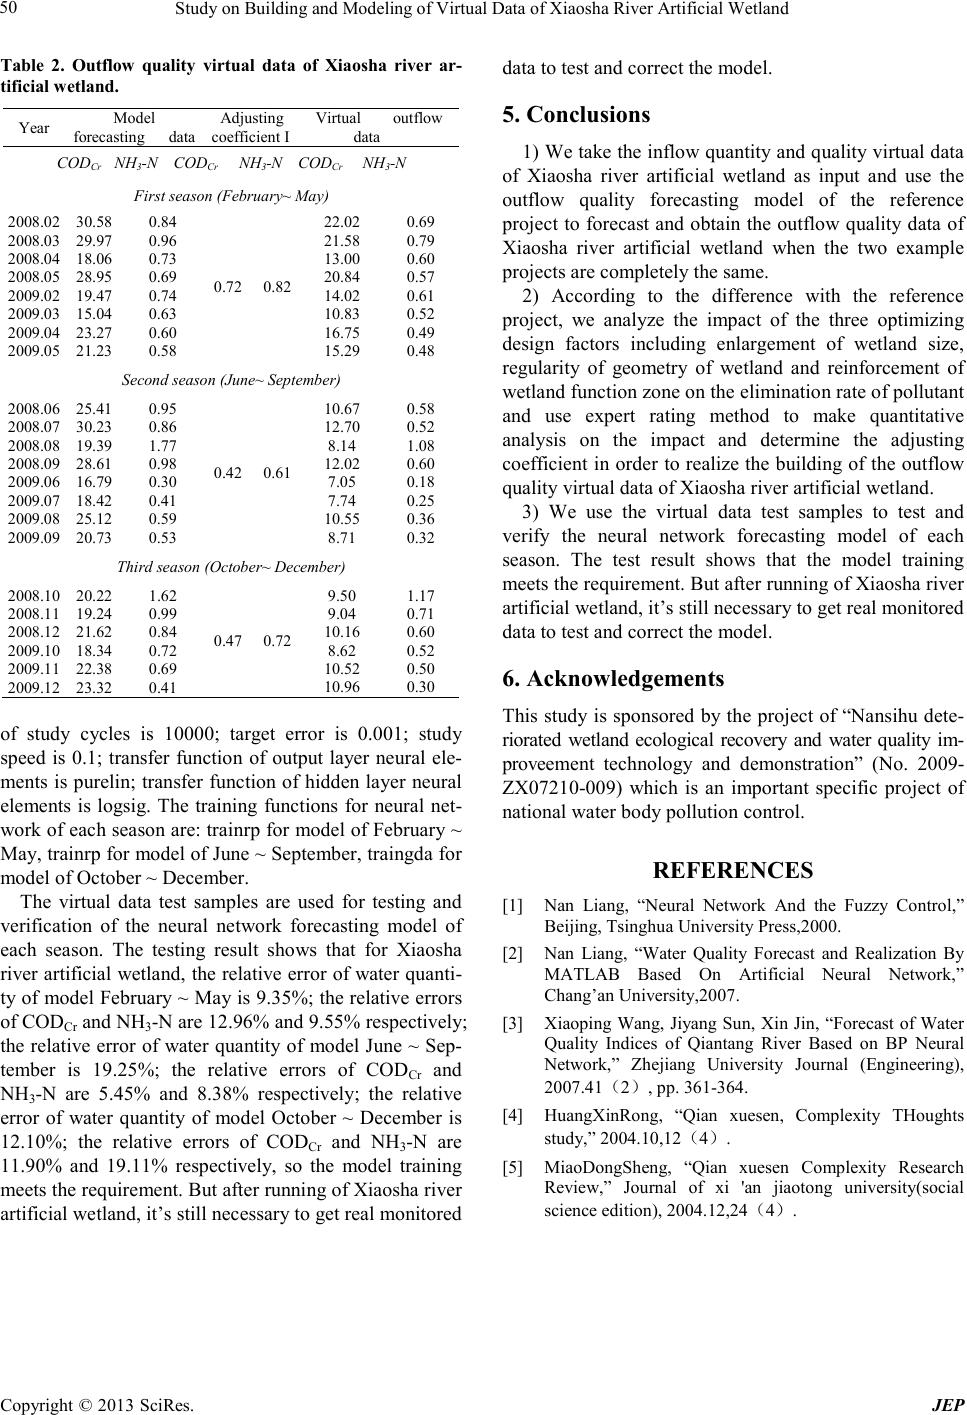 Study on Building and Modeling of Virtual Data of Xiaosha River Artificial Wetland Copyright © 2013 SciRes. JEP 50 Table 2. Outflow quality virtual data of Xiaosha river ar- tificial wetland . Year Model forecasting data Adjusting Vir tual outflow coefficient I data CODCr NH3-N CODCr NH3-N CODCr NH3-N First season (February~ May) 2008.02 2008.03 2008.04 2008.05 2009.02 2009.03 2009.04 2009.05 30.58 29.97 18.06 28.95 19.47 15.04 23.27 21.23 0.84 0.96 0.73 0.69 0.74 0.63 0.60 0.58 0.72 0.82 22.02 21.58 13.00 20.84 14.02 10.83 16.75 15.29 0.69 0.79 0.60 0.57 0.61 0.52 0.49 0.48 Second season (June~ September) 2008.06 2008.07 2008.08 2008.09 2009.06 2009.07 2009.08 2009.09 25.41 30.23 19.39 28.61 16.79 18.42 25.12 20.73 0.95 0.86 1.77 0.98 0.30 0.41 0.59 0.53 0.42 0.61 10.67 12.70 8.14 12.02 7.05 7.74 10.55 8.71 0.58 0.52 1.08 0.60 0.18 0.25 0.36 0.32 Third season (October~ December) 2008.10 2008.11 2008.12 2009.10 2009.11 2009.12 20.22 19.24 21.62 18.34 22.38 23.32 1.62 0.99 0.84 0.72 0.69 0.41 0.47 0.72 9.50 9.04 10.16 8.62 10.52 10.96 1.17 0.71 0.60 0.52 0.50 0.30 of study cycles is 10000; target error is 0.001; study speed is 0.1; transfer function of output layer neural ele- ments is purelin; transfer function of hidden layer ne ural elements is logsig. The training functions for neural net- work of each season are: trainrp for model of February ~ May, trainrp for model of June ~ September, traingda for model of October ~ December. The virtual data test samples are used for testing and verification of the neural network forecasting model of each season. The testing result shows that for Xiaosha river artificial wetland, the relative error of water quanti- ty of model February ~ May is 9.35%; the relative errors of CO DCr a nd NH3-N are 12.96% and 9.55% respectively; the relative error of water quantity of model June ~ Sep- tember is 19.25%; the relative errors of CODCr and NH3-N are 5.45% and 8.38% respectively; the relative error of water quantity of model October ~ December is 12.10%; the relative errors of CODCr and NH3-N are 11.90% and 19.11% respectively, so the model training meets t he r eq uir e me nt. B ut a ft er runnin g of X ia os ha r i ver artificial wetla nd , it’s still necessary to get real monitore d data to test and correct the model. 5. Conclusions 1) We ta ke the inflow quantit y and quality vir tual data of Xiaosha river artificial wetland as input and use the outflow quality forecasting model of the reference project to forecast and obtain the outflow quality data o f Xiaosha river artificial wetland when the two example projects are completely the same. 2) According to the difference with the reference project, we analyze the impact of the three optimizing design factors including enlargement of wetland size, regularity of geometry of wetland and reinforcement of wetland function zone on t he eliminat io n rate of pollutant and use expert rating method to make quantitative analysis on the impact and determine the adjusting coefficient in order to realize the building of the out flow quality virtual data of Xiaosha river a rtificial wetland. 3) We use the virtual data test samples to test and verify the neural network forecasting model of each season. The test result shows that the model training meets t he r eq uir e me nt. B ut a ft er runnin g of X ia os ha r i ver artificial wetla nd , it’s still necessary to get real monito r e d data to test and correct the model. 6. Acknowledgemen ts This study is sponsored by the project of “Nansihu dete- riorated wetland ecological recovery and water quality im- proveement technology and demonstration” (No. 2009- ZX07210-009) which is an important specific project of national water body pollution control. REFERENCES [1] Nan Liang, “Neural Network And the Fuzzy Control,” Beijing, Tsin ghua University Press,2000. [2] Nan Liang, “Water Quality Forecast and Realization By MATLAB Based On Artificial Neural Network,” Chang’an University,2007. [3] Xiaoping Wang, Jiyang Sun, Xin Jin, “Forecast of Water Quality Indices of Qiantang River Based on BP Neural Network,” Zhejiang University Journal (Engineering), 2007.41(2), pp. 361-364. [4] HuangXinRong, “Qian xuesen, Complexity TH oughts study,” 2004.10,12(4). [5] MiaoDongSheng, “Qian xuesen Complexity Research Review,” Journal of xi 'an jiaotong university(social science edition), 2004.12,24(4). |