Paper Menu >>
Journal Menu >>
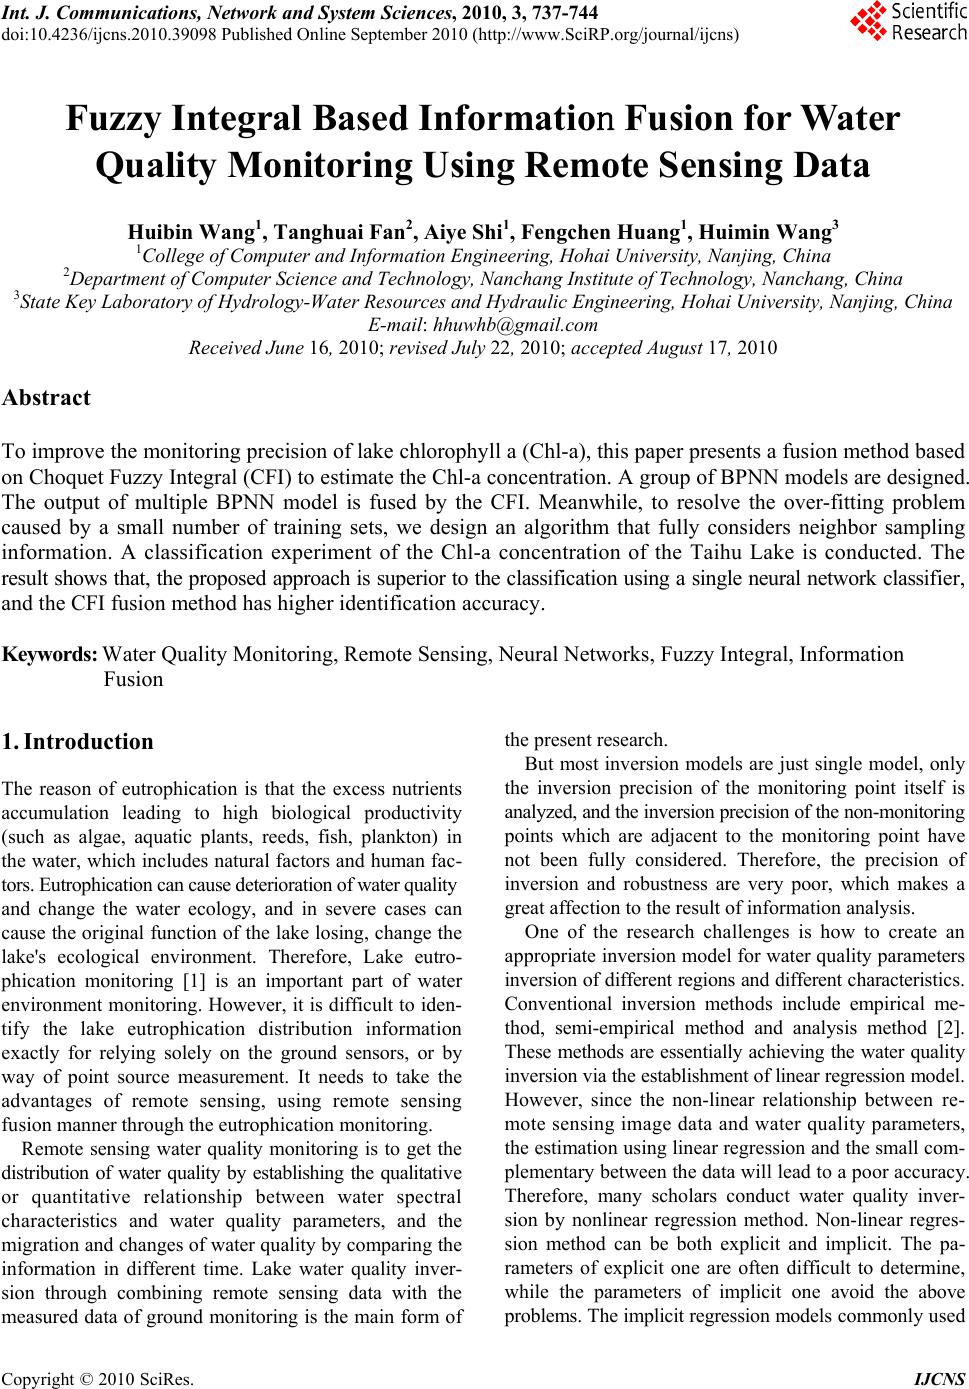 Int. J. Communications, Network and System Sciences, 2010, 3, 737-744 doi:10.4236/ijcns.2010.39098 Published Online September 2010 (http://www.SciRP.org/journal/ijcns) Copyright © 2010 SciRes. IJCNS Fuzzy Integral Based Information Fusion for Water Quality Monitoring Using Remote Sensing Data Huibin Wang1, Tanghuai Fan2, Aiye Shi1, Fengchen Huang1, Huimin Wang3 1College of Computer and Informa tion Engineering, Hohai University, Nanjing, China 2Department of Computer Science and Techno logy, Nanchang Institute of Technology, Nanchang, China 3State Key Laboratory of Hydrology-Water Resources and Hydraulic Engineering, Hohai University, Nanjing, China E-mail: hhuwhb@gmail.com Received June 16, 2010; revised July 22, 2010; accepted August 17, 2010 Abstract To improve the monitoring precision of lake chlorophyll a (Chl-a), this paper presents a fusion method based on Choquet Fuzzy Integral (CFI) to estimate the Chl-a concentration. A group of BPNN models are designed. The output of multiple BPNN model is fused by the CFI. Meanwhile, to resolve the over-fitting problem caused by a small number of training sets, we design an algorithm that fully considers neighbor sampling information. A classification experiment of the Chl-a concentration of the Taihu Lake is conducted. The result shows that, the proposed approach is superior to the classification using a single neural network classifier, and the CFI fusion method has higher identification accuracy. Keywords: Water Quality Monitoring, Remote Sensing, Neural Networks, Fuzzy Integral, Information Fusion 1. Introduction The reason of eutrophication is that the excess nutrients accumulation leading to high biological productivity (such as algae, aquatic plants, reeds, fish, plankton) in the water, which includes natural factors and human fac- tors. Eutrophication can cause deterioration of water quality and change the water ecology, and in severe cases can cause the original function of the lake losing, change the lake's ecological environment. Therefore, Lake eutro- phication monitoring [1] is an important part of water environment monitoring. However, it is difficult to iden- tify the lake eutrophication distribution information exactly for relying solely on the ground sensors, or by way of point source measurement. It needs to take the advantages of remote sensing, using remote sensing fusion manner through the eutrophication monitoring. Remote sensing water quality monitoring is to get the distribution of water quality by establishing the qualitative or quantitative relationship between water spectral characteristics and water quality parameters, and the migration and changes of water quality by comparing the information in different time. Lake water quality inver- sion through combining remote sensing data with the measured data of ground monitoring is the main form of the present research. But most inversion models are just single model, only the inversion precision of the monitoring point itself is analyzed, and the inversion precision of the non-monitoring points which are adjacent to the monitoring point have not been fully considered. Therefore, the precision of inversion and robustness are very poor, which makes a great affection to the result of information analysis. One of the research challenges is how to create an appropriate inversion model for water quality parameters inversion of different regions and different characteristics. Conventional inversion methods include empirical me- thod, semi-empirical method and analysis method [2]. These methods are essentially achieving the water quality inversion via the establishment of linear regression model. However, since the non-linear relationship between re- mote sensing image data and water quality parameters, the estimation using linear regression and the small com- plementary between the data will lead to a poor accuracy. Therefore, many scholars conduct water quality inver- sion by nonlinear regression method. Non-linear regres- sion method can be both explicit and implicit. The pa- rameters of explicit one are often difficult to determine, while the parameters of implicit one avoid the above problems. The implicit regression models commonly used 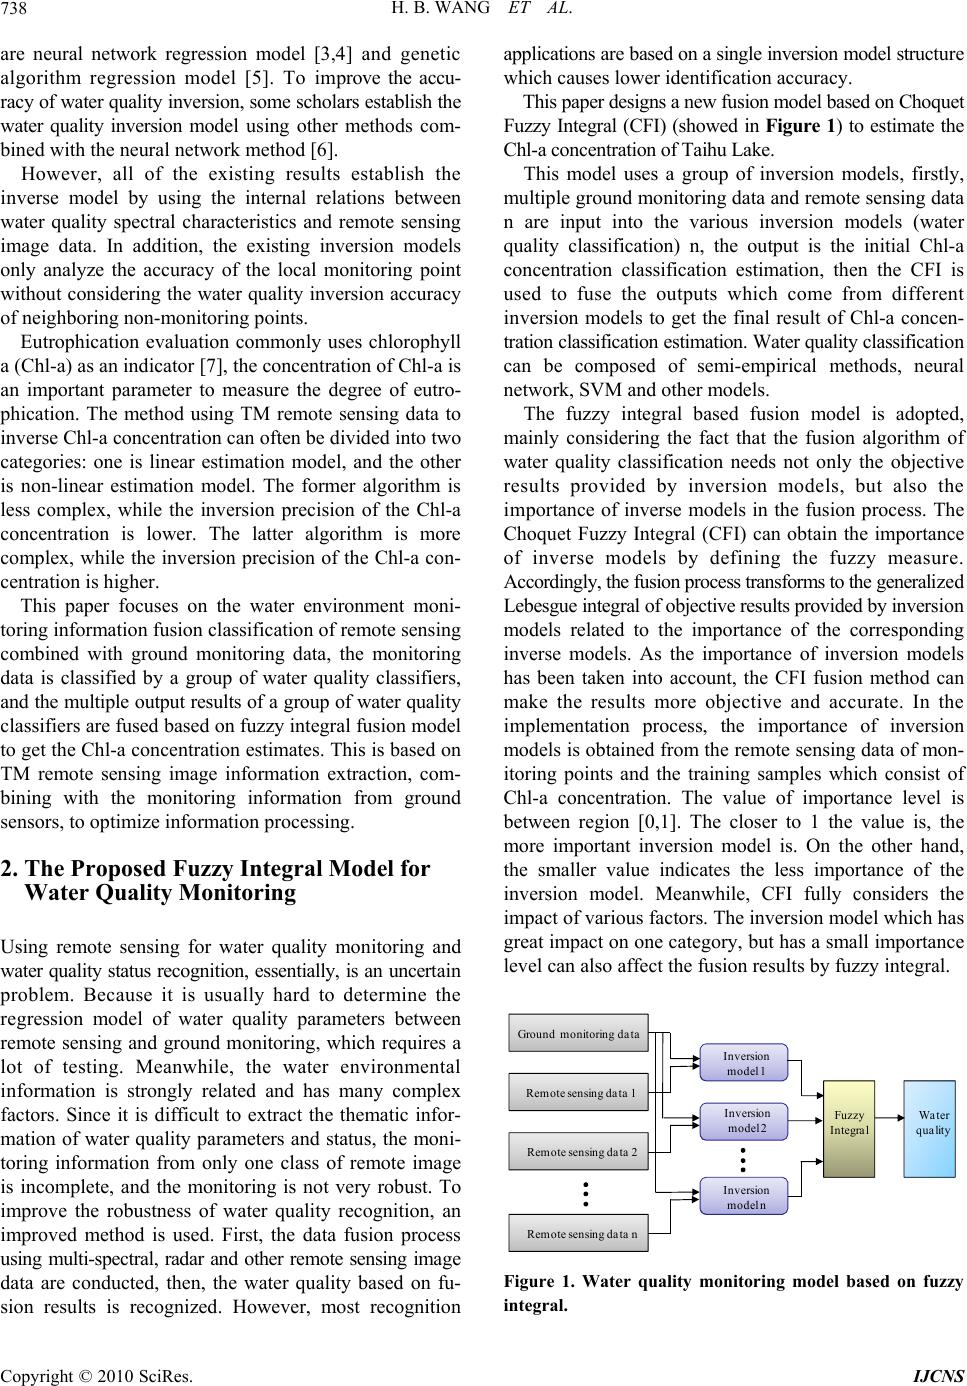 H. B. WANG ET AL. Copyright © 2010 SciRes. IJCNS 738 are neural network regression model [3,4] and genetic algorithm regression model [5]. To improve the accu- racy of water quality inversion, some scholars establish the water quality inversion model using other methods com- bined with the neural network method [6]. However, all of the existing results establish the inverse model by using the internal relations between water quality spectral characteristics and remote sensing image data. In addition, the existing inversion models only analyze the accuracy of the local monitoring point without considering the water quality inversion accuracy of neighboring non-monitoring points. Eutrophication evaluation commonly uses chlorophyll a (Chl-a) as an indicator [7], the concentration of Chl-a is an important parameter to measure the degree of eutro- phication. The method using TM remote sensing data to inverse Chl-a concentration can often be divided into two categories: one is linear estimation model, and the other is non-linear estimation model. The former algorithm is less complex, while the inversion precision of the Chl-a concentration is lower. The latter algorithm is more complex, while the inversion precision of the Chl-a con- centration is higher. This paper focuses on the water environment moni- toring information fusion classification of remote sensing combined with ground monitoring data, the monitoring data is classified by a group of water quality classifiers, and the multiple output results of a group of water quality classifiers are fused based on fuzzy integral fusion model to get the Chl-a concentration estimates. This is based on TM remote sensing image information extraction, com- bining with the monitoring information from ground sensors, to optimize information processing. 2. The Proposed Fuzzy Integral Model for Water Quality Monitoring Using remote sensing for water quality monitoring and water quality status recognition, essentially, is an uncertain problem. Because it is usually hard to determine the regression model of water quality parameters between remote sensing and ground monitoring, which requires a lot of testing. Meanwhile, the water environmental information is strongly related and has many complex factors. Since it is difficult to extract the thematic infor- mation of water quality parameters and status, the moni- toring information from only one class of remote image is incomplete, and the monitoring is not very robust. To improve the robustness of water quality recognition, an improved method is used. First, the data fusion process using multi-spectral, radar and other remote sensing image data are conducted, then, the water quality based on fu- sion results is recognized. However, most recognition applications are based on a single inversion model structure which causes lower identification accuracy. This paper designs a new fusion model based on Choquet Fuzzy Integral (CFI) (showed in Figure 1) to estimate the Chl-a concentration of Taihu Lake. This model uses a group of inversion models, firstly, multiple ground monitoring data and remote sensing data n are input into the various inversion models (water quality classification) n, the output is the initial Chl-a concentration classification estimation, then the CFI is used to fuse the outputs which come from different inversion models to get the final result of Chl-a concen- tration classification estimation. Water quality classification can be composed of semi-empirical methods, neural network, SVM and other models. The fuzzy integral based fusion model is adopted, mainly considering the fact that the fusion algorithm of water quality classification needs not only the objective results provided by inversion models, but also the importance of inverse models in the fusion process. The Choquet Fuzzy Integral (CFI) can obtain the importance of inverse models by defining the fuzzy measure. Accordingly, the fusion process transforms to the generalized Lebesgue integral of objective results provided by inversion models related to the importance of the corresponding inverse models. As the importance of inversion models has been taken into account, the CFI fusion method can make the results more objective and accurate. In the implementation process, the importance of inversion models is obtained from the remote sensing data of mon- itoring points and the training samples which consist of Chl-a concentration. The value of importance level is between region [0,1]. The closer to 1 the value is, the more important inversion model is. On the other hand, the smaller value indicates the less importance of the inversion model. Meanwhile, CFI fully considers the impact of various factors. The inversion model which has great impact on one category, but has a small importance level can also affect the fusion results by fuzzy integral. Ground monitoring data Remote sensing data 1 Remote sensing data 2 Remote sensing data n Inversion model 1 Inversion model 2 Inversion model n Fuzzy Integra l Water qua lity Figure 1. Water quality monitoring model based on fuzzy integral. 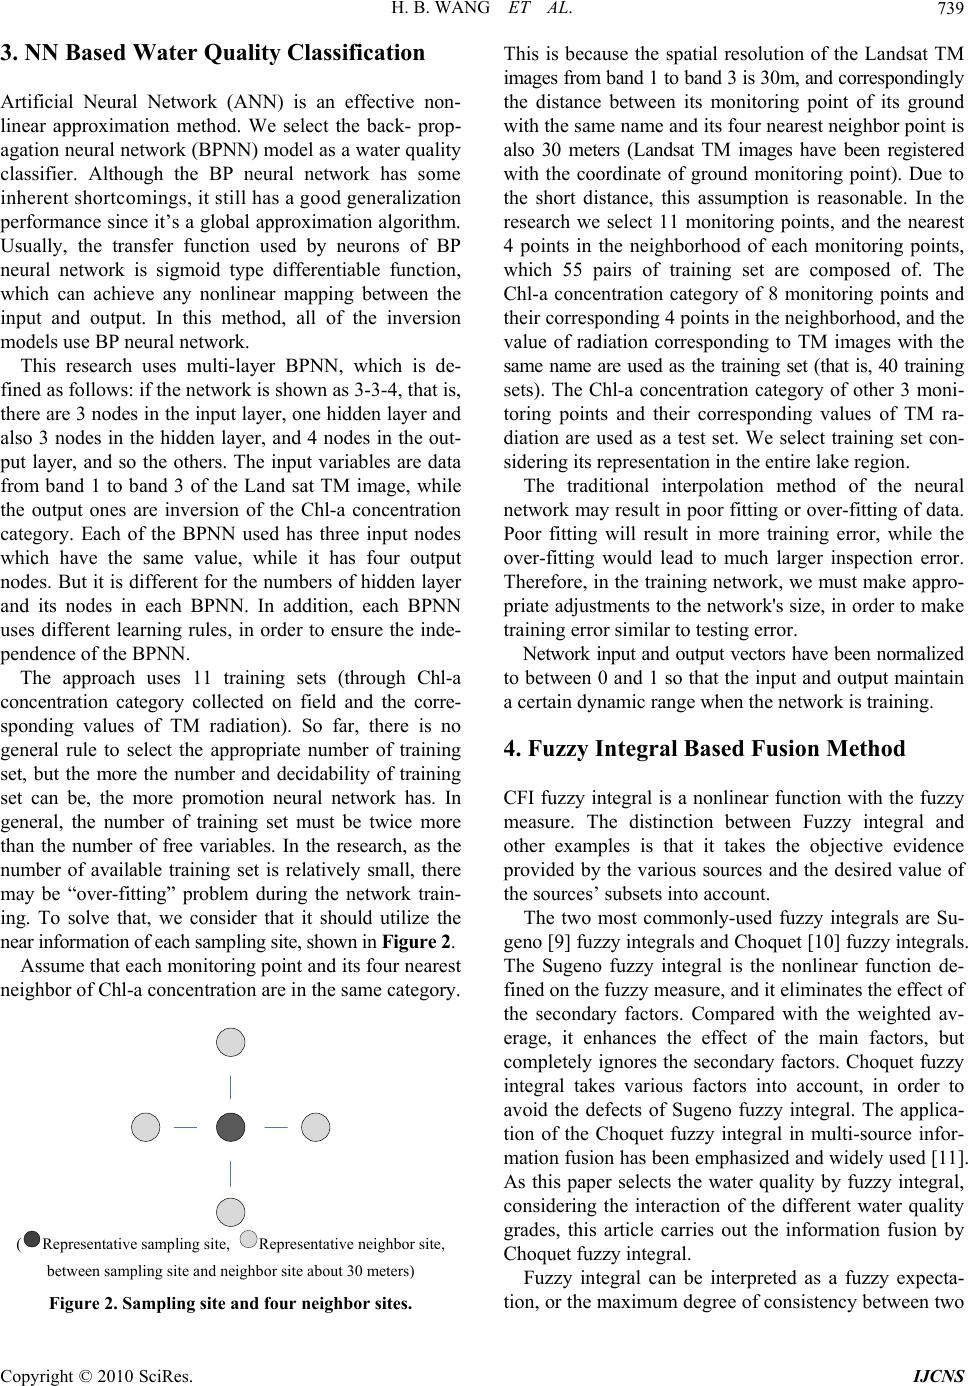 H. B. WANG ET AL. Copyright © 2010 SciRes. IJCNS 739 3. NN Based Water Quality Classification Artificial Neural Network (ANN) is an effective non- linear approximation method. We select the back- prop- agation neural network (BPNN) model as a water quality classifier. Although the BP neural network has some inherent shortcomings, it still has a good generalization performance since it’s a global approximation algorithm. Usually, the transfer function used by neurons of BP neural network is sigmoid type differentiable function, which can achieve any nonlinear mapping between the input and output. In this method, all of the inversion models use BP neural network. This research uses multi-layer BPNN, which is de- fined as follows: if the network is shown as 3-3-4, that is, there are 3 nodes in the input layer, one hidden layer and also 3 nodes in the hidden layer, and 4 nodes in the out- put layer, and so the others. The input variables are data from band 1 to band 3 of the Land sat TM image, while the output ones are inversion of the Chl-a concentration category. Each of the BPNN used has three input nodes which have the same value, while it has four output nodes. But it is different for the numbers of hidden layer and its nodes in each BPNN. In addition, each BPNN uses different learning rules, in order to ensure the inde- pendence of the BPNN. The approach uses 11 training sets (through Chl-a concentration category collected on field and the corre- sponding values of TM radiation). So far, there is no general rule to select the appropriate number of training set, but the more the number and decidability of training set can be, the more promotion neural network has. In general, the number of training set must be twice more than the number of free variables. In the research, as the number of available training set is relatively small, there may be “over-fitting” problem during the network train- ing. To solve that, we consider that it should utilize the near information of each sampling site, shown in Figure 2. Assume that each monitoring point and its four nearest neighbor of Chl-a concentration are in the same category. (Representative sampling site, Representative neighbor site, between sampling site and neighbor site about 30 meters) Figure 2. Sampling site and four neighbor sites. This is because the spatial resolution of the Landsat TM images from band 1 to band 3 is 30m, and correspondingly the distance between its monitoring point of its ground with the same name and its four nearest neighbor point is also 30 meters (Landsat TM images have been registered with the coordinate of ground monitoring point). Due to the short distance, this assumption is reasonable. In the research we select 11 monitoring points, and the nearest 4 points in the neighborhood of each monitoring points, which 55 pairs of training set are composed of. The Chl-a concentration category of 8 monitoring points and their corresponding 4 points in the neighborhood, and the value of radiation corresponding to TM images with the same name are used as the training set (that is, 40 training sets). The Chl-a concentration category of other 3 moni- toring points and their corresponding values of TM ra- diation are used as a test set. We select training set con- sidering its representation in the entire lake region. The traditional interpolation method of the neural network may result in poor fitting or over-fitting of data. Poor fitting will result in more training error, while the over-fitting would lead to much larger inspection error. Therefore, in the training network, we must make appro- priate adjustments to the network's size, in order to make training error similar to testing error. Network input and output vectors have been normalized to between 0 and 1 so that the input and output maintain a certain dynamic range when the network is training. 4. Fuzzy Integral Based Fusion Method CFI fuzzy integral is a nonlinear function with the fuzzy measure. The distinction between Fuzzy integral and other examples is that it takes the objective evidence provided by the various sources and the desired value of the sources’ subsets into account. The two most commonly-used fuzzy integrals are Su- geno [9] fuzzy integrals and Choquet [10] fuzzy integrals. The Sugeno fuzzy integral is the nonlinear function de- fined on the fuzzy measure, and it eliminates the effect of the secondary factors. Compared with the weighted av- erage, it enhances the effect of the main factors, but completely ignores the secondary factors. Choquet fuzzy integral takes various factors into account, in order to avoid the defects of Sugeno fuzzy integral. The applica- tion of the Choquet fuzzy integral in multi-source infor- mation fusion has been emphasized and widely used [11]. As this paper selects the water quality by fuzzy integral, considering the interaction of the different water quality grades, this article carries out the information fusion by Choquet fuzzy integral. Fuzzy integral can be interpreted as a fuzzy expecta- tion, or the maximum degree of consistency between two  H. B. WANG ET AL. Copyright © 2010 SciRes. IJCNS 740 opposite trends or between objective evidence with the expectation. In this paper, the fuzzy integral is under- stood as a vague expectation that it expects the high recognition accuracy of the water quality classes by means of the fuzzy integral calculation. The basic principle of fuzzy integral [12] is as follows: Suppose that Sis a random set, ()PS is the power set ofS, If Set Function g meets following conditions: 1) ()0,() 1ggS 2) () (),,,() g AgBifAB andA BP S 3) 1 (), ii i fAP SandA is monotonous, so lim ()(lim) 2 ii ii g Ag A (1) Then g is one of fuzzy measures on()PS . According to the above definition, Sugeno introduced g fuzzy measure. It satisfies the following conditions: ()() ()()()ig ABg AgBg AgB (2) To any1 , ,() A BPSand AB , Suppose that Sis a set formed by information source, Where, 12 ,, , m Sss s, And written as () ii g gs , i1, 2,, g imis called as fuzzy-density. Suppose 12 ,,, m A sss X, so () g A is de- fined as: 11 12 111 () imm mm iij m iijj g Ag ggggg (3) When 0 , according to the property of Fuzzy measure, the value of is determined by the following polynomial 1 1(1) m i i g (4) For a fixed set ,0 1 ii gg, there is exclusive (1,) and 0 , in conformity with (4). So, the fuzzy measure is totally decided by its fuzzy-density g . Murofushi and Sugeno proposed Choquet Fuzzy integral, called CFI, showing by (5): 1 0 ()()[()()] () ()0 ii i shsdghs hsgA hs (5) where 12 {, , ,} ii A ss s, the order of the ()h is de- scending, that is12 0()()()1 n hs hshs. In the new-proposed method, the output of BPNN is fused by CFI. Firstly, for ith Water quality classifier, its correct recognition rate to water qualification is i g .So, the fuzzy measure of every class different water quality classifier can be deduced from (3) and (4). In order to calculate CFI, we need to make certain belief functionh, its value is determined by the output of BPNN. Finally these BPNN are fused. According to (5), the Fuzzy integral values of every water quality classifi- cation are calculated. Then the class corresponding to the maxima value is chosen as the correct recognition class. 5. Experimental Results and Analysis This work is conducted at the Taihu Lake, which is in the Yangtze River Delta in China. The Taihu Lake is the third largest fresh water lake and is the typical plain type shallow lake with its average depth 1.89 m. The area of the Taihu Lake body is 2338.1 km2. The water body volume probably is 0.47 km3; the change coefficient of the water body is 1.18. The prevailing wind of Taihu region is southeaster in spring and summer, the concen- tration of Chl-a is a little high in its west and northwest region; additionally, the pollution of industry, household garbage and the circle net catches fish make the Chl-a concentration nearby the lake is comparably high, too. 5.1. Data Sampling and Processing The data of TM is the most used multi-spectral remote sensing data in inland water quality monitoring. The unit of TM data is scene, a scenery data, which compared to the earth area, is the area of 185 km×185 km, and space resolution is 30 m. The data of every scene is decided by the satellite orbit number and central latitude, the system, using the orbit and coordinate to decide the scene center, is called Global index system. Data usually offer users with CCT. Each unit of data (which called the pixels) records reflective luminance on the ground reflection area in each band, that are almost the same as the resolution of sensors, the quantitative series are 256. The parameters are shown in Table 1. Locate direction about representative’s point of research region respectively by using GPS, and measured transparency and reflective spectra of water in each point simultaneously. Meanwhile, in order to ensure the reli- ability of the water quality research, the ground water quality parameters acquisition time by sensors, should consistent with the TM remote sensing data acquisition time. Due to the large surface of Taihu Lake, the width and spatial resolution of a set of data from the TM are suffi- cient to cover the entire region. The TM data is obtained on 1997-05-04; its pseudo color composition diagram is shown in Figure 3. 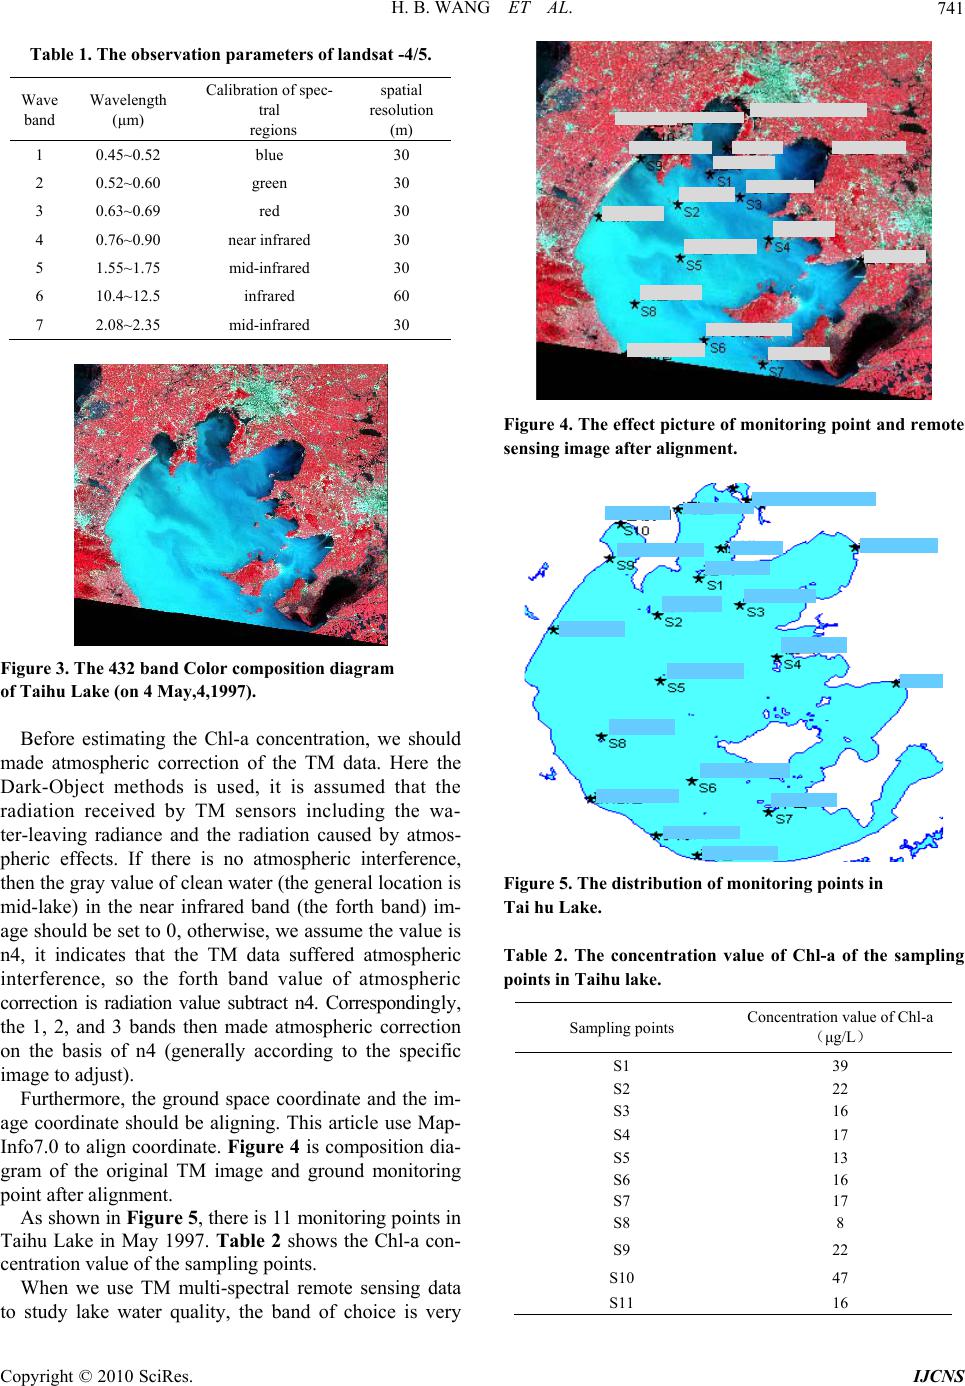 H. B. WANG ET AL. Copyright © 2010 SciRes. IJCNS 741 Table 1. The observation parameters of landsat -4/5. Wave band Wavelength (μm) Calibration of spec- tral regions spatial resolution (m) 1 0.45~0.52 blue 30 2 0.52~0.60 green 30 3 0.63~0.69 red 30 4 0.76~0.90 near infrared 30 5 1.55~1.75 mid-infrared 30 6 10.4~12.5 infrared 60 7 2.08~2.35 mid-infrared 30 Figure 3. The 432 band Color composition diagram of Taihu Lake (on 4 May,4,1997). Before estimating the Chl-a concentration, we should made atmospheric correction of the TM data. Here the Dark-Object methods is used, it is assumed that the radiation received by TM sensors including the wa- ter-leaving radiance and the radiation caused by atmos- pheric effects. If there is no atmospheric interference, then the gray value of clean water (the general location is mid-lake) in the near infrared band (the forth band) im- age should be set to 0, otherwise, we assume the value is n4, it indicates that the TM data suffered atmospheric interference, so the forth band value of atmospheric correction is radiation value subtract n4. Correspondingly, the 1, 2, and 3 bands then made atmospheric correction on the basis of n4 (generally according to the specific image to adjust). Furthermore, the ground space coordinate and the im- age coordinate should be aligning. This article use Map- Info7.0 to align coordinate. Figure 4 is composition dia- gram of the original TM image and ground monitoring point after alignment. As shown in Figure 5, there is 11 monitoring points in Taihu Lake in May 1997. Table 2 shows the Chl-a con- centration value of the sampling points. When we use TM multi-spectral remote sensing data to study lake water quality, the band of choice is very Figure 4. The effect picture of monitoring point and remote sensing image after alignment. Figure 5. The distribution of monitoring points in Tai hu Lake. Table 2. The concentration value of Chl-a of the sampling points in Taihu lake. Sampling points Concentration value of Chl-a (μg/L) S1 39 S2 22 S3 16 S4 17 S5 13 S6 16 S7 17 S8 8 S9 22 S10 47 S11 16 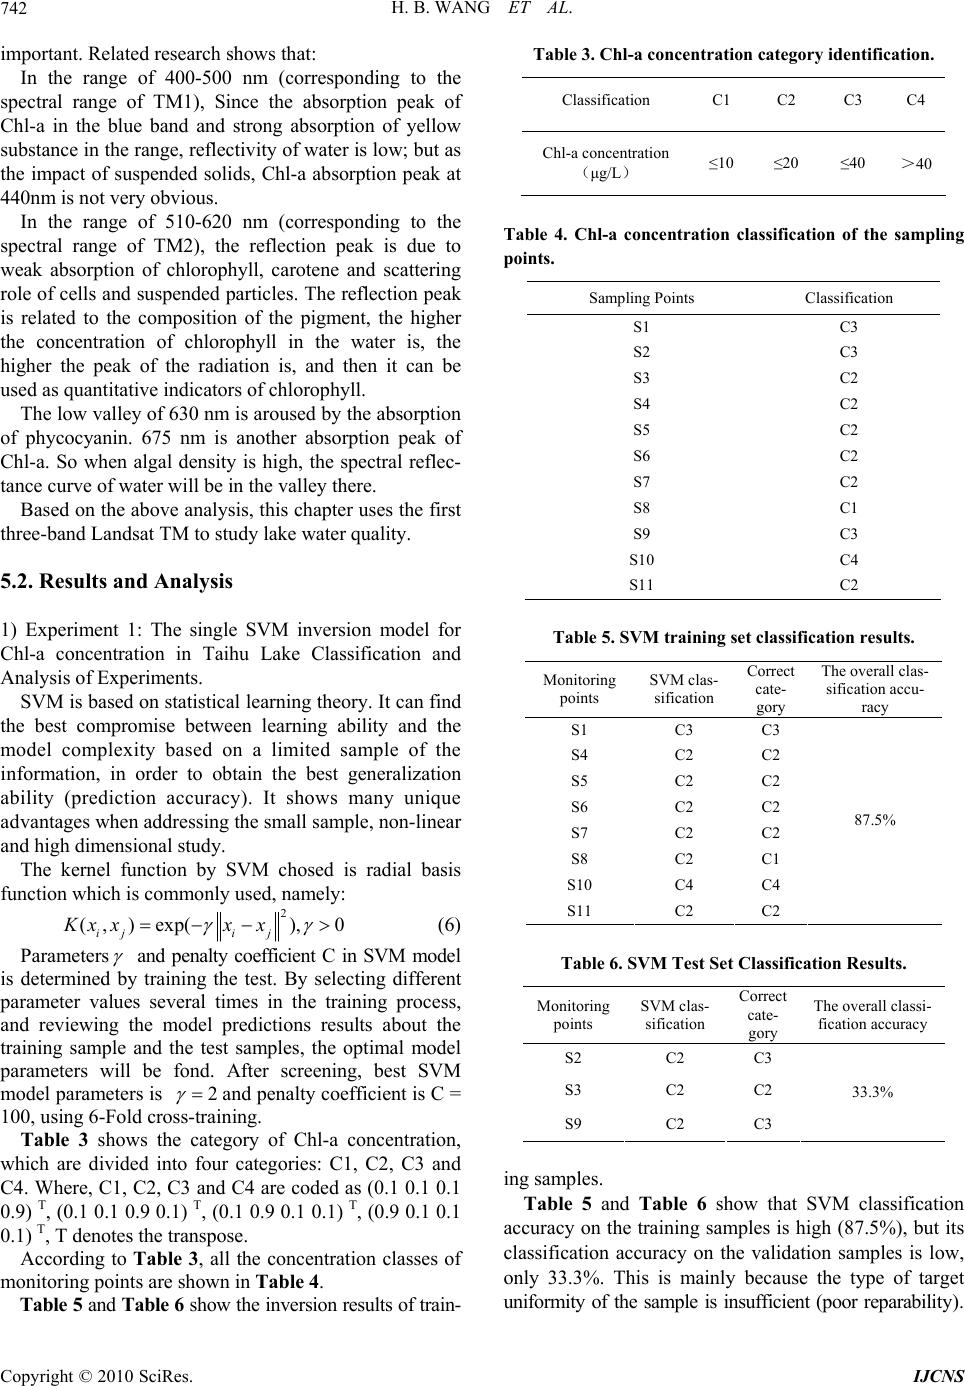 H. B. WANG ET AL. Copyright © 2010 SciRes. IJCNS 742 important. Related research shows that: In the range of 400-500 nm (corresponding to the spectral range of TM1), Since the absorption peak of Chl-a in the blue band and strong absorption of yellow substance in the range, reflectivity of water is low; but as the impact of suspended solids, Chl-a absorption peak at 440nm is not very obvious. In the range of 510-620 nm (corresponding to the spectral range of TM2), the reflection peak is due to weak absorption of chlorophyll, carotene and scattering role of cells and suspended particles. The reflection peak is related to the composition of the pigment, the higher the concentration of chlorophyll in the water is, the higher the peak of the radiation is, and then it can be used as quantitative indicators of chlorophyll. The low valley of 630 nm is aroused by the absorption of phycocyanin. 675 nm is another absorption peak of Chl-a. So when algal density is high, the spectral reflec- tance curve of water will be in the valley there. Based on the above analysis, this chapter uses the first three-band Landsat TM to study lake water quality. 5.2. Results and Analysis 1) Experiment 1: The single SVM inversion model for Chl-a concentration in Taihu Lake Classification and Analysis of Experiments. SVM is based on statistical learning theory. It can find the best compromise between learning ability and the model complexity based on a limited sample of the information, in order to obtain the best generalization ability (prediction accuracy). It shows many unique advantages when addressing the small sample, non-linear and high dimensional study. The kernel function by SVM chosed is radial basis function which is commonly used, namely: 2 (, ) exp(),0 iji j Kx xxx (6) Parameters and penalty coefficient C in SVM model is determined by training the test. By selecting different parameter values several times in the training process, and reviewing the model predictions results about the training sample and the test samples, the optimal model parameters will be fond. After screening, best SVM model parameters is 2 and penalty coefficient is C = 100, using 6-Fold cross-training. Table 3 shows the category of Chl-a concentration, which are divided into four categories: C1, C2, C3 and C4. Where, C1, C2, C3 and C4 are coded as (0.1 0.1 0.1 0.9) T, (0.1 0.1 0.9 0.1) T, (0.1 0.9 0.1 0.1) T, (0.9 0.1 0.1 0.1) T, T denotes the transpose. According to Table 3, all the concentration classes of monitoring points are shown in Table 4. Table 5 and Table 6 show the inversion results of train- Table 3. Chl-a concentration category identification. Classification C1 C2 C3 C4 Chl-a concentration (μg/L) ≤10 ≤20 ≤40 >40 Table 4. Chl-a concentration classification of the sampling points. Sampling Points Classification S1 C3 S2 C3 S3 C2 S4 C2 S5 C2 S6 C2 S7 C2 S8 C1 S9 C3 S10 C4 S11 C2 Table 5. SVM training set classification results. Monitoring points SVM clas- sification Correct cate- gory The overall clas- sification accu- racy S1 C3 C3 S4 C2 C2 S5 C2 C2 S6 C2 C2 S7 C2 C2 S8 C2 C1 S10 C4 C4 S11 C2 C2 87.5% Table 6. SVM Test Set Classification Results. Monitoring points SVM clas- sification Correct cate- gory The overall classi- fication accuracy S2 C2 C3 S3 C2 C2 S9 C2 C3 33.3% ing samples. Table 5 and Table 6 show that SVM classification accuracy on the training samples is high (87.5%), but its classification accuracy on the validation samples is low, only 33.3%. This is mainly because the type of target uniformity of the sample is insufficient (poor reparability). 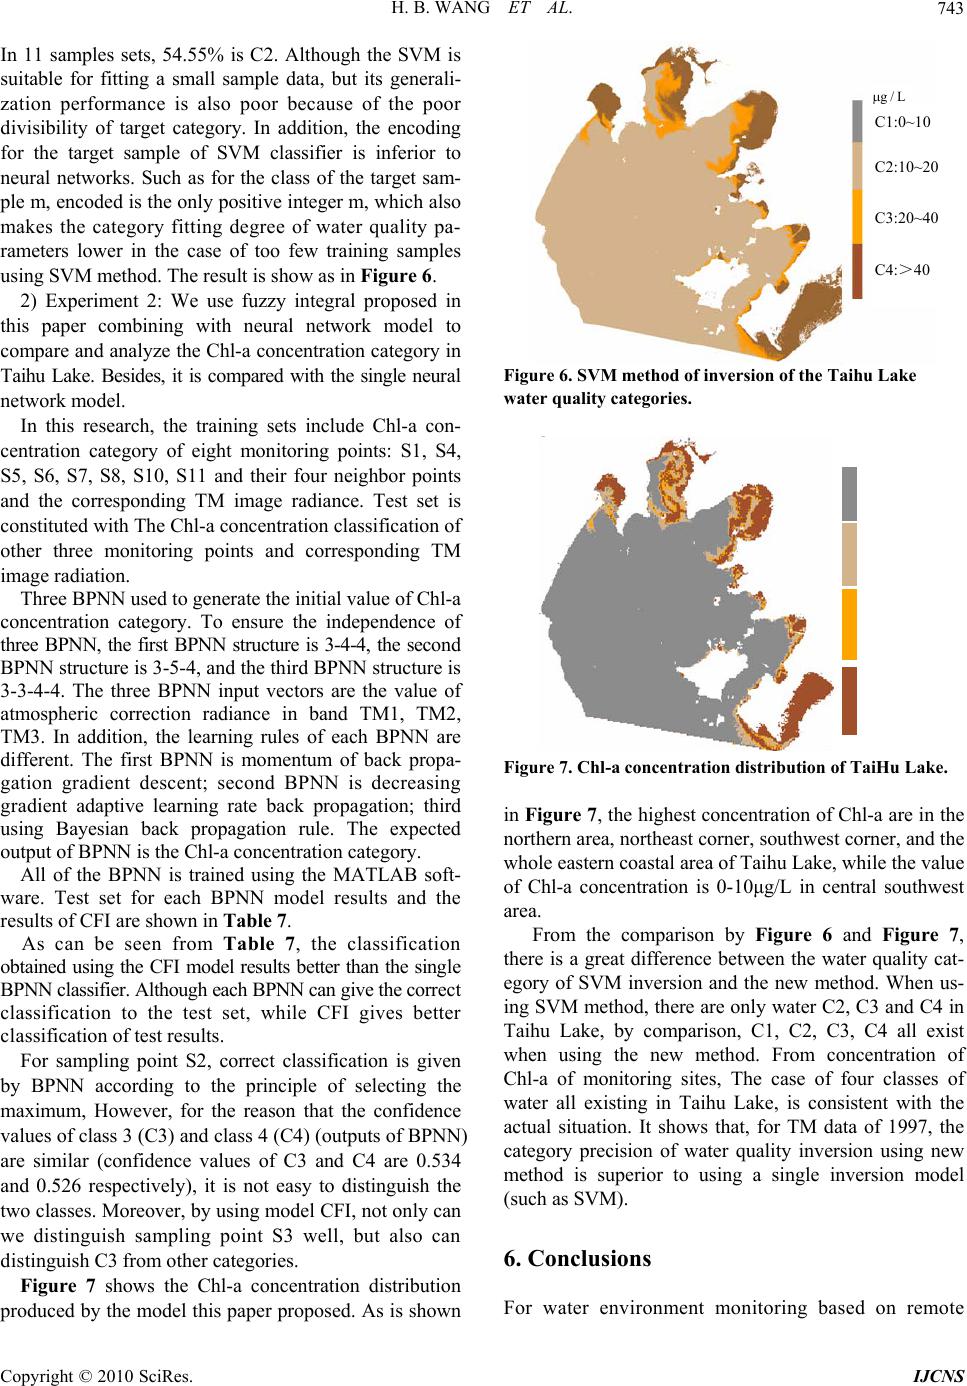 H. B. WANG ET AL. Copyright © 2010 SciRes. IJCNS 743 In 11 samples sets, 54.55% is C2. Although the SVM is suitable for fitting a small sample data, but its generali- zation performance is also poor because of the poor divisibility of target category. In addition, the encoding for the target sample of SVM classifier is inferior to neural networks. Such as for the class of the target sam- ple m, encoded is the only positive integer m, which also makes the category fitting degree of water quality pa- rameters lower in the case of too few training samples using SVM method. The result is show as in Figure 6. 2) Experiment 2: We use fuzzy integral proposed in this paper combining with neural network model to compare and analyze the Chl-a concentration category in Taihu Lake. Besides, it is compared with the single neural network model. In this research, the training sets include Chl-a con- centration category of eight monitoring points: S1, S4, S5, S6, S7, S8, S10, S11 and their four neighbor points and the corresponding TM image radiance. Test set is constituted with The Chl-a concentration classification of other three monitoring points and corresponding TM image radiation. Three BPNN used to generate the initial value of Chl-a concentration category. To ensure the independence of three BPNN, the first BPNN structure is 3-4-4, the second BPNN structure is 3-5-4, and the third BPNN structure is 3-3-4-4. The three BPNN input vectors are the value of atmospheric correction radiance in band TM1, TM2, TM3. In addition, the learning rules of each BPNN are different. The first BPNN is momentum of back propa- gation gradient descent; second BPNN is decreasing gradient adaptive learning rate back propagation; third using Bayesian back propagation rule. The expected output of BPNN is the Chl-a concentration category. All of the BPNN is trained using the MATLAB soft- ware. Test set for each BPNN model results and the results of CFI are shown in Table 7. As can be seen from Table 7, the classification obtained using the CFI model results better than the single BPNN classifier. Although each BPNN can give the correct classification to the test set, while CFI gives better classification of test results. For sampling point S2, correct classification is given by BPNN according to the principle of selecting the maximum, However, for the reason that the confidence values of class 3 (C3) and class 4 (C4) (outputs of BPNN) are similar (confidence values of C3 and C4 are 0.534 and 0.526 respectively), it is not easy to distinguish the two classes. Moreover, by using model CFI, not only can we distinguish sampling point S3 well, but also can distinguish C3 from other categories. Figure 7 shows the Chl-a concentration distribution produced by the model this paper proposed. As is shown Figure 6. SVM method of inversion of the Taihu Lake water quality categories. Figure 7. Chl-a concentration distribution of TaiHu Lake. in Figure 7, the highest concentration of Chl-a are in the northern area, northeast corner, southwest corner, and the whole eastern coastal area of Taihu Lake, while the value of Chl-a concentration is 0-10μg/L in central southwest area. From the comparison by Figure 6 and Figure 7, there is a great difference between the water quality cat- egory of SVM inversion and the new method. When us- ing SVM method, there are only water C2, C3 and C4 in Taihu Lake, by comparison, C1, C2, C3, C4 all exist when using the new method. From concentration of Chl-a of monitoring sites, The case of four classes of water all existing in Taihu Lake, is consistent with the actual situation. It shows that, for TM data of 1997, the category precision of water quality inversion using new method is superior to using a single inversion model (such as SVM). 6. Conclusions For water environment monitoring based on remote C1:0~10 C2:10~20 C3:20~40 C4:>40 g/L 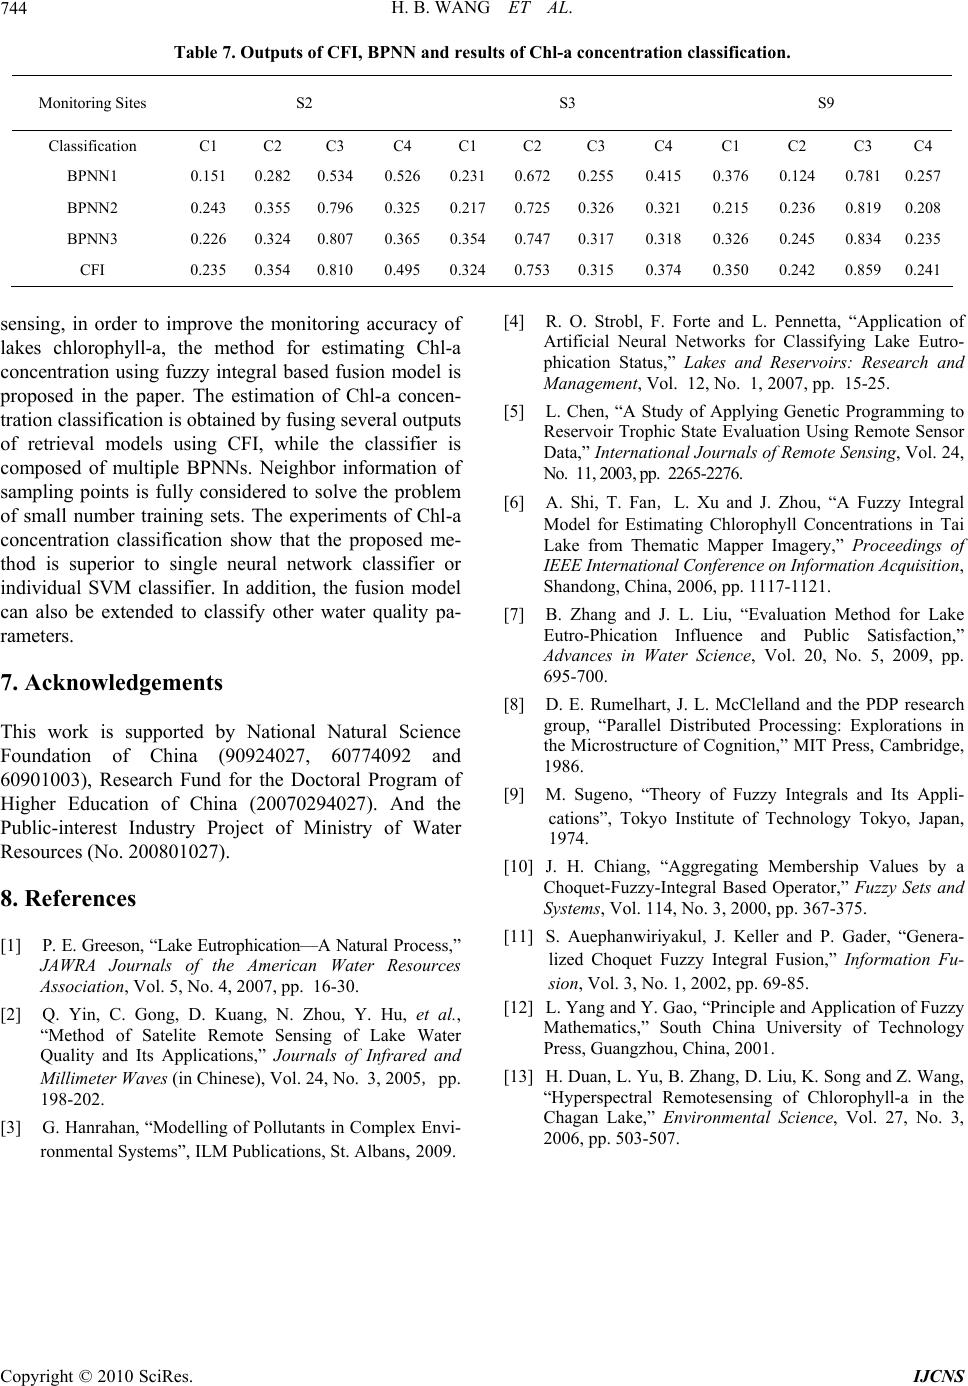 H. B. WANG ET AL. Copyright © 2010 SciRes. IJCNS 744 Table 7. Outputs of CFI, BPNN and results of Chl-a concentration classification. Monitoring Sites S2 S3 S9 Classification C1 C2 C3 C4 C1 C2 C3 C4 C1 C2 C3 C4 BPNN1 0.151 0.282 0.534 0.5260.2310.6720.2550.415 0.376 0.124 0.7810.257 BPNN2 0.243 0.355 0.796 0.3250.2170.7250.3260.321 0.215 0.236 0.8190.208 BPNN3 0.226 0.324 0.807 0.3650.3540.7470.3170.318 0.326 0.245 0.8340.235 CFI 0.235 0.354 0.810 0.4950.3240.7530.3150.374 0.350 0.242 0.8590.241 sensing, in order to improve the monitoring accuracy of lakes chlorophyll-a, the method for estimating Chl-a concentration using fuzzy integral based fusion model is proposed in the paper. The estimation of Chl-a concen- tration classification is obtained by fusing several outputs of retrieval models using CFI, while the classifier is composed of multiple BPNNs. Neighbor information of sampling points is fully considered to solve the problem of small number training sets. The experiments of Chl-a concentration classification show that the proposed me- thod is superior to single neural network classifier or individual SVM classifier. In addition, the fusion model can also be extended to classify other water quality pa- rameters. 7. Acknowledgements This work is supported by National Natural Science Foundation of China (90924027, 60774092 and 60901003), Research Fund for the Doctoral Program of Higher Education of China (20070294027). And the Public-interest Industry Project of Ministry of Water Resources (No. 200801027). 8. References [1] P. E. Greeson, “Lake Eutrophication—A Natural Process,” JAWRA Journals of the American Water Resources Association, Vol. 5, No. 4, 2007, pp. 16-30. [2] Q. Yin, C. Gong, D. Kuang, N. Zhou, Y. Hu, et al., “Method of Satelite Remote Sensing of Lake Water Quality and Its Applications,” Journals of Infrared and Millimeter Waves (in Chinese), Vol. 24, No. 3, 2005, pp. 198-202. [3] G. Hanrahan, “Modelling of Pollutants in Complex Envi- ronmental Systems”, ILM Publications, St. Albans, 2009. [4] R. O. Strobl, F. Forte and L. Pennetta, “Application of Artificial Neural Networks for Classifying Lake Eutro- phication Status,” Lakes and Reservoirs: Research and Management, Vol. 12, No. 1, 2007, pp. 15-25. [5] L. Chen, “A Study of Applying Genetic Programming to Reservoir Trophic State Evaluation Using Remote Sensor Data,” International Journals of Remote Sensing, Vol. 24, No. 11, 2003, pp. 2265-2276. [6] A. Shi, T. Fan,L. Xu and J. Zhou, “A Fuzzy Integral Model for Estimating Chlorophyll Concentrations in Tai Lake from Thematic Mapper Imagery,” Proceedings of IEEE International Conference on Information Acquisition , Shandong, China, 2006, pp. 1117-1121. [7] B. Zhang and J. L. Liu, “Evaluation Method for Lake Eutro-Phication Influence and Public Satisfaction,” Advances in Water Science, Vol. 20, No. 5, 2009, pp. 695-700. [8] D. E. Rumelhart, J. L. McClelland and the PDP research group, “Parallel Distributed Processing: Explorations in the Microstructure of Cognition,” MIT Press, Cambridge, 1986. [9] M. Sugeno, “Theory of Fuzzy Integrals and Its Appli- cations”, Tokyo Institute of Technology Tokyo, Japan, 1974. [10] J. H. Chiang, “Aggregating Membership Values by a Choquet-Fuzzy-Integral Based Operator,” Fuzzy Sets and Systems, Vol. 114, No. 3, 2000, pp. 367-375. [11] S. Auephanwiriyakul, J. Keller and P. Gader, “Genera- lized Choquet Fuzzy Integral Fusion,” Information Fu- sion, Vol. 3, No. 1, 2002, pp. 69-85. [12] L. Yang and Y. Gao, “Principle and Application of Fuzzy Mathematics,” South China University of Technology Press, Guangzhou, China, 2001. [13] H. Duan, L. Yu, B. Zhang, D. Liu, K. Song and Z. Wang, “Hyperspectral Remotesensing of Chlorophyll-a in the Chagan Lake,” Environmental Science, Vol. 27, No. 3, 2006, pp. 503-507. |