Paper Menu >>
Journal Menu >>
 Journ al of Env ir o nmental Protection, 2013, 4, 23-30 doi:10.4236/jep.2013.41b005 Published Online January 2013 (http://www.SciRP.o rg/journal/jep) Copyright © 2013 SciRes. JEP 23 A Study on Water Demand Load Estimation by Using Unit of Living Water - F ocused on Micro Water Supply Area in Daegu Cit y Ji-Soo Lee, Won-Hwa Hong* Departmentof Architecture, Kyunpook National University,Daegu, Republic of Korea. Email: *iris9972@naver.com Received 2013 ABSTRACT Water supply capability has been significantly reduced as water demand has been increased due to changes of the world's weather, causing the increase of drought frequency, and urbanization. In terms of water production, water can be secured by construction a dam or procuring substitute water. However, the study approaches in terms of management of water supply area to control the existing water efficiently. Therefore, water demand was estimated by buildings, by which water load of micro water supply area was calculated. As a result, the deviation of water demand for 1,357 micro water supply areas could be calculated while the alternatives to dissolve the spatial demand unbalance were suggested by two types. From the study, firstly, we could anticip ate th e total water supply demand f rom the total sum b y filtration plants but it was not possible to anticipate the characteristics of distribution within urban areas. For this, the study at- tempted to anticipate the demand of each 250 thousands of buildings, comprehending the demand of micro areas. Se- condly, based on the built results, we suggest the directions to dissolve the water demand unbalance between and among regio ns , wh ich could be the found ation to suggest the concrete methodo logy in the future. Keywords: Water Supp ly Area; Water Demand Estimation; Basic Unit, Water for Living; Smart Water Gr id 1. Introduction Due to the rapid industrialization, many cities have been larger and the recent weather changes cause the severe drought. Therefore, the water demand increases about 6 times in 20th century while the water supply has been unstabilized; it is expected that in 2025, about t wo thirds of the world population encounter short supply of water. In addition, the water dispute is getting severe between regions, and it was found that totally 58 cases of disputes occurred from the cases of each administration and 5 rivers' areas of Korea for 10 years(SWRRC 2008). Such problems show that the water procurement by dams had to be limited. As an alternative, smart water grid is sug- gested by utilizing the latest IT technology in terms of water demand control. The core of smart water grid is to dissolve spatia l and temporal unbala nce through efficient water control. However, to currently construct the smart grid system in the territory, it is prerequisite to estimate the water demand for a micro size, which is 5 thousands of households or micro water area. The domestic micro size water supply areas are su b-divided into water supply zones of the filtration plant, so the water usage can be calculated but it is not possible to anticipate the water usage by buildings o wing to the classificatio n of building use and the properties. Therefore, the study realizes the primary purpose of anticipating water usage by buildings in an urban area by using the basic unit of city water . Then, based on the calculated data, the water load of sub-divisions within an urban area is also calculated. The study would contribute to establishing the methodology of dissolving the unba- lanced water supply in subdivisions and be the funda- mental data to construct the smart water grid. 2. Setting a Unit of Living Water by Building Use Type Water can be roughly divided into Living water and agricultural water. Living water is also sub-divided into living water and industrial water ; the former(living water) is, in turn, divided into household water and city utiliza- tion water(Water membarane, 2006). The study limited the subject to the living water, which occupies about 84% (Daegu Statistical Annual Report, 2011) of Daegu city water. Before applying the basic unit, it is necessary, *Corresponding author. 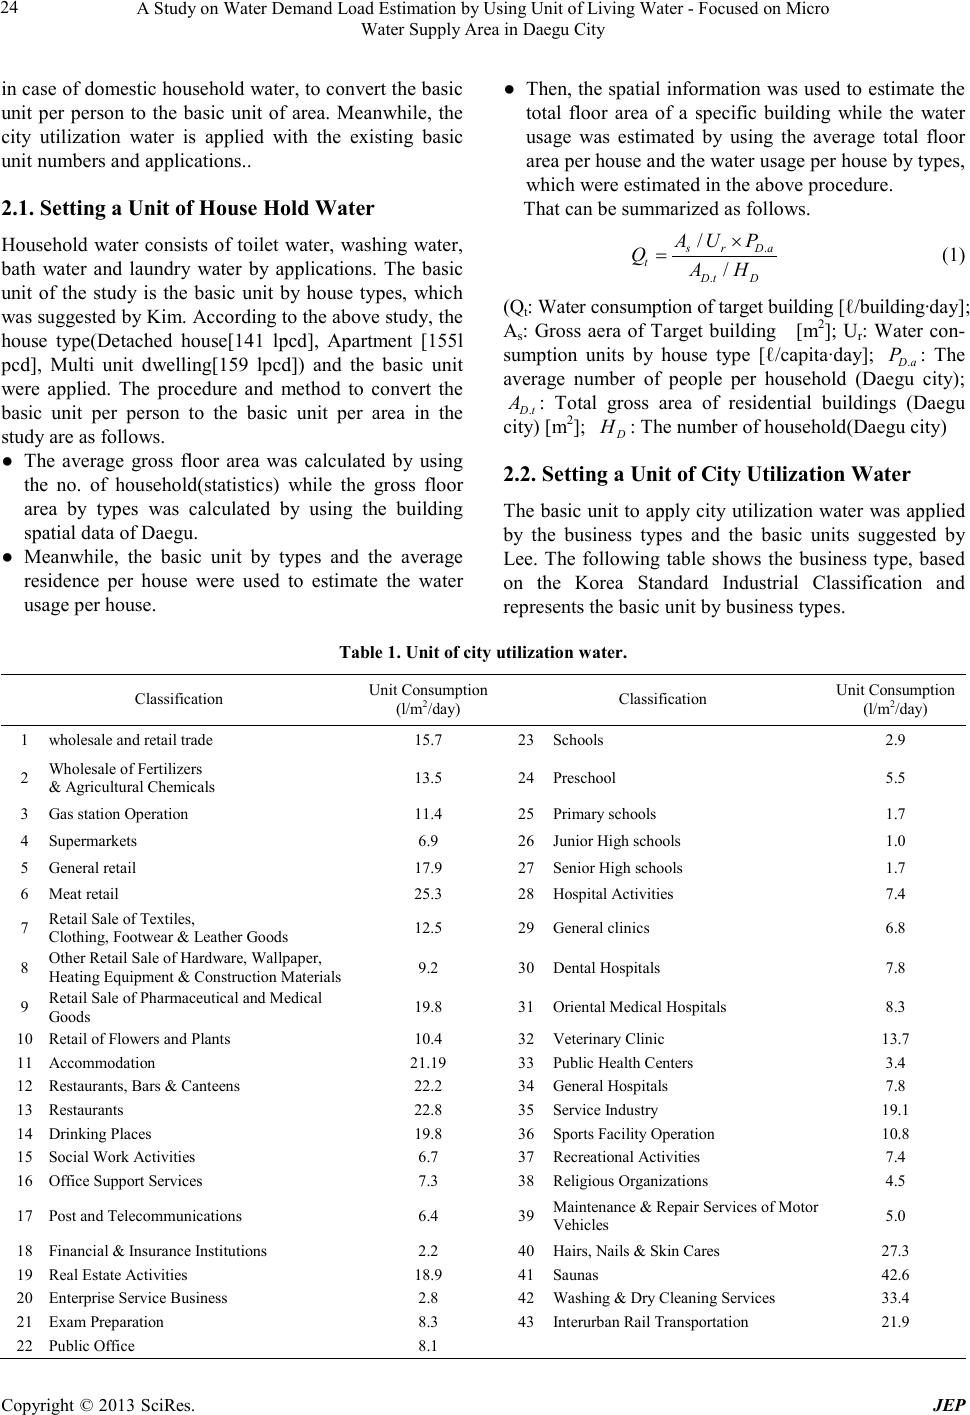 A Study on Water Demand Load Estimation by Using Unit of Living Water - Focused on Micro Water Supply Area in D aegu City Copyright © 2013 SciRes. JEP 24 in case of domestic household water, to convert the basic unit per person to the basic unit of area. Meanwhile, the city utilization water is applied with the existing basic unit numbers and applications.. 2.1. Setting a Unit of House Hold Water Household water consists of toilet water, washing water, bath water and laundry water by applications. The basic unit of the study is the basic unit by house types, which was suggested b y Kim. According to the above study, the house type(Detached house[141 lpcd], Apartment [155l pcd], Multi unit dwelling[159 lpcd]) and the basic unit were applied. The procedure and method to convert the basic unit per person to the basic unit per area in the study are as follows. ● The average gross floor area was calculated by using the no. of household(statistics) while the gross floor area by types was calculated by using the building spatial data of Daegu. ● Meanwhile, the basic unit by types and the average residence per house were used to estimate the water usage per house. ● Then, the spatial i nfor mation was used to esti mate the total floor area of a specific building while the water usage was estimated by using the average total floor area per house and the water usage per house by types, which were estimated in the a b ove procedure. That can be summarized as follows. . . / / sr Da tDt D AU P QAH × = (1) (Qt: Water cons umption o f ta r ge t b ui ld i n g [ℓ/building∙day]; As: Gross aera of Target building [m2]; Ur: Water con- sumption units by house type [ℓ/capita∙day]; .Da P: The average number of people per household (Daegu city); .Dt A: Total gross area of residential buildings (Daegu city) [m2]; D H : T he number of househo ld( Daegu city) 2.2. Setting a Unit of City Utilization Water The basic unit to ap ply city utilization water was applied by the business types and the basic units suggested by Lee. The following table shows the business type, based on the Korea Standard Industrial Classification and represents the basic unit by business types. Table 1. Unit of city utilization water. Classification Unit Consumption (l/m2/day) Classification Unit Consumption (l/m2/day) 1 wholesale and retail trade 15.7 23 Schools 2.9 2 Wholesale of Fer til izer s & Agricultural Chemic als 13.5 24 Preschool 5.5 3 Gas station Operation 11.4 25 Primary schools 1.7 4 Supermarkets 6.9 26 Junior High schools 1.0 5 General retail 17.9 27 Senior High schools 1.7 6 Meat retail 2 5.3 28 Hospital Activities 7.4 7 Ret ail S ale of Textiles, Clothing, Footwea r & Leather Goods 12.5 29 General clinics 6.8 8 Other Retai l S ale of Hardware, Wallpaper, Heati ng Equipm ent & Construction Materials 9.2 30 Dental Hospita ls 7.8 9 Retail Sale of Pharmaceutical and Medical Goods 19.8 31 Oriental Medical Hospitals 8.3 10 Retail of Flowers and Plants 10.4 32 Veterinary Clinic 13.7 11 Accommodation 21.19 33 Public Health Centers 3.4 12 Restaura n ts, Bars & Canteens 22.2 34 General Hospi tals 7.8 13 Restaurants 22.8 35 Service Industry 19.1 14 Drinking Places 19.8 36 Sports Facility Operation 10.8 15 Social Work Activities 6.7 37 Recreational Activities 7.4 16 Office Support Services 7.3 38 Religious Organizations 4.5 17 Post and Telecommun i cations 6.4 39 Maintenan ce & Repair Servi ces of M o tor Vehicles 5.0 18 Financial & Insurance Institutions 2.2 40 Hairs, Nails & Skin Cares 27.3 19 Real Estate Activities 18.9 41 Saunas 42.6 20 Enterpri se Service Business 2.8 42 Washing & Dry Cleaning Services 33.4 21 Exam Preparation 8.3 43 Interurban Rail Transportation 21.9 22 Public O f f ice 8.1 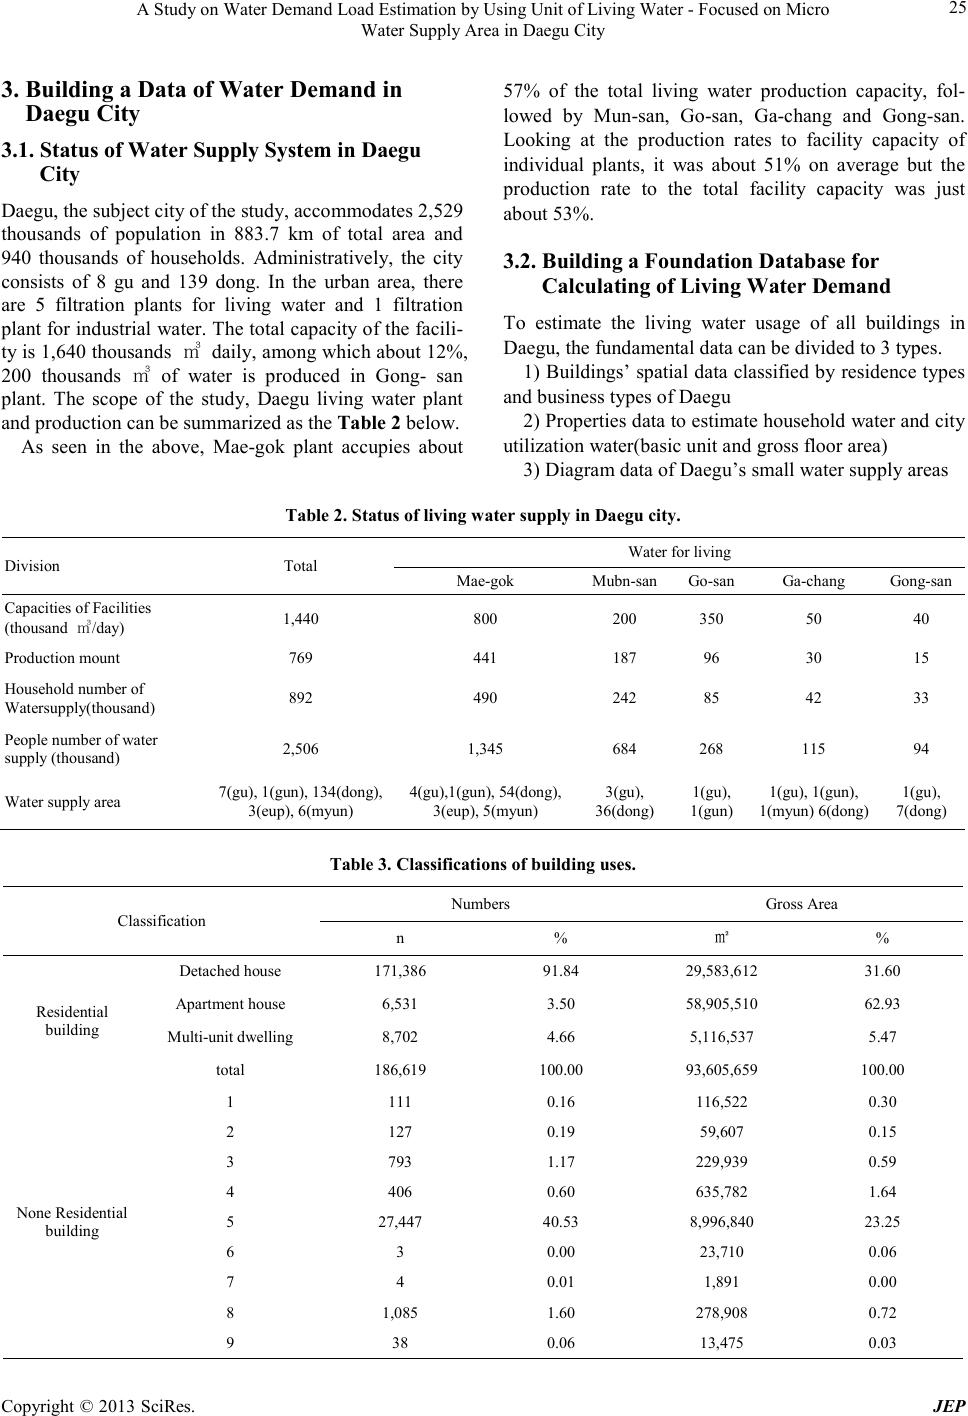 A Study on Water Demand Load Estimation by Using Unit of Living Water - Focused on Micro Water Supply Area in D aegu City Copyright © 2013 SciRes. JEP 25 3. Building a Data of Water Demand in Daegu City 3.1. Status of Water Supply System in Daegu City Daegu, the subject city of the study, accommodates 2,529 thousands of population in 883.7 km of total area and 940 thousands of households. Administratively, the city consists of 8 gu and 139 dong. In the urban area, there are 5 filtration plants for living water and 1 filtration plant for industrial water. T he total capacity of the facili- ty is 1,640 thousands ㎥ daily, among which about 12%, 200 thousands ㎥ of water is produced in Gong- san plant. The scope of the study, Daegu living water plant and production can be summarized as the Table 2 bel ow. As seen in the above, Mae-gok plant accupies about 57% of the total living water production capacity, fol- lowed by Mun-san, Go-san, Ga-chang and Gong-san. Looking at the production rates to facility capacity of individual plants, it was about 51% on average but the production rate to the total facility capacity was just about 53%. 3.2. Building a Foundation Database for Calculating of Living Water Demand To estimate the living water usage of all buildings in Daegu, the fundamental data can be divided to 3 types. 1) Buildings’ spatial data classified by residence types and business types of Daegu 2) Properties data to estimate household water and cit y utilization water(basic unit and gro ss floo r area) 3) Diagram data of Daegu’s small water supply areas Table 2. St atus of living wa ter supply in Daegu city. Division Tota l Water for living Mae-gok Mubn-san Go-san Ga -chan g Gong-san Cap acit ies of Facilities (thousand ㎥/day) 1,440 800 200 350 50 40 Production moun t 769 441 187 96 30 15 Household number of Watersupply(thousand) 892 490 242 85 42 33 People nu mber o f wa ter supply (thousand) 2,506 1,345 684 268 115 94 Water supply area 7(gu), 1(gun), 134(dong), 3(eup), 6(myun) 4(gu),1(gun), 54(d ong), 3(eup), 5(myun) 3(gu), 36(dong) 1(gu ), 1(gun) 1(gu), 1(gun), 1(myun) 6(dong) 1(gu), 7(dong) Table 3. Classificatio ns of building uses. Classification Numbers Gross Area n % ㎡ % Residential building Detached house 171,386 91.84 29,583,612 31.60 Apartment house 6,531 3.50 58,905,510 62.93 Multi-unit dwelling 8,702 4.66 5,116,537 5.47 total 186,619 100.00 93,605,659 100.00 None Residential building 1 111 0.16 116,522 0.30 2 127 0.19 59,607 0.15 3 793 1.17 229,939 0.59 4 406 0.60 635,782 1.64 5 27,447 40.53 8,996,840 23.25 6 3 0.00 23,710 0.06 7 4 0.01 1,891 0.00 8 1,085 1.60 278,908 0.72 9 38 0.06 13,475 0.03 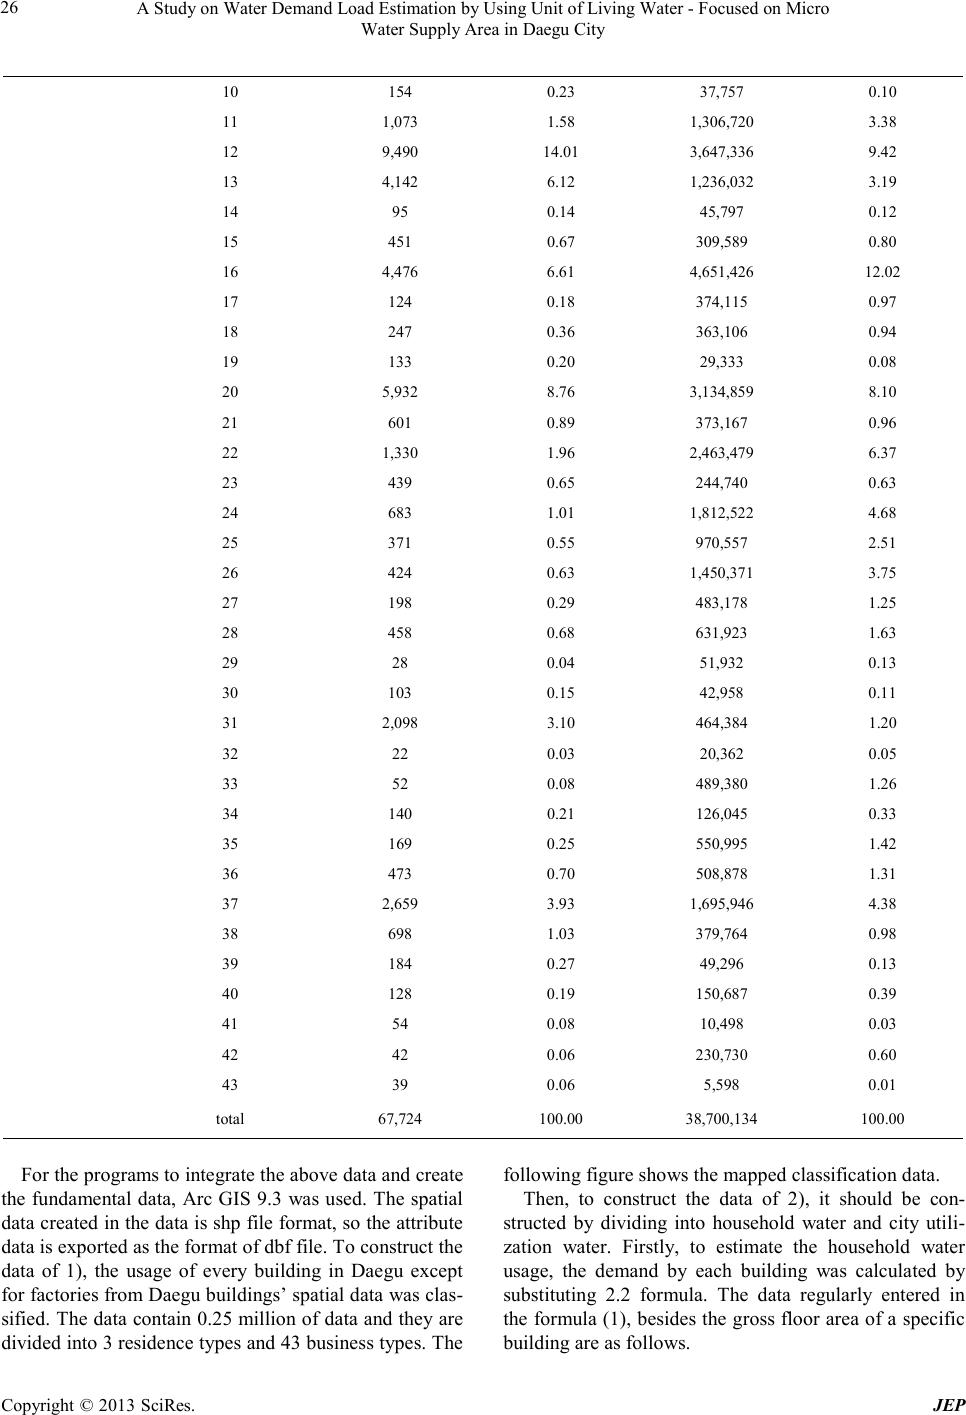 A Study on Water Demand Load Estimation by Using Unit of Living Water - Focused on Micro Water Supply Area in D aegu City Copyright © 2013 SciRes. JEP 26 10 154 0.23 37,757 0.10 11 1,073 1.58 1,306,720 3.38 12 9,490 14.01 3,647,336 9.42 13 4,142 6.12 1,236,032 3.19 14 95 0.14 45,797 0.12 15 451 0.67 309,589 0.80 16 4,476 6.61 4,651,426 12.02 17 124 0.18 374,115 0.97 18 247 0.36 363,106 0.94 19 133 0.20 29,333 0.08 20 5,932 8.76 3,134,859 8.10 21 601 0.89 373,167 0.96 22 1,330 1.96 2,463,479 6.37 23 439 0.65 244,740 0.63 24 683 1.01 1,812,522 4.68 25 371 0.55 970,557 2.51 26 424 0.63 1,450,371 3.75 27 198 0.29 483,178 1.25 28 458 0.68 631,923 1.63 29 28 0.04 51,932 0.13 30 103 0.15 42,958 0.11 31 2,098 3.10 464,384 1.20 32 22 0.03 20,362 0.05 33 52 0.08 489,380 1.26 34 140 0.21 126,045 0.33 35 169 0.25 550,995 1.42 36 473 0.70 508,878 1.31 37 2,659 3.93 1,695,946 4.38 38 698 1.03 379,764 0.98 39 184 0.27 49,296 0.13 40 128 0.19 150,687 0.39 41 54 0.08 10,498 0.03 42 42 0.06 230,730 0.60 43 39 0.06 5,598 0.01 total 67,724 100.00 38,700,1 34 100.00 For the programs to integrate the above data and create the fundamental data, Arc GIS 9.3 was used. The spatial data created in the data is shp file for mat, so the attr ibute data is exported as the format of dbf file. To construct the data of 1), the usage of every building in Daegu except for factories from Daegu buildings’ spatia l data was clas- sified. The d ata contain 0.2 5 millio n of data and they are divided into 3 residence types and 43 business types. The following figure shows the mapped c la ssification data. Then, to construct the data of 2), it should be con- structed by dividing into household water and city utili- zation water. Firstly, to estimate the household water usage, the demand by each building was calculated by substituting 2.2 formula. The data regularly entered in the for mula (1), besides the gross floor area of a specific building are as follows.  A Study on Water Demand Load Estimation by Using Unit of Living Water - Focused on Micro Water Supply Area in D aegu City Copyright © 2013 SciRes. JEP 27 (a) (b) (c) Figure 1. Classification of building uses in Daegu city. (a) Distribution of building uses in Daegu city; (b) Residential type classificat ion in downt own; (c) Non-re si dential t ype clas sification in downtown. Table 4. Data for estimation of household water demand. Detached house Apartment house Multi-un it dwelli ng Ur (ℓ) 141 159 155 PD.a(p) 2.9 AD.t(㎡) 29,583,612 58,905,510 5,116,537 HD (N) 361,447 464,960 60,435 The data of 3) were converted to shp file format by using the data of Daegu City Water. The micro water supply areas of Daegu was sub-divided into 1,545 zones while the average area was about 240 thousands m2. 2,554 buildings were contained into one zone to the maximum while 184 buildings on average are located within one zone. The above can be constructed to shp file as follows . 4. Analysis of Water Demand Load in Daegu City’s Micro Water Supply are 4.1. Water Demand Forecasting Within the Unit Building of the City The spatial distribution of water demand of Daegu was anticipated by using Arc GIS, based on 1) Building spatial data containing Residence types and business types of Daegu and 2) Attributes data(basic unit and gross floor area) to estimate the household water and city utilization water, which wa s constructed in 3 . 2. The figure below shows the spatial distribution of the demands of household water, city utilization water and livi ng wa ter by building uni t s of Daegu. The table below shows the administrative spatial dis- tribution of water demand while the comparison of the estimated living water demand of Daegu and the actual production was about 8% consistence. Looking at the results, Daeseo-gu occupied about 30% of the total de- mand for household water while Suseong-gu occupies about 20% for city utilization water, which was about 20%, the highe st p rediction. Figure 2. Constructed micro water supply area in Daegu city ( shp file). 4.2. Building an Water Demand Data on Micro Water Supply Area It was calculated by integrating the water demand by buildings and the spatial data of micro water suppl y areas, which were anlyzed in the above, and integrating the water usage by micro areas. To estimate them, the water demand data by buildings were converted to point data, which is, in turn, joined, based on micro areas' diagram data and location data. As a result of integrating the building information of totally 1,545 micro areas and excepting other micro areas with no buildings, there were 1,357 areas. The figure shows the results o f classifying the estimated demand by using natural break classificatio n As a result, the average demand of micro water supply areas was about 5,424㎥ and the difference between the max. and average was about 2,432,177㎥. In addition, standard deviation was 163,700㎥, indicating that there are severe unbalance between and among micro areas and that the areas should be readjusted, based on the de- mand.  A Study on Water Demand Load Estimation by Using Unit of Living Water - Focused on Micro Water Supply Area in D aegu City Copyright © 2013 SciRes. JEP 28 (a) (b ) (c ) Figure 3. E st i mati on of livi ng water de man d by buil di ng s. (a) Residential water; (b) City utilization water; (c) Living water. Table 4. Estimati on of wat e r diman d by administrat ive area. Administrati v e area Li ving Water cons um ption(ℓ/day) Household water(a) Urba n water(b) Total(a+b) Jung-gu 2,268,025,115.9 62,353,597 .0 2,330,378,713.0 Dong-gu 7,243,507,305.6 69,132,776.6 7,312,640,082.2 Seo-gu 2,526,147,690.6 12,263,841.0 2,538,411,531.6 Nam-gu 1,842,759,505.5 42,627,634.7 1,885,387,140.2 Buk-gu 14,463,961,482.2 75,380,174.8 14,539,341,657.0 Suseong-Gu 20,064,332,667.4 87,349,282.6 20,151,681,950.0 Dalseo-gu 21,733,972,247.3 52,708,298.9 21,786 ,680,54 6.2 Dalseong-gun 3 ,042,86 7,072.1 30,878,524.3 3,073,745,596.5 Total 73,185,573,086.7 432,694,130.0 73,618,267,216.6 (a) (b) (c) Figure 4. Esti mations of w ater de mand be micro w at er supply area usi ng over ay an aly sis. (a) B uil ding data( poi nt); (b) Micro water supply are a (polygon); (c) Distribution of water deman d by Micro water sup ply area.  A Study on Water Demand Load Estimation by Using Unit of Living Water - Focused on Micro Water Supply Area in D aegu City Copyright © 2013 SciRes. JEP 29 4.3. Adjustment Measures of Water Demand Load on Micro Water Supply Area As analyzed above, since there is much deviation of wa- ter demand, alternatives to reduce the unbalance should be studied. For this, the study extracted top 10% of the 1,357 micro areas, 135 areas were extracted, establishing the problems and suggesting the method to re-adjust the areas. The estimated water demand for the 10% areas occu- pies about 76% of the estimated total water demand, 55,786,386 m3. In addition, looking at density analysis (gross floor areap[㎡]/micro area[㎡]) results (figure), it was 1 .7 1 , 1. 17 hig her than t he ave r age o f D ae gu, 0 .5 4 . In addition, the average area of micro areas was 368,000㎡, which is 12,000㎡ larger than the average area. Meanwhile, considering the frequency of buildings, it was analyzed that 184 buildings are located on average for the total micro areas while 531 buildings were contained in top 10% areas. Based on the above results, two types of alternatives can be suggested to reduce the deviation of loads be- tween and among areas. Firstly, an area where the build- ing density is high but spatial area is broad, so more buildings are contained would be divided. The figure below shows the representative area for the first type. The area's density was 0.087, which is just the lowest 40% of the total areas but the no. of buildings was 1,504, which is top 0.4%. To divide an area. Figure 5. Top 10% of water demand area. Figure 6. Result of density analysis. The second type is an alternative re-adjusting the high density area, which is frequently found in urban areas (Figure 8). In the area of the figure below, interchange/ adjustment alternative of c r os s -areas to neighboring areas can be suggested while the interchange unit is desirably block, in consider a tion of structure of water pipes. 5. Conclusion The study suggest the alternative to dissolve the water supply unbalance by regions, the core subject of smart grid and to r educe the d eviat ion. Fo r this , whil e anal yzin g the load by micro water supply areas, the water demand of all buildings except factories in Daegu was estimated while the spatial distribution of the demand can be comprehended. As a result of the study, the place estimated to have the largest demand of livin g water was Dalseo-gu, i n whic h hou se ho l d wat er usa ge was esp e c ia ll y high. After analyzing the estimated water demand and the existing water supply areas, the standard deviation of 1,357 areas was 163,700 m3, suggesting that the un- balanced state should be dissolved by an alternative. However, the alternati ve suggested in the stud y is a kind of directions, so more effort is required to substantialize it. Although the study suggests the types based on the frequency of buildings and the density, the further study Figure 7. 1stre-adjustingalternative. Figure 8. 2nd re-adjusting alternative.  A Study on Water Demand Load Estimation by Using Unit of Living Water - Focused on Micro Water Supply Area in D aegu City Copyright © 2013 SciRes. JEP 30 would suggest the methodology, based on the basic unit of usages within the areas. While it was possible according to the previous studies to comprehend the total water demand from the total production of filtration plants, it was not possible to comprehend the small water demand of micro water supply areas due to the difference of authorities. The study was meaningful that it provides the fundamental data to construct the smart water grid by enabling the water demand by micro areas and estimation of water demand by buildings while it is expected that the study would contribute to the efficient control of water, which is the important issue fo r the co untrie s . 6. Acknowledgements This work was supported by the National Research Foundation of Korea(NRF) grant funded by the Korea government( MEST) (No. 2012-0008716). REFERENCES [1] Waterworks Headquarters Daegu Metropolitan City, “Water works Emergency Management M anual,” 2011. [2] Ministry of Environment, “Manual of water supplyde- mandforecasting work,”2008. [3] Lee. Doojin, Kim. Juwhan and Kim. Hwasoo, “Statistical Analysis on Non-Household Unit Water Use for Business Categories,” Journal of Civil Engineering, Vol. 29, No. 4, 2009, pp . 385-396. [4] Kim. Hwasoo, Lee. Doojin, Kim. Juwhan, and Jung. Kwansoo, “End-use Analysis of Household Water by Metering,” Journal of Civil Engineering, Vol. 28, No. 5, 2008, pp . 1-7. [5] Yoo. Seunghoon, Jung. Kunoh and Yang. Changyoung, “Analysis on the Municipal Water Demand in Seoul Us- ing the Micronomic Household Data,” The Seoul Institute, Vol. 6, No.1, 2005 |