Paper Menu >>
Journal Menu >>
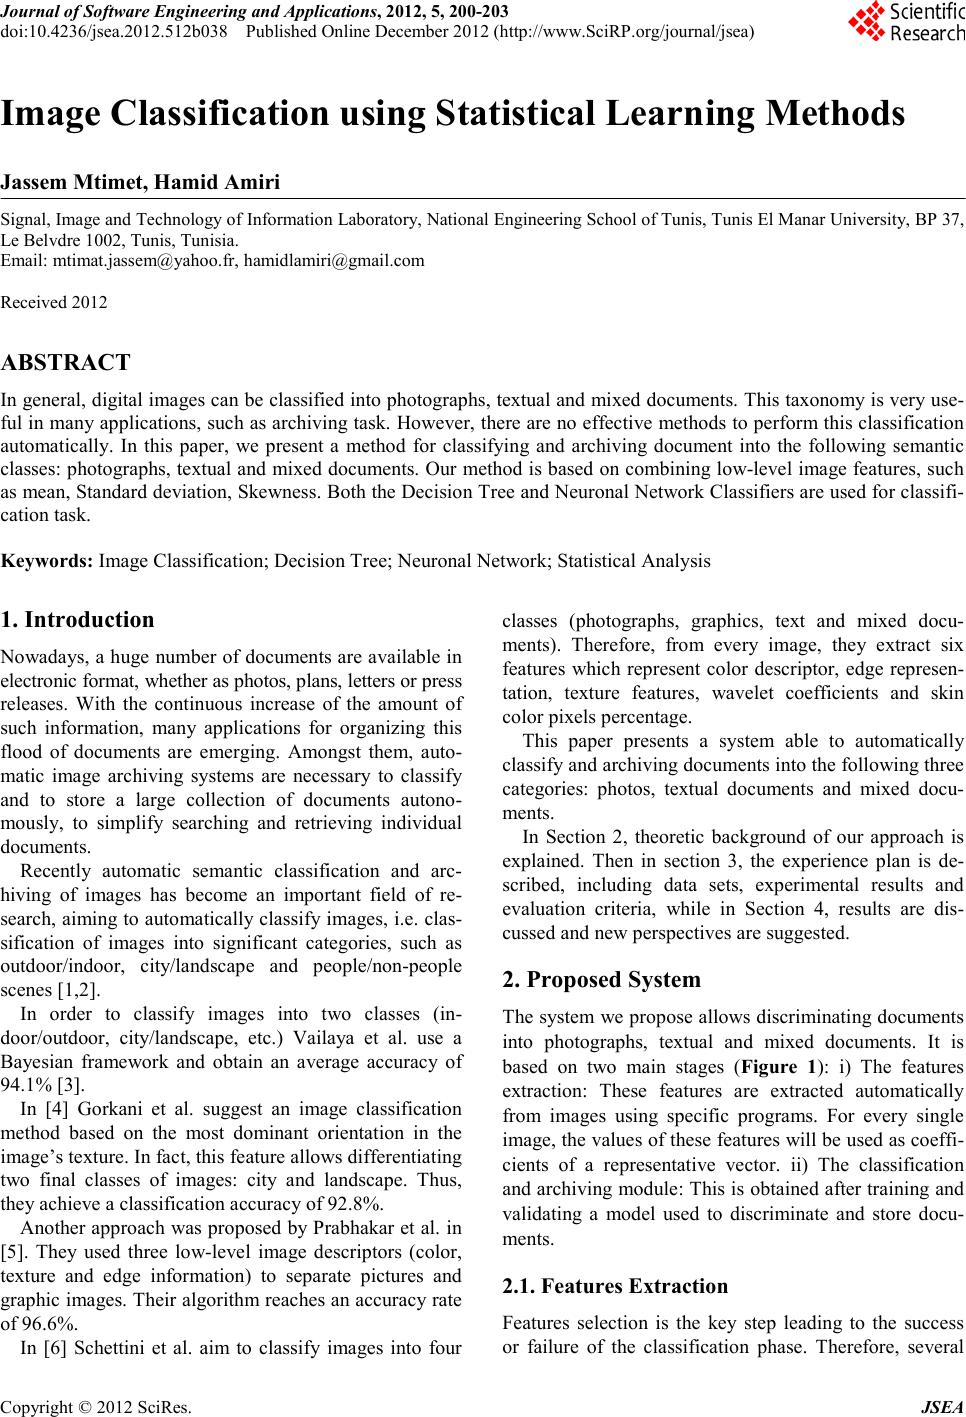 Journ al of Software Engineering and Applications, 2012, 5, 200-203 doi:10.4236 /j sea.2 012.512b038 Published Online December 2012 (http://www.SciRP.org/journal/jsea) Copyright © 2012 SciR es. JSEA Image Classification using Statistical Learning Methods Jassem Mtimet, Hamid Amiri Signal, Image and Technology of Information Laboratory, National Engineering School of Tunis, Tunis El Manar University, BP 37, Le Belvdre 1002, Tunis, Tunisia. Email: mtimat. jasse m@y a hoo .fr, hamidlamiri@gmail.com Received 2012 ABSTRACT In gene ral, d igital i mages can b e classi fied into photo grap hs, text ual and mixed d ocu me nts. T his taxo nomy is very use- ful in many applications, such as archiving task. However, there are no effective methods to perfor m this classification automatically. In this paper, we present a method for classifying and archiving document into the following semantic classes: photographs, textual and mixed documents. Our method is based on combining low-level i mage fea tures, s uch as mean, Standard deviation, Skewness. Both the Decisio n Tree and Neuronal Network Classifiers are used for classifi- cation task. Keywords: Image Classification; Decision Tree; Neuronal Network; Statistica l Ana l ysi s 1. Introduction Nowadays, a huge number of documents are available in electronic format, whether as photos, p lans, letter s or pres s releases. With the continuous increase of the amount of such information, many applications for organizing this flood of documents are emerging. Amongst them, auto- matic image archiving systems are necessary to classify and to store a large collection of documents autono- mously, to simplify searching and retrieving individual documents. Recently automatic semantic classification and arc- hiving of images has become an important field of re- search, aiming to automatically classify images, i.e. clas- sification of images into significant categories, such as outdoor/indoor, city/landscape and people/non-people scene s [1,2]. In order to classify images into two classes (in- door/outdoor, city/landscape, etc.) Vailaya et al. use a Bayesian framework and obtain an average accuracy of 94.1% [3]. In [4] Gorkani et al. suggest an image classification method based on the most dominant orientation in the image’s texture. In fact, this feature a llows dif fere ntiating two final classes of images: city and landscape. Thus, they achieve a classification accuracy of 92.8%. Another approach was proposed by Prabhakar et al. in [5]. They used three low-level image descriptors (color, texture and edge information) to separate pictures and graphic images. Their algorithm reaches an accuracy rate of 96.6%. In [6] Schettini et al. aim to classify images into four classes (photographs, graphics, text and mixed docu- ments). Therefore, from every image, they extract six features which represent color descriptor, edge represen- tation, texture features, wavelet coefficients and skin color pixels percentage. This paper presents a system able to automatically classify a nd ar chivin g d oc u me nts i nto the fo ll o win g t hre e categories: photos, textual documents and mixed docu- ments. In Section 2, theoretic background of our approach is explained. Then in section 3, the experience plan is de- scribed, including data sets, experimental results and evaluation criteria, while in Section 4, results are dis- cussed and new perspectives are suggested. 2. Proposed System The system we propose allows discriminating documents into photographs, textual and mixed documents. It is based on two main stages (F ig ure 1): i) The features extraction: These features are extracted automatically from images using specific programs. For every single image, the values of these features will be used as coeffi- cients of a representative vector. ii) The classification and archiving mo dule : This i s o btaine d after trai ning a nd validating a model used to discriminate and store docu- ments. 2.1. Features Extraction Features selection is the key step leading to the success or failure of the classification phase. Therefore, several 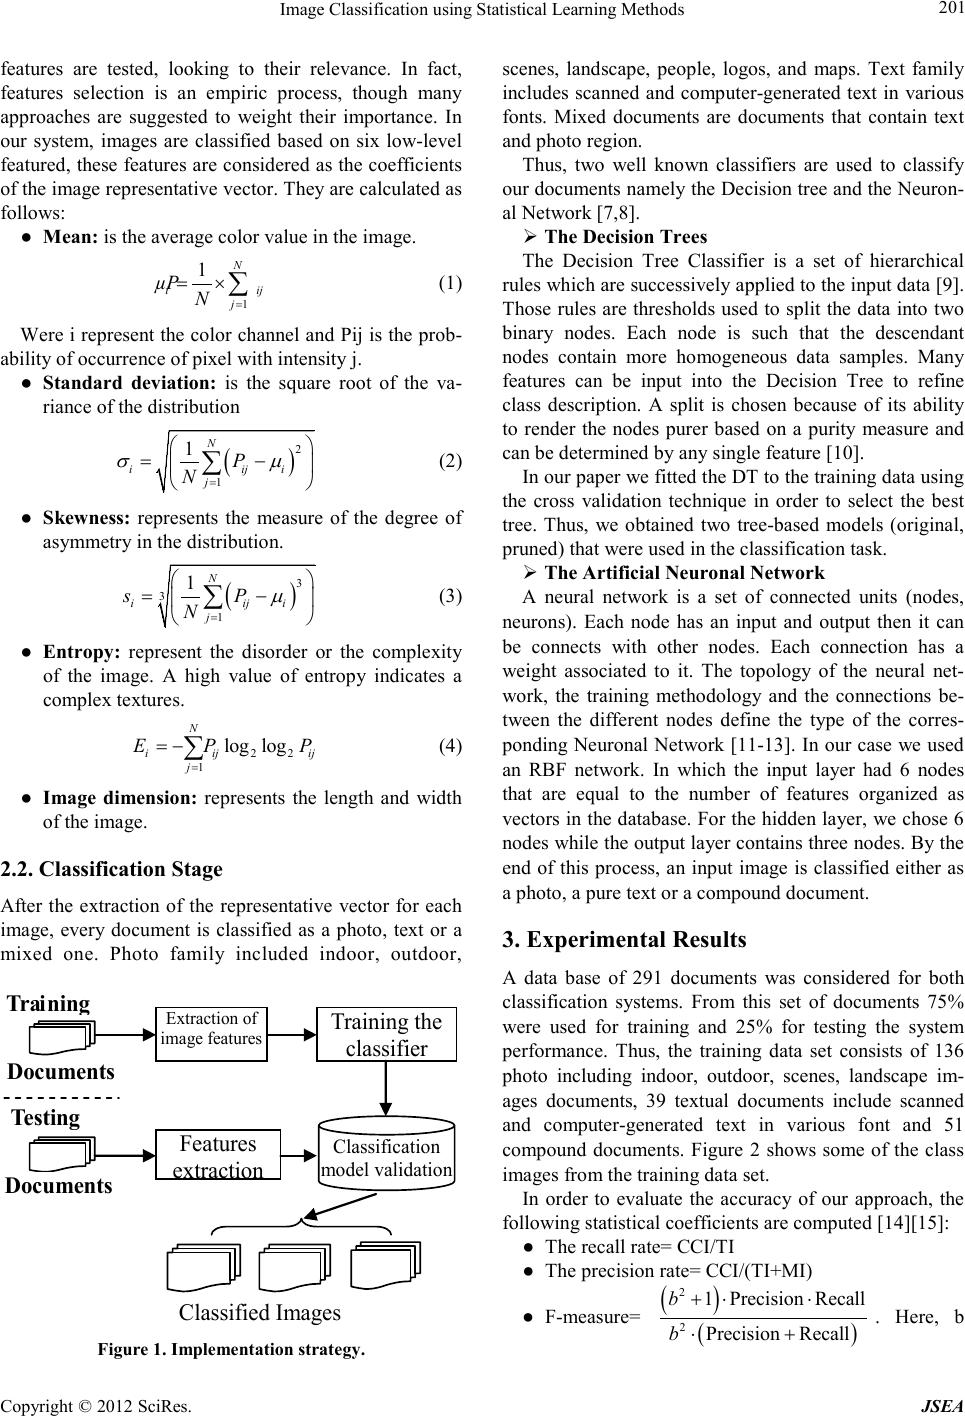 Image Classification using Statistical Learn ing Methods Copyright © 2012 SciR es. JSEA 201 features are tested, looking to their relevance. In fact, features selection is an empiric process, though many approaches are suggested to weight their importance. In our system, images are classified based on six low-level featured, these features are considered as the coefficients of the image representative vector. They are calculated as follows: ● Mean: is the average color value in the image. 1 1N i ij j µP N= = ×∑ (1) Were i represent the color channel and Pij is the pr ob- ability of occurrence of pixel wit h intensity j. ● Standard deviation: is the square root of the va- riance of the distr ibution ( ) 2 1 1 N iij i j P N σµ = = − ∑ (2) ● Skewn e ss: represents the measure of the degree of asymmetr y in t he distribution. ( ) 3 3 1 1N iij i j sP N µ = = − ∑ (3) ● Entropy: represent the disorder or the complexity of the image. A high value of entropy indicates a complex textur es. 22 1 log log N i ijij j EP P = = −∑ (4) ● Image dimension: represents the length and width of the image. 2.2. Classification Stage After the extraction of the representative vector for each image, every document is classified as a photo, text or a mixed one. Photo family included indoor, outdoor, Training Doc uments Testing Doc uments Extraction of image features Training the classifier Classification model validation Features extraction Classified Images Figure 1. Impleme ntation strategy. scenes, landscape, people, logos, and maps. Text family includes scanned and computer-generated text in various fonts. Mixed documents are documents that contain text and photo region. Thus, two well known classifiers are used to classify our doc ument s na mel y the De cisio n tre e a nd the Ne uron- al Network [7,8]. The Decision Trees The Decision Tree Classifier is a set of hierarchical rules which are successively applied to the input data [9]. Those rules are thresholds used to split the data into two binary nodes. Each node is such that the descendant nodes contain more homogeneous data samples. Many features can be input into the Decision Tree to refine class description. A split is chosen because of its ability to render the nodes purer based on a purity measure and can be determined by any single feature [10]. In our paper we fitted the DT to the training data using the cross validation technique in order to select the best tree. Thus, we obtained two tree-based models (original, pruned) that we re used in the classification task. The Artificial Neuronal Network A neural network is a set of connected units (nodes, neurons). Each node has an input and output then it can be connects with other nodes. Each connection has a weight associated to it. The topology of the neural net- work, the training methodology and the connections be- tween the different nodes define the type of the corres- ponding Ne uronal Network [11-13]. In our case we used an RBF network. In which the input layer had 6 nodes that are equal to the number of features organized as vectors in the database. For the hidden layer, we chose 6 node s while the outp ut l ayer co ntain s thre e node s. B y the end of this process, an input image is classified either as a photo, a pure text or a compound documen t. 3. Experimental Results A data base of 291 documents was considered for both classification systems. From this set of documents 75% were used for training and 25% for testing the system performance. Thus, the training data set consists of 136 photo including indoor, outdoor, scenes, landscape im- ages documents, 39 textual documents include scanned and computer-generated text in various font and 51 compound documents. Figure 2 shows some of the class images from the training data set. In order to evaluate the accuracy of our approach, the following statistical coef ficients are c omputed [14 ][15]: ● The recall rate= CCI/TI ● The precision rate= CCI/(TI+MI) ● F-measure= ( ) ( ) 2 2 1Precision Recall Precision Recall b b +⋅ ⋅ ⋅+ . Here, b 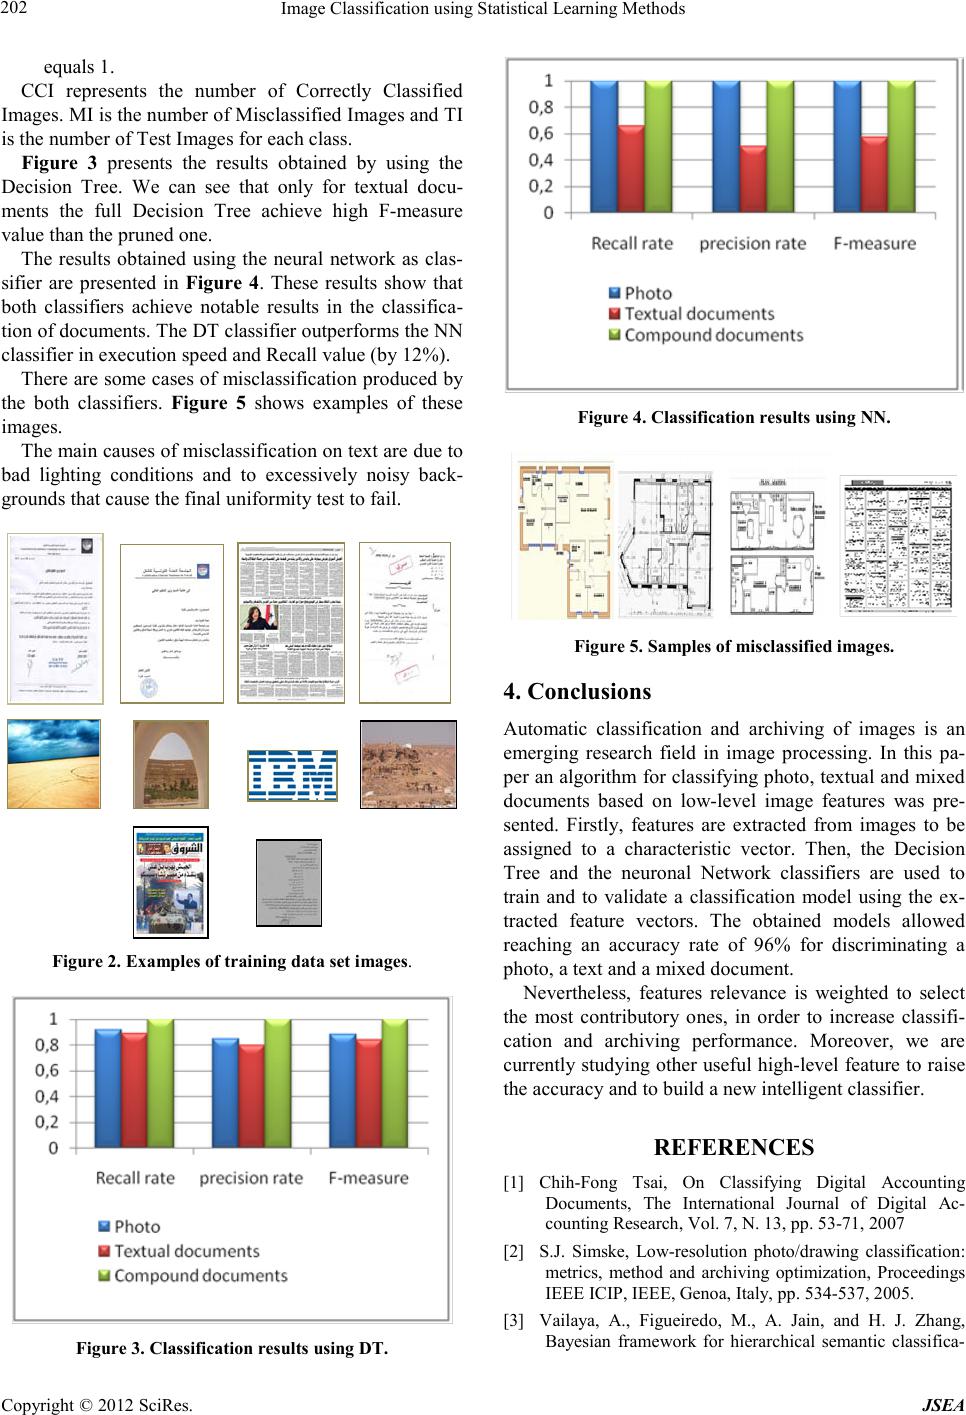 Image Classification us in g Statistical Learning Met hod s Copyright © 2012 SciR es. JSEA 202 equals 1. CCI represents the number of Correctly Classified Images. MI is the number of Misclassified Images and TI is the number of Test Images for each class. Figure 3 presents the results obtained by using the Decision Tree. We can see that only for textual docu- ments the full Decision Tree achieve high F-measure value than the p rune d one . The results obtained using the neural network as clas- sifier are presented in Fig ure 4. These results show that both classifiers achieve notable results in the classifica- tion of documents. The DT classifier outperforms the NN classifier in execution speed and Recall value (by 12%). There are some cases of misclassification produced by the both classifiers. Figure 5 shows examples of these images. The main causes of misclassification on text are due to bad lighting conditions and to excessively noisy back- grounds that cause the final unifor mity te st to fail. Figure 2 . Examples of training data set images. Figure 3. Classification results using DT. Figure 4. Classification results using NN. Figure 5 . Samples of mis classifi ed images. 4. Conclusions Automatic classification and archiving of images is an emerging research field in image processing. In this pa- per an algor ithm for cla ssifyi ng phot o, text ual a nd mixe d documents based on low-level image features was pre- sented. Firstly, features are extracted from images to be assigned to a characteristic vector. Then, the Decision Tree and the neuronal Network classifiers are used to train and to validate a classification model using the ex- tracted feature vectors. The obtained models allowed reaching an accuracy rate of 96% for discriminating a photo, a text and a mixed document. Nevertheless, features relevance is weighted to select the most contributory ones, in order to increase classifi- cation and archiving performance. Moreover, we are curr ently stud ying othe r usefu l high-level feature to raise the accuracy and to build a new intelligent classifier. REFERENCES [1] Chih-Fong Tsai, On Classifying Digital Accounting Documents, The International Journal of Digital Ac- counting Research, Vol. 7, N. 13, pp. 53-71, 2007 [2] S.J. Simske, Low-resolution photo/drawing classification: metrics, method and archiving optimization, Proceedings IEEE ICIP, IEEE, Genoa, Italy, pp. 534-537, 2005. [3] V ai l aya, A., Figueiredo, M., A. Jain, and H. J. Zhang, Bayesian framework for hierarchical semantic classifica- 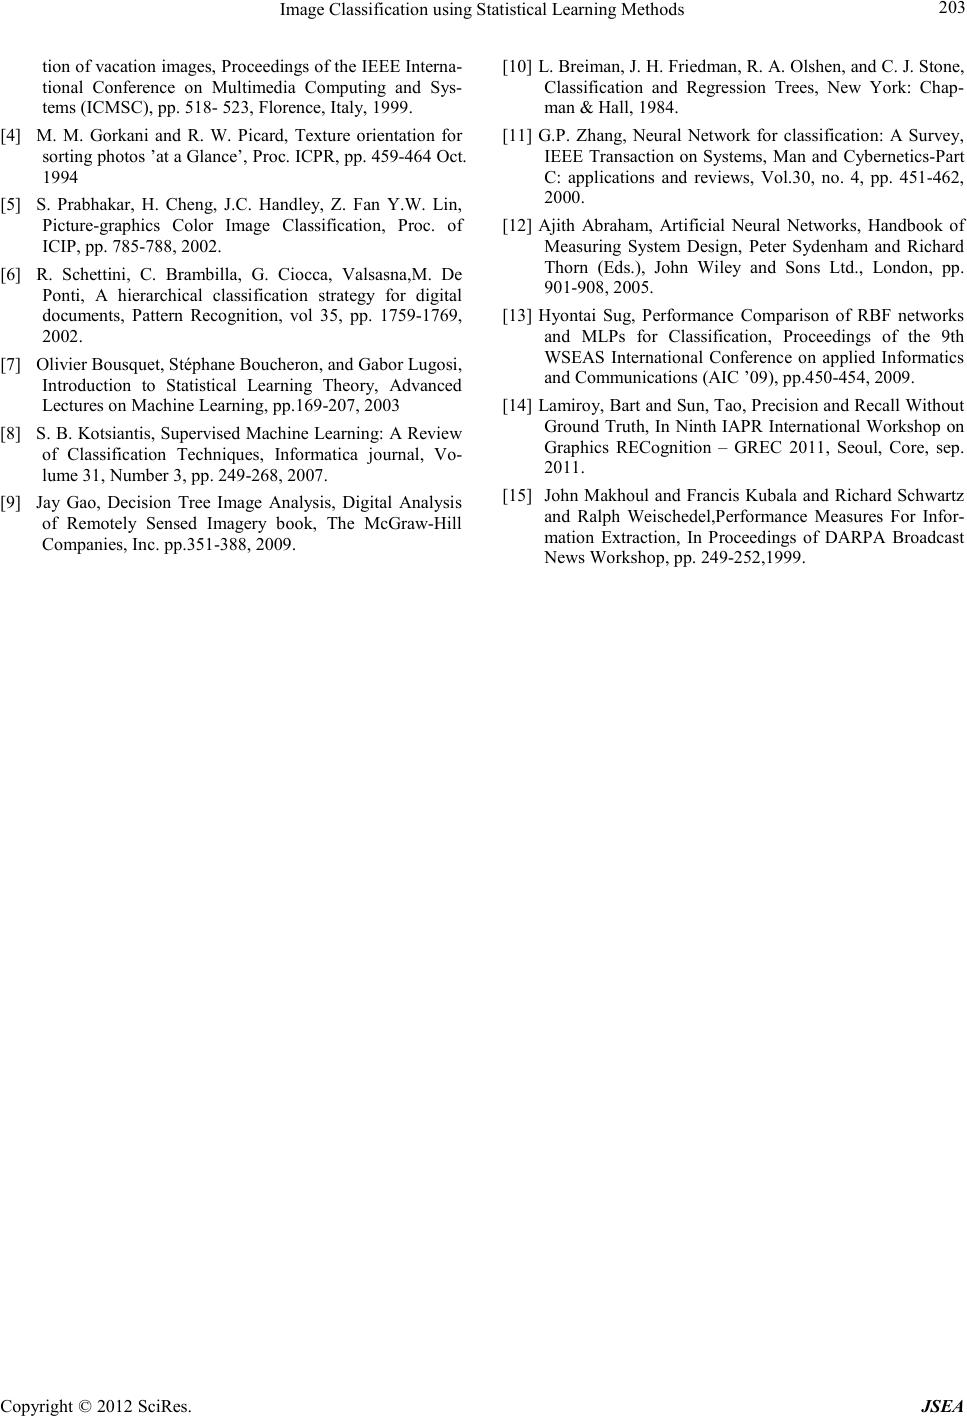 Image Classification using Statistical Learn ing Methods Copyright © 2012 SciR es. JSEA 203 tion o f vacation i mages, Proceed ings of th e IEEE Intern a- tional Conference on Multimedia Computing and Sys- tems (ICMSC), pp. 518- 523, Floren ce, Italy, 1999. [4] M. M. Gorkani and R. W. Picard, Texture orientation for sorting photos ’at a Glance’, Proc. ICPR, pp. 459-464 Oct. 1994 [5] S. Prabhakar, H. Cheng, J.C. Handley, Z. Fan Y.W. Lin, P icture-graphics Color Image Classification, Proc. of ICIP, pp. 785-788, 2002. [6] R. Schettini, C. Brambilla, G. Ciocca, Valsasna,M. De Ponti, A hierarchical classification strategy for digital documents, Pattern Recognition, vol 35, pp. 1759-1769, 2002. [7] Olivier Bousquet, Stéphane Boucheron, and Gabor Lugosi, Introduction to Statistical Learning Theory, Advanced Lectures on Machine Learning, pp.169-207, 20 03 [8] S. B. Kotsiant is, Supervised M achine Learni ng: A Review of Classification Techniques, Informatica journal, Vo- lume 31, Number 3, pp. 249-268, 200 7. [9] Jay Gao, Decision Tree Image Analysis, Digital Analysis of Remotely Sensed Imagery book, The McGraw-Hill Companies, Inc. pp.351-388, 200 9. [10] L. Breiman, J. H. Friedman, R. A. Olshen, and C. J. Stone, Classification and Regression Trees, New York: Chap- man & Hall, 1984. [11] G.P. Zhang, Neural Network for classification: A Survey, IEEE Transaction on Systems, Man and Cybernetics-Part C: applications and reviews, Vol.30, no. 4, pp. 451-462, 2000. [12] Ajith Abraham, Artificial Neural Networks, Handbook of Measuring System Design, Peter Sydenham and Richard Thorn (Eds.), John Wiley and Sons Ltd., London, pp. 901-908, 2005. [13] Hyontai Sug, Performance Comparison of RBF networks and MLPs for Classification, Proceedings of the 9th WSEAS International Conference on applied Informatics and Communications (AIC ’09), pp.450-454, 2009. [14] Lamiroy, Bart and Sun, Tao, Precision and Recall Without Ground Truth, In Ninth IAPR International Workshop on Graphics RECognition – GREC 2011, Seoul, Core, sep. 2011. [15] John Makhoul and Francis Kubala and Richard Schwartz and Ralph Weischedel,Performance Measures For Infor- mation Extraction, In Proceedings of DARPA Broadcast News Workshop, pp. 249-252,1999. |