Paper Menu >>
Journal Menu >>
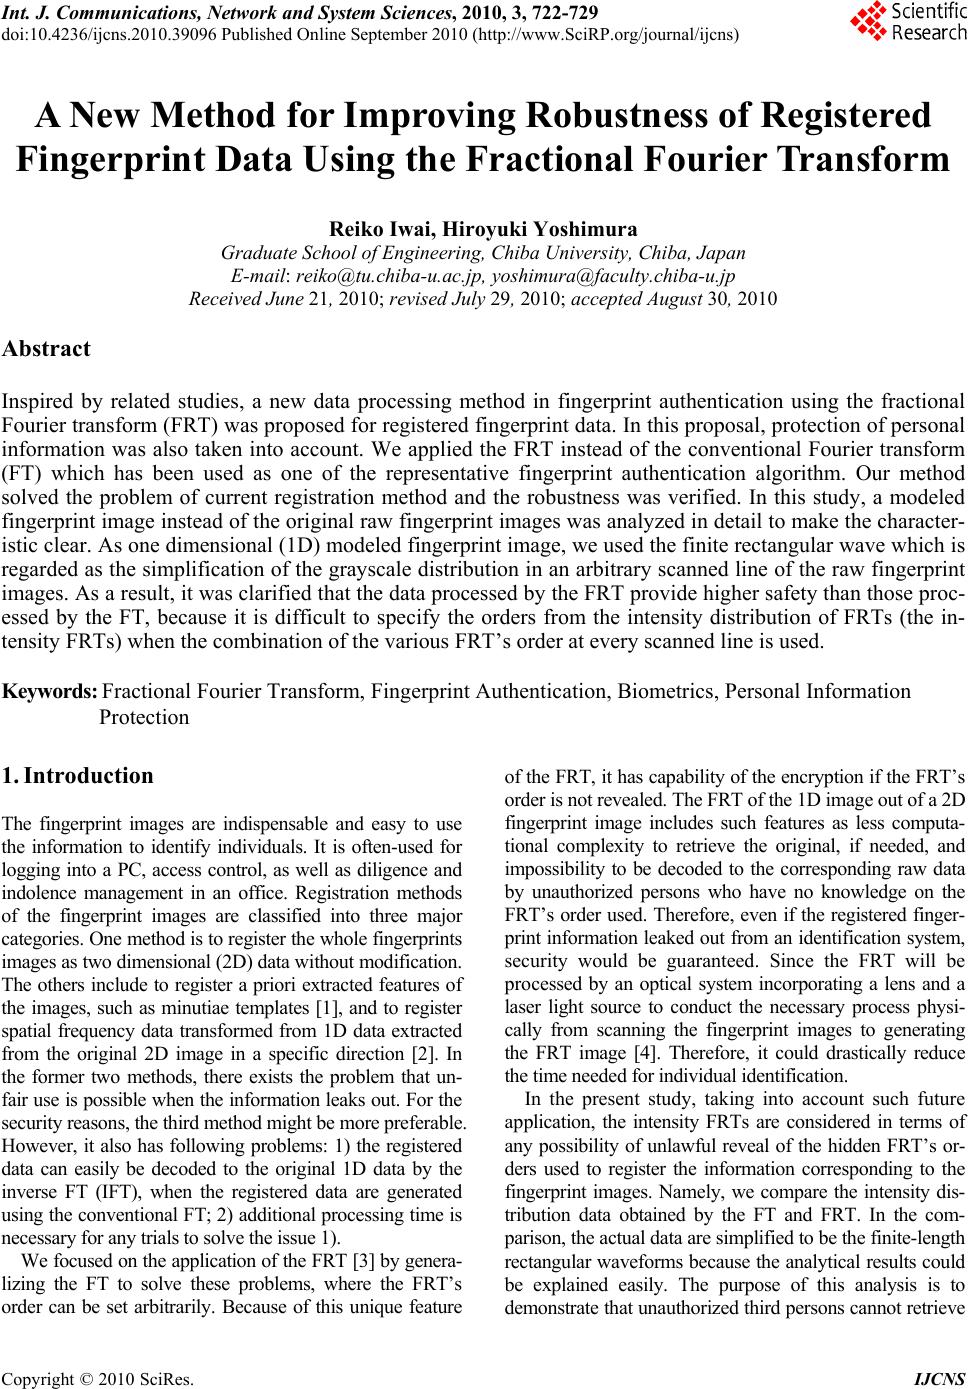 Int. J. Communications, Network and System Sciences, 2010, 3, 722-729 doi:10.4236/ijcns.2010.39096 Published Online September 2010 (http://www.SciRP.org/journal/ijcns) Copyright © 2010 SciRes. IJCNS A New Method for Improving Robustness of Registered Fingerprint Data Using the Fractional Fourier Transform Reiko Iwai, Hiroyuki Yoshimura Graduate School of Engineering, Chiba University, Chiba, Japan E-mail: reiko@tu.chiba-u.ac.jp, yoshimura@faculty.chiba-u.jp Received June 21, 2010; revised July 29, 2010; accepted August 30, 2010 Abstract Inspired by related studies, a new data processing method in fingerprint authentication using the fractional Fourier transform (FRT) was proposed for registered fingerprint data. In this proposal, protection of personal information was also taken into account. We applied the FRT instead of the conventional Fourier transform (FT) which has been used as one of the representative fingerprint authentication algorithm. Our method solved the problem of current registration method and the robustness was verified. In this study, a modeled fingerprint image instead of the original raw fingerprint images was analyzed in detail to make the character- istic clear. As one dimensional (1D) modeled fingerprint image, we used the finite rectangular wave which is regarded as the simplification of the grayscale distribution in an arbitrary scanned line of the raw fingerprint images. As a result, it was clarified that the data processed by the FRT provide higher safety than those proc- essed by the FT, because it is difficult to specify the orders from the intensity distribution of FRTs (the in- tensity FRTs) when the combination of the various FRT’s order at every scanned line is used. Keywords: Fractional Fourier Transform, Fingerprint Authentication, Biometrics, Personal Information Protection 1. Introduction The fingerprint images are indispensable and easy to use the information to identify individuals. It is often-used for logging into a PC, access control, as well as diligence and indolence management in an office. Registration methods of the fingerprint images are classified into three major categories. One method is to register the whole fingerprints images as two dimensional (2D) data without modification. The others include to register a priori extracted features of the images, such as minutiae templates [1], and to register spatial frequency data transformed from 1D data extracted from the original 2D image in a specific direction [2]. In the former two methods, there exists the problem that un- fair use is possible when the information leaks out. For the security reasons, the third method might be more preferable. However, it also has following problems: 1) the registered data can easily be decoded to the original 1D data by the inverse FT (IFT), when the registered data are generated using the conventional FT; 2) additional processing time is necessary for any trials to solve the issue 1). We focused on the application of the FRT [3] by genera- lizing the FT to solve these problems, where the FRT’s order can be set arbitrarily. Because of this unique feature of the FRT, it has capability of the encryption if the FRT’s order is not revealed. The FRT of the 1D image out of a 2D fingerprint image includes such features as less computa- tional complexity to retrieve the original, if needed, and impossibility to be decoded to the corresponding raw data by unauthorized persons who have no knowledge on the FRT’s order used. Therefore, even if the registered finger- print info rmation leak ed out fro m an iden tification s ystem, security would be guaranteed. Since the FRT will be processed by an optical system incorporating a lens and a laser light source to conduct the necessary process physi- cally from scanning the fingerprint images to generating the FRT image [4]. Therefore, it could drastically reduce the time needed for individual identification. In the present study, taking into account such future application, the intensity FRTs are considered in terms of any possibility of unlawful reveal of the hidden FRT’s or- ders used to register the information corresponding to the fingerprint images. Namely, we compare the intensity dis- tribution data obtained by the FT and FRT. In the com- parison, the actual data are simplified to be the finite-length rectangular waveforms because th e analytical results could be explained easily. The purpose of this analysis is to demonstrate that unauthorized third persons cannot retrieve 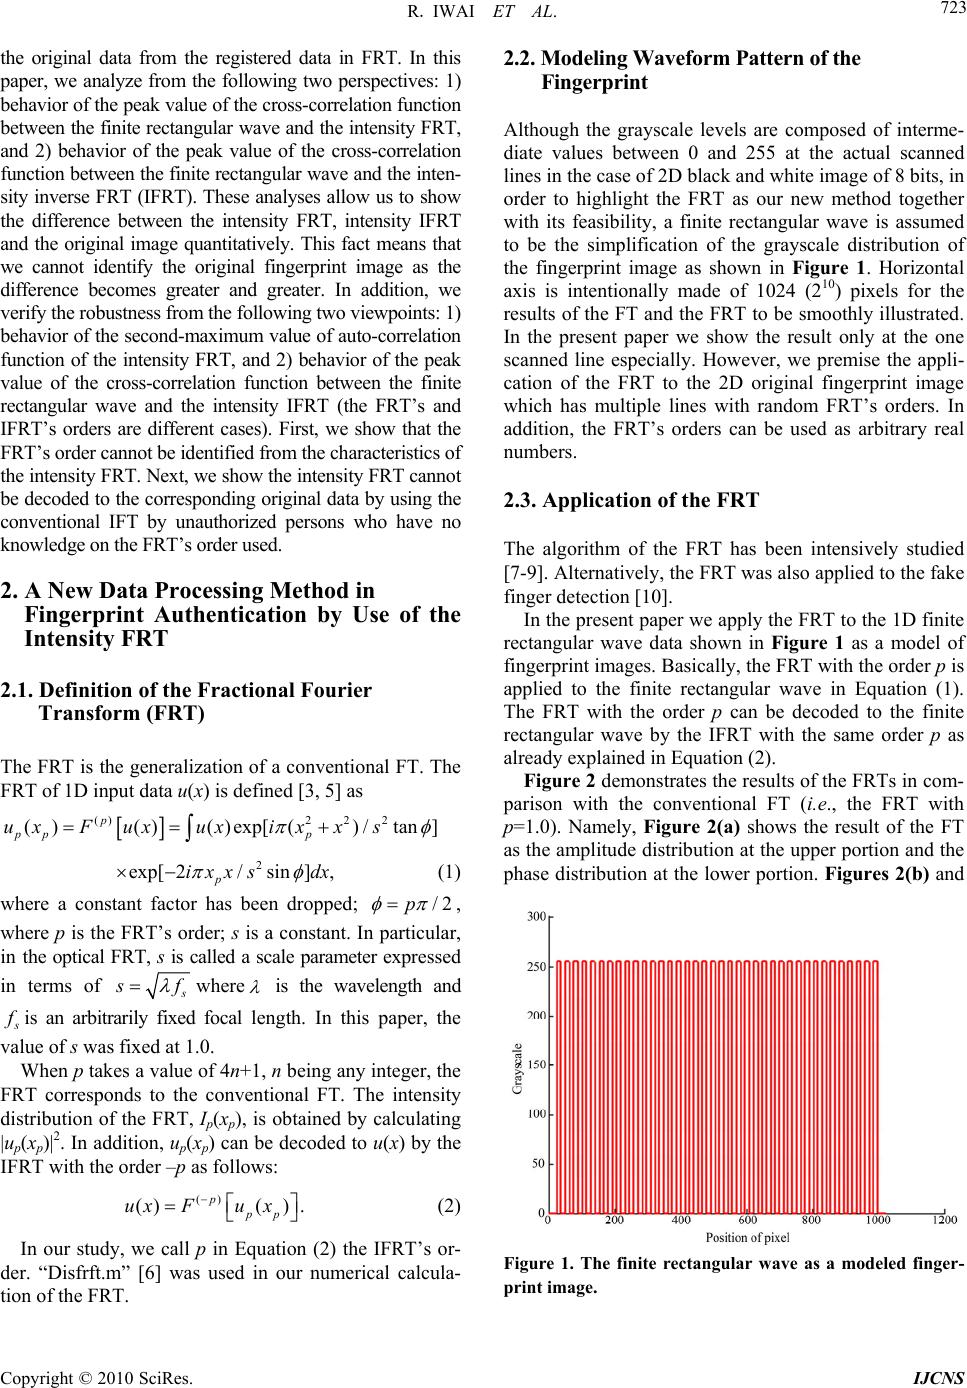 R. IWAI ET AL. Copyright © 2010 SciRes. IJCNS 723 the original data from the registered data in FRT. In this paper, we analyze from the following two perspectives: 1) behavior of the peak value of the cross-correlation function between the finite rectangular wave and the intensity FRT, and 2) behavior of the peak value of the cross-correlation function between the finite rectangular wave and the inten- sity inverse FRT (IFRT). Th ese analyses allow us to show the difference between the intensity FRT, intensity IFRT and the original image quantitatively. This fact means that we cannot identify the original fingerprint image as the difference becomes greater and greater. In addition, we verify the robustness from the following two viewpoints: 1) behavior of the second-maximum value of auto-correlation function of the intensity FRT, and 2) behavior of the peak value of the cross-correlation function between the finite rectangular wave and the intensity IFRT (the FRT’s and IFRT’s orders are different cases). First, we show that the FRT’s order cannot be identified from the characteristics of the intens ity F RT. Next, we s how th e inten sit y FRT canno t be decoded to the corresponding original data by using the conventional IFT by unauthorized persons who have no knowledge on the FRT’s order used. 2. A New Data Processing Method in Fingerprint Authentication by Use of the Intensity FRT 2.1. Definition of the Fractional Fourier Transform (FRT) The FRT is the generalization of a conventional FT. The FRT of 1D input data u(x) is defined [3, 5] as ()2 2 2 ()()()exp[ ()/tan] p pp p uxFuxuxix xs 2 exp[ 2/sin], p ixxs dx (1) where a constant factor has been dropped; /2p , where p is the FRT’s order; s is a constant. In particular, in the optical FRT, s is called a scale parameter expressed in terms of s s f where is the wavelength and s f is an arbitrarily fixed focal length. In this paper, the value of s was fixe d at 1 .0. When p takes a value of 4n+1, n be ing any integ er, the FRT corresponds to the conventional FT. The intensity distribution of the FRT, Ip(xp), is obtained by calculating |up(xp)|2. In addition, up(xp) can be decoded to u(x) by the IFRT with the order –p as follows: () ()( ). ppp uxFu x (2) In our study, we call p in Equation (2) the IFRT’s or- der. “Disfrft.m” [6] was used in our numerical calcula- tion of the FRT. 2.2. Mo deling W ave form P atte rn of t he Fingerprint Although the grayscale levels are composed of interme- diate values between 0 and 255 at the actual scanned lines in the case of 2D black and white image of 8 bits, in order to highlight the FRT as our new method together with its feasibility, a finite rectangular wave is assumed to be the simplification of the grayscale distribution of the fingerprint image as shown in Figure 1. Horizontal axis is intentionally made of 1024 (210) pixels for the results of the FT and the FRT to be smoothly illustrated. In the present paper we show the result only at the one scanned line especially. However, we premise the appli- cation of the FRT to the 2D original fingerprint image which has multiple lines with random FRT’s orders. In addition, the FRT’s orders can be used as arbitrary real numbers. 2.3. Application of the FRT The algorithm of the FRT has been intensively studied [7-9]. Alternatively, the FRT was also applied to the fake finger detectio n [1 0]. In the present paper we apply the FRT to the 1D finite rectangular wave data shown in Figure 1 as a model of fingerprint images. Basically, the FRT with the order p is applied to the finite rectangular wave in Equation (1). The FRT with the order p can be decoded to the finite rectangular wave by the IFRT with the same order p as already explained in Equation (2). Figure 2 demonstrates the results of the FRTs in com- parison with the conventional FT (i.e., the FRT with p=1.0). Namely, Figure 2(a) shows the result of the FT as the amplitude distribution at the upper portion and the phase distribution at the lower portion. Figures 2(b) and Figure 1. The finite rectangular wave as a modeled finger- print image. 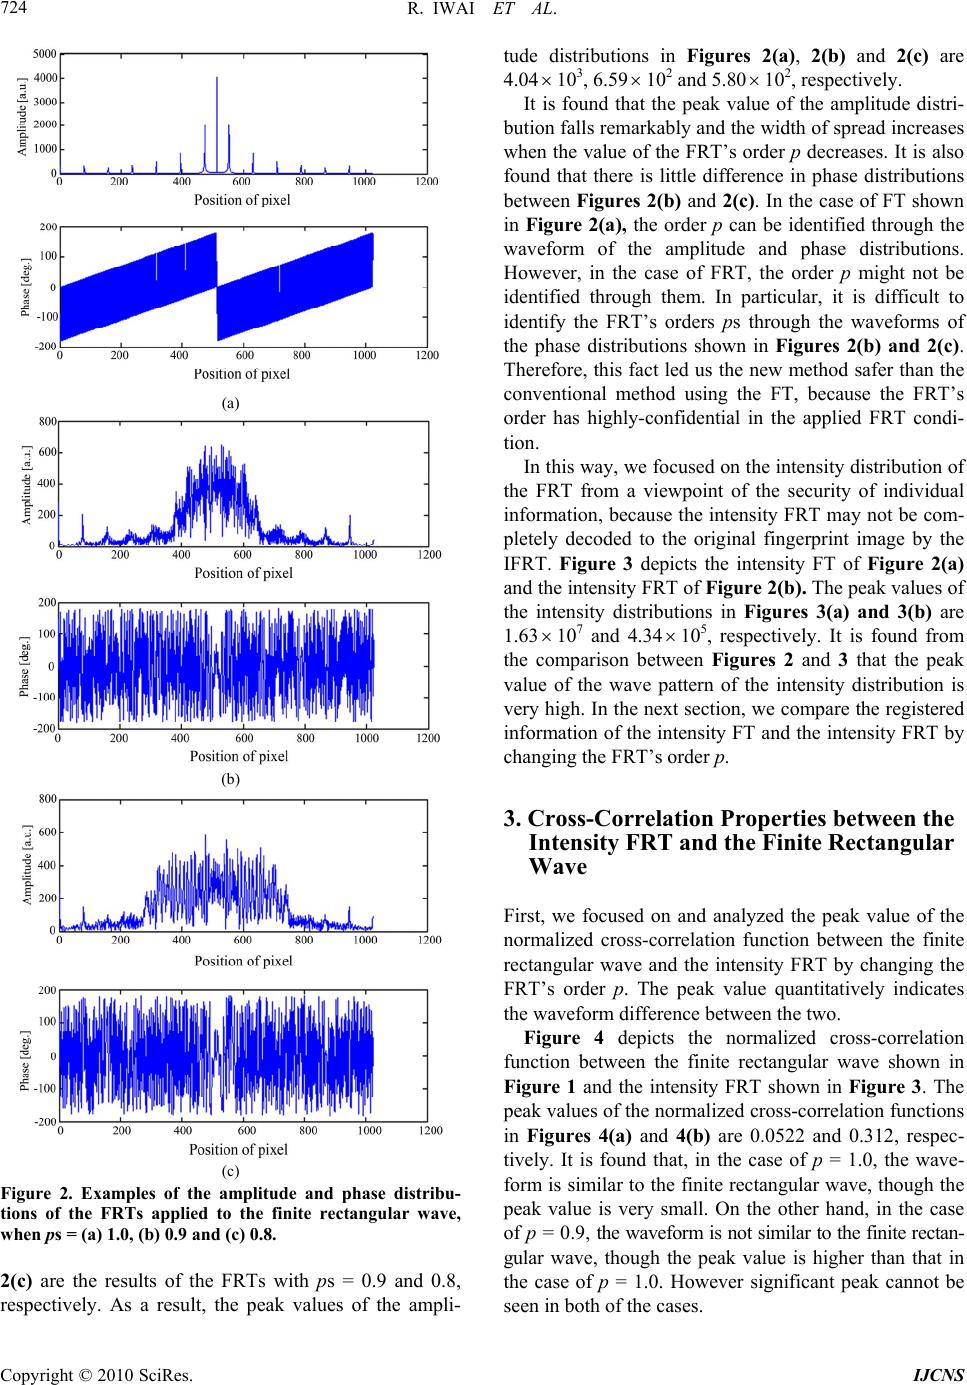 R. IWAI ET AL. Copyright © 2010 SciRes. IJCNS 724 (a) (b) (c) Figure 2. Examples of the amplitude and phase distribu- tions of the FRTs applied to the finite rectangular wave, when ps = (a) 1.0, (b) 0.9 and (c) 0.8. 2(c) are the results of the FRTs with ps = 0.9 and 0.8, respectively. As a result, the peak values of the ampli- tude distributions in Figures 2(a), 2(b) and 2(c) are 4.04 103, 6.59 102 and 5.80102, respectively. It is found that the peak value of the amplitude distri- bution falls remarkably and the width of spread increases when the value of the FRT’s order p decreases. It is also found that there is little difference in phase distributions between Figures 2(b) and 2(c). In the case of FT shown in Figure 2(a), the order p can be identified through the waveform of the amplitude and phase distributions. However, in the case of FRT, the order p might not be identified through them. In particular, it is difficult to identify the FRT’s orders ps through the waveforms of the phase distributions shown in Figures 2(b) and 2(c). Therefore, this fact led us the new method safer than the conventional method using the FT, because the FRT’s order has highly-confidential in the applied FRT condi- tion. In this way, we focused on the intensity distribu tion of the FRT from a viewpoint of the security of individual information, because the intensity FRT may not be com- pletely decoded to the original fingerprint image by the IFRT. Figure 3 depicts the intensity FT of Figure 2(a) and the intensity FRT of Figure 2(b). The peak values of the intensity distributions in Figures 3(a) and 3(b) are 1.63 107 and 4.34 105, respectively. It is found from the comparison between Figures 2 and 3 that the peak value of the wave pattern of the intensity distribution is very high. In the next section, we compare the registered information of the inten sity FT and the intensity FRT by changing the FRT’s order p. 3. Cross-Correlation Properties between the Intensity FRT and the Finite Rectangular Wave First, we focused on and analyzed the peak value of the normalized cross-correlation function between the finite rectangular wave and the intensity FRT by changing the FRT’s order p. The peak value quantitatively indicates the waveform difference between the two. Figure 4 depicts the normalized cross-correlation function between the finite rectangular wave shown in Figure 1 and the intensity FRT shown in Figure 3. The peak values of the normalized cross-correlation functions in Figures 4(a) and 4(b) are 0.0522 and 0.312, respec- tively. It is found that, in the case of p = 1.0, the wave- form is similar to the finite rectangular wave, though the peak value is very small. On the other hand, in the case of p = 0.9 , the waveform is not similar to the finite rectan- gular wave, though the peak value is higher than that in the case of p = 1.0. However significant peak cannot be seen in both of the cases. 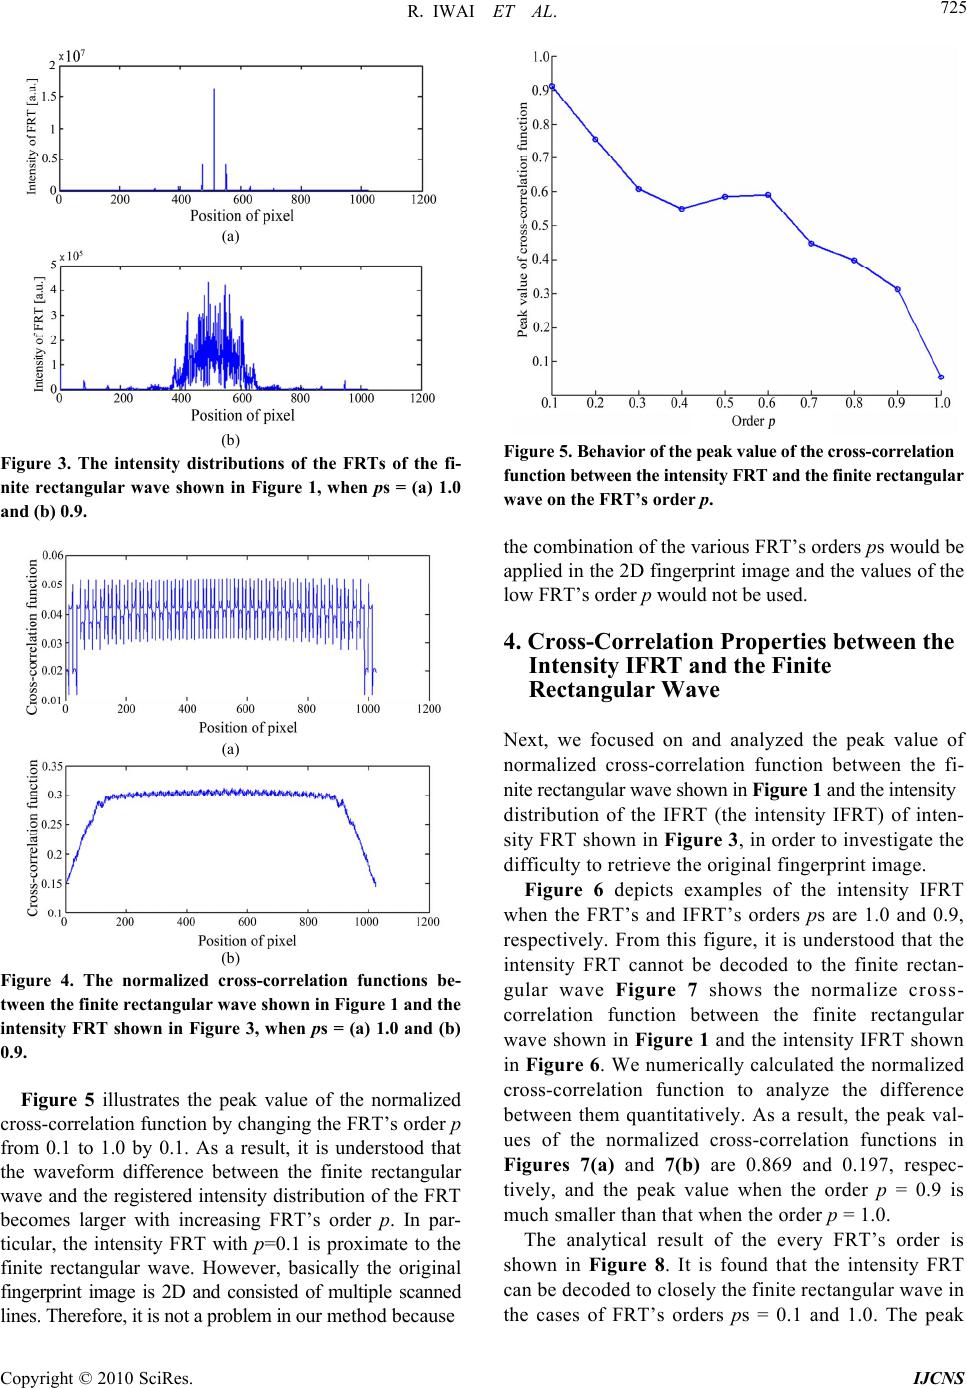 R. IWAI ET AL. Copyright © 2010 SciRes. IJCNS 725 (a) (b) Figure 3. The intensity distributions of the FRTs of the fi- nite rectangular wave shown in Figure 1, when ps = (a) 1.0 and (b) 0.9. (a) (b) Figure 4. The normalized cross-correlation functions be- tween the finite rectangular wave shown in Figure 1 and the intensity FRT shown in Figure 3, when ps = (a) 1.0 and (b) 0.9. Figure 5 illustrates the peak value of the normalized cross-correlation function by changing the FRT’s order p from 0.1 to 1.0 by 0.1. As a result, it is understood that the waveform difference between the finite rectangular wave and the registered intensity d istribution of the FRT becomes larger with increasing FRT’s order p. In par- ticular, the intensity FRT with p=0.1 is proximate to the finite rectangular wave. However, basically the original fingerprint image is 2D and consisted of multiple scanned lines. Therefore, it is not a problem in our method because Figure 5. Behavior of the peak value of the cross-correlation function between the in tensity FRT and th e finite rectangular wave on the FRT’s order p. the combination of the various FRT’s orders ps would be applied in the 2D fingerprint image and the values of the low FRT’s order p would not be use d. 4. Cross-Correlation Properties between the Intensity IFRT and the Finite Rectangular Wave Next, we focused on and analyzed the peak value of normalized cross-correlation function between the fi- nite rectangular wave shown in Figure 1 and the intensity distribution of the IFRT (the intensity IFRT) of inten- sity FRT shown in Figure 3, in order to investigate the difficult y to r etr ieve the o rig inal f ingerp rint image. Figure 6 depicts examples of the intensity IFRT when the FRT’s and IFRT’s orders ps are 1.0 and 0.9, respectively. From this figure, it is understood that the intensity FRT cannot be decoded to the finite rectan- gular wave Figure 7 shows the normalize cross- correlation function between the finite rectangular wave shown in Figure 1 and the intensity IFRT shown in Figure 6. We numerically calculated the normalized cross-correlation function to analyze the difference between them quantitatively. As a result, the peak val- ues of the normalized cross-correlation functions in Figures 7(a) and 7(b) are 0.869 and 0.197, respec- tively, and the peak value when the order p = 0.9 is much smaller than that when the order p = 1.0. The analytical result of the every FRT’s order is shown in Figure 8. It is found that the intensity FRT can be decoded to closely the finite rectangular wave in the cases of FRT’s orders ps = 0.1 and 1.0. The peak  R. IWAI ET AL. Copyright © 2010 SciRes. IJCNS 726 (a) (b) Figure 6. Examples of the intensity IFRT of the intensity FRT shown in Figure 3, when the FRT’s and IFRT’s orders ps = (a) 1.0 and (b) 0.9. (a) (b) Figure 7. The normalized cross-correlation function be- tween the finite rectangular wave shown in Figure 1 and the intensity IFRT shown in Figure 6, when the FRT’s and IFRT’s orders ps = (a) 1.0 and (b) 0.9. value of the normalized cross-correlation function when the order p=1.0 becomes drastically high as shown in Figure 8. It is understood from Figure 6 (a) that the intensity FR T in the cas e of FRT’s order p=1.0 can be decoded to closely the finite rectangular wave. However, it may not be decoded to the finite rectangu- lar wave in the cases of the other FRT’s orders ps. As Figure 8. Behavior of the peak value of the normalized cross-correlation functions between the intensity IFRT and the finite rectangular wave when the IFRT’s order p is the same as the FRT’s order p. described previously in Section 3, in our method, the combination of the various FRT’s orders ps would be applied and the FRT’s order p = 1.0 and the low FRT’s order p would not be used. Therefore, it is clarified that the data processed by the FRT would provide higher safety than the cases processed only by the FT. 5. Verification of Robustness Finally, we verify the robustness of our proposed method from the following two viewpoints: 1) behavior of the second-maximum value of auto-correlation func- tion of the intensity FRT, and 2) behavior of the peak value of the cross-correlation function between the finite rectangular wave and the intensity IFRT (the FRT’s and IFRT’s orders are different cases). First, we show the FRT’s order cannot be identified from the characteristics of the intensity FRT. Next, we show the intensity FRT cannot be decoded to the finite rectangular wave by using the conventional IFT by unauthorized persons who have no knowledge on the FRT’s orders used. 5.1. The Order Dependency on the Second- Maximum Values of the Auto-Correlation Function of the Intensity FRT First, we focused on and analyzed the second-maximum value of the auto-correlation function of the intensity distribution of the FRT by changing the order p, be- cause the peak values of the auto-correlation functions are all 1 and are not distinguishable. Figure 9 depicts examples of the auto-correlation function of the intensity distribution of the FRT when the FRT’s orders ps = 1.0 and 0.9 shown in Figure 3. Order p  R. IWAI ET AL. Copyright © 2010 SciRes. IJCNS 727 As a result, the second-maximum values in Figures 9(a) and 9(b) are 0.501 and 0.390, respectively. Figure 10 illustrates the FRT’s order dependency on the second-maximum value of the auto-correlation function by changing the order p. The second maxi- mum peak values for the FRT’s orders from 0.1 to 1.0 by 0.1 are 0.180, 0.223, 0.191, 0.179, 0.145, 0.225, 0.299, 0.359, 0.390 and 0.501, respectively. In par- ticular, the second-maximum peak value is the smallest when the FRT’s order p = 0.5. The reason can be con- sidered that the intensity FRT equally includes both of the characteristics of the spatial information and spatial frequency information of the finite rectangular wave when the FRT’s order p = 0.5. As a result, it is shown that the FRT’s order cannot be found from the characteristics of the intensity FRT, because we cannot see noticeable difference in the second-maximum values in any cases of FRT’s order p. (a) (b) Figure 9. The normalized auto-correlation functions of the intensity FRTs shown in Figure 3, when ps = (a) 1.0 and (b) 0.9. Figure 10. Dependence of the second-maximum value of the normalized auto-correlation functions on th e FRT’s order p. 5.2. Cross-Correlation Properties between the Intensity IFRT and the Finite Rectangular Wave (The FRT’s and the IFRT’s Orders are Different Cases) Next, we focused on and analyzed the peak values of normalized cross-correlation function between the finite rectangular wave and the intensity IFRT of intensity FRT, when the FRT’s and IFRT’s orders are different from each other. In particular, we fixed the IFRT’s order at 1.0 which corresponds to the conventional IFT. Figure 11 depicts examples of the intensity IFRT of intensity FRT when the FRT’s and IFRT’s orders ps are (a) 0.9 and 1.0 and (b) 0.8 and 1.0, respectively. As a result, it is understood that the waveforms are completely different from the finite rectangular wave. Figure 12 shows the normalized cross-correlation function between the finite rectangular wave shown in Figure 1 and the intensity IFRT shown in Figure 11. As a result, the peak values in Figures 11(a) and 11( b) are 0.135 and 0.0579, respectively, and the peak values are very small for both of the FRT’s orders ps=0.9 and 0.8. The analytical result of every FRT’s order is shown in Figure 13. The peak values of the FRT’s orders from 0.1 to 0.9 by 0.1 are 0.0563, 0.0592, 0.0587, 0.0624, 0.0579, 0.0690, 0.0884, 0.107 and 0.135, respectively, and fully small. The peak value decreases with a decrease in the FRT’s order p when p takes a value from 0.9 to 0.5 by 0.1. However, the peak value is almost the same value when p takes a value from 0.5 to 0.1 by 0.1. The reason can be considered that the retrieving effect to the finite rectangular wave by the FT is very small when p=0.5 or less because the intensity FRT has little characteristics of the spatial frequency information of the finite rectangular wave. As a result, it is found that the intensity IFRT Order p Position of pixel  R. IWAI ET AL. Copyright © 2010 SciRes. IJCNS 728 (a) (b) Figure 11. Examples of the intensity IFRT of the intensity FRT shown in Figure 3, when the FRT’s and IFRT’s orders ps = (a) 0.9 and 1.0 and (b) 0.8 and 1.0, respectively. (a) (b) Figure 12. The normalized cross-correlation function be- tween the finite rectangular wave shown in Figure 1 and the intensity IFRT shown in Figure 11, when the FRT’s and IFRT’s orders ps = (a) 0.9 and 1.0 and (b) 0.8 and 1.0, re- spectively. cannot be decoded to the finite rectangular wave in all cases of the FRT’s orders ps. Moreover, it is understood by comparison between Figures 8 and 13 that the intensity FRT may not be de- coded to the finite rectangular wave for all FRT’s orders ps when the FRT’s and IFRT’s orders ps are different. Therefore, it is clarified that the data processed by the FRT would provide higher safety than the cases processed only by the FT. Figure 13. Behavior of the peak value of the normalized cross-correlation function between the finite rectangular wave and the intensity IFRT, when the IFRT’s order is fixed at 1.0 and the FRT’s orders ps are different from 1.0. From the above-mentioned results about the robust- ness of image processed by our method and the results shown in Figure 5 in Section 3 and Figure 8 in Section 4, we can say that th e most suitab le single valu e of the FRT’s order p is 0.9, though the combination of the various p at every scanned line of the raw fingerprint image is significant in our method. 6. Conclusions In the present study, we proposed a new data processing method for registering the fingerprint image by using the FRT. Moreover, the robustness was examined. In this study, our new method was analyzed in detail by using a modeled fingerprint image instead of the original raw fingerprint image to make the characteristic clear. As a result, it was found that our proposed method can register the fingerprint related data that cannot be easily de- coded to the corresponding original fingerprint data by unauthorized persons. In addition, our new method was performed by simple numerical calculation. Furthermore, it was understood that our new method has high robust- ness and security in the combination of the various FRT’s orders. As a further study, we would analyze the accuracy of our method for dust and sebum regarded as noise and hurts regarded as the lost part. 7. References [1] D. Maltoni, D. Maio, A. K. Ja in and S. Prabhakar, “Hand- book of Fingerprint Recognition,” Springer, New York, 2003. [2] H. Takeuchi, T. Umezaki, N. Matsumoto and K. Hiraba- yashi, “Evaluation of Low-Quality Images and Imaging Enhancement Methods for Fingerprint Verification,” Order p  R. IWAI ET AL. Copyright © 2010 SciRes. IJCNS 729 Electronics and Communications in Japan, Vol. 90, No. 10, 2007, pp. 40-53. [3] H. M. Ozakta s, Z. Zalevsky and M. A. Kutay, “The Frac- tional Fourier Transform,” John Wiley & Sons, New Jer- sey, 2001. [4] A. W. Lohmann, “Image Rotation, Wigner Rotation, and the Fractional Fourier Transform,” Journal of the Optical Society of America A, Vol. 10, No. 10, 1993, pp. 2181- 2186. [5] A Bultheel and H. E. Martinez Sulbaran, “Computation of the Fractional Fourier Transform,” Applied and Compu- tational Harmonic Analysis, Vol. 16, No. 3, 2004, pp. 182-202. [6] A.Bultheel and H. M. Sulbaran, “Computation of the Fractional Fourier Transform”. http://nalag.cs. kuleuven. be/research/software/FRFT/ [7] F. J. Marinho and L. M. Bernardo, “Numerical Calcula- tion of Fractional Fourier Transforms with a Single Fast- Fourier-Transform Algorithm,” Journal of Optical Society of America A, Vol. 15, No. 8, 1998, pp. 2111-2116. [8] X. Yang, Q. Tan, X. Wei, Y. Xiang, Y. Yan and G. Jin, “Improved Fast Fractional-Fourier Transform Algorithm,” Journal of Optical Society of America A, Vol. 21, No. 9, 2004, pp. 1677-1681. [9] D. H. Bailey and P. N. Swarztrauber, “The Fractional Fourier Transform and Applications,” SIAM Review, Vol. 33, No. 3, 1991, pp. 389-404. [10] H. Lee, H. Maeng and Y. Bae, “Fake Finger Detection Using the Fractional Fourier Transform,” Lecture Notes in Computer Science, Heidelberg, Vol. 5707, 2009, pp. 318-324. |