Multi-Sensor Ensemble System for Human Physical Activity Recognition
Copyright © 2012SciR es. JESA
2.3. Activity Recognition
For each single sensor, 7 time-domain features, namely
the 10th, 25th, 50th (median), 75th, and 90th per centiles,
the mean value, and the standard deviation, were ex-
tracted. In additio n, a correlation feature between the hip
accelerometer and the wrist accelerometer was also ex-
tracted, providing a measure for the coordination or vari-
ation between the upper limb and the body during an
activity. For each accelerometer, two frequency domain
features, energy and entrop y were extracted. For the ven-
tilation senso r, the dominant f requency of the resp iratory
signal obtained from a spectral analysis was extracted as
the breathing frequency. These features were computed
for every 30-second data segment, and linear scaling was
then applied to the extracted features in the range of [0,
1], to avoid that features of greater numeric values would
overwhelm those in the smaller numeric ranges.As a re-
sult, a total of 63 features (50 time-domain and 13 fre-
quency-domain features) were extracted. To achieve the
diversity of the input of each classifier, 70% of the fea-
tures were selected randomly from the overall feature
sets for training classifiers.
The SVM algorithm was chosen as the base classifier
of the ensemble system, and the selected features were
used as inputs to the SVM classifier. A two-step proce-
dure was taken for pr edicting the types of physical activ-
ity. First, a training data set that consists of the selected
features from all the 56 subjects but one was constructed
for building the SVM model and selecting the penalty
parameter and Gaussian kernel parameter. The model
parameters were selected through a “grid-search” with
5-fold cross validation. The parameters that yielded the
highest recognition rate were chosen during the process.
Second, upon completion of the training, the SVM model
was applied to the feature set of the subject that was left
out in the training process, to predict the activity type
reflected in the 30-second data segments. Such a two-
step procedure constitutes a “leave-one -subject-out” cross
validation, and was executed on each subject data.
3. Experimental Evaluation
3.1. Design of Experiments
A total of 56 subjects (26 male and 30 female) were re-
cruited forphysical activity assessment, with the follo w -
ing characteristics, expressed in terms of the mean ±
standard de viation:
1) age = 38.7±11.6 years,
2) mass = 71.1±14.5 kg,
3) height = 169.3±9.1 cm and
4) body mass index = 24.7±4.2 kg/m2.
Each subject performed 6 types of activities of varying
intensities, which are commonly seen in daily lives as
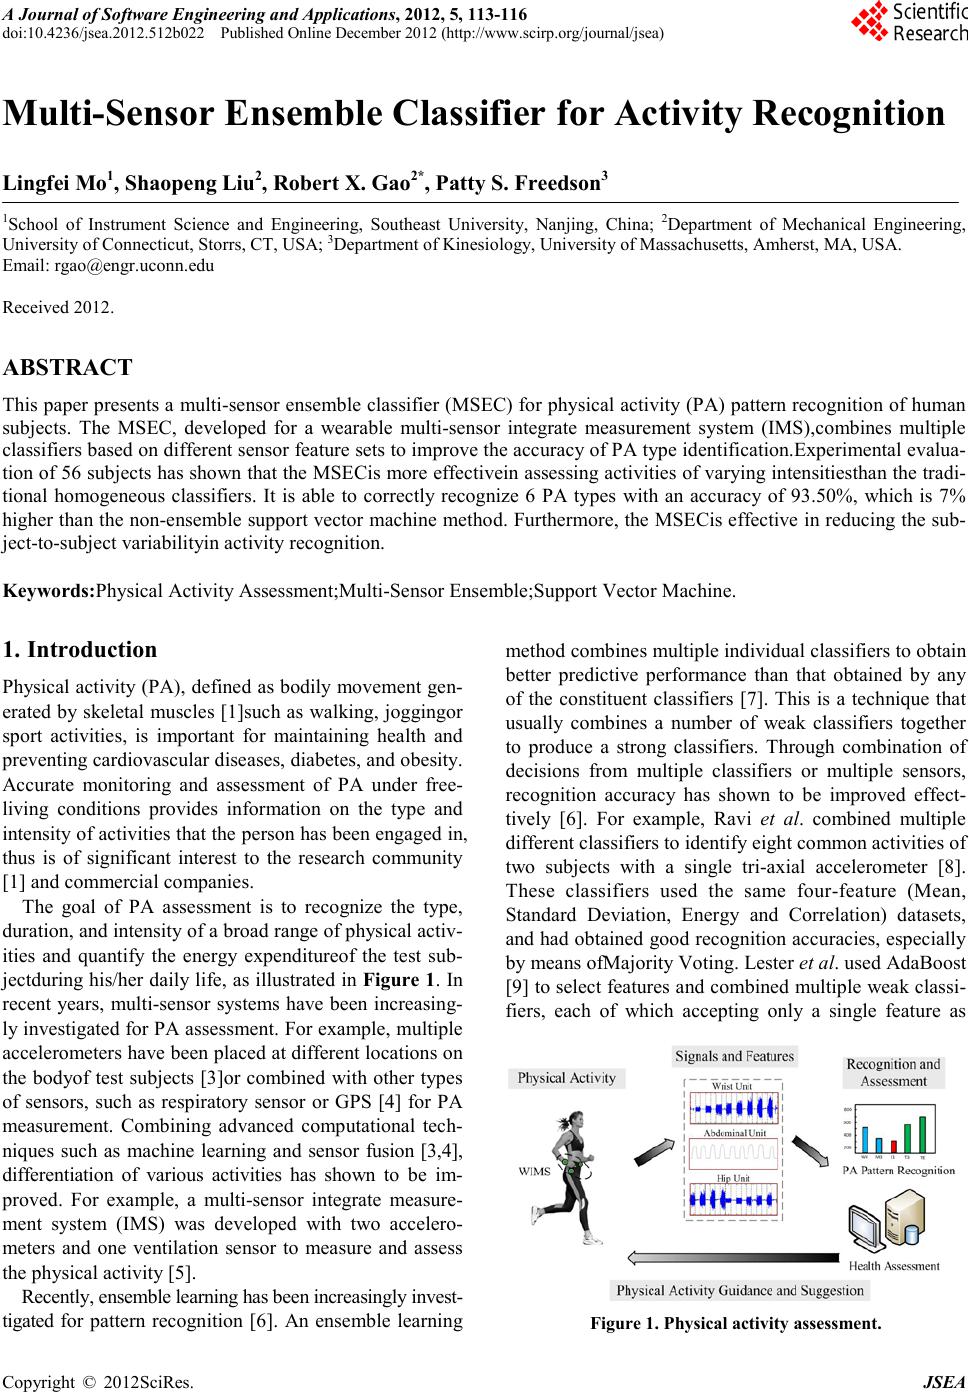
illustratedin Table 1. For each subject, the actual PA
types and times performed by the subjects were recorded,
and sensor data whendifferent PA types were performed
were collected by the IMS (as shown in Figure 2) cor-
respondingly [7]. Each PA type was performed for 7
minutes, followed b y a 2-minute rest period.
3.2. Individual Classifier Results
In order to ensemble different classifiers by the instance
specific weight majority voting method,it is necessary to
first investigatethe accuracies of the different classifier
clusters. Furthermore, since these classifiers use features
from different sensor datasets, they yield different accu-
racies and confidences on identifying the PA types. The
average accuracies of the classifiers on the different PA
types are first calculated, as s hown in Table 2. It i s seen
that these classifiers have yielded different accuracies on
PA type identifications, which is due to the fact that dif-
ferent sensor combinations are sensitive to different PA
t yp e s.
3.3. Ensemble Results
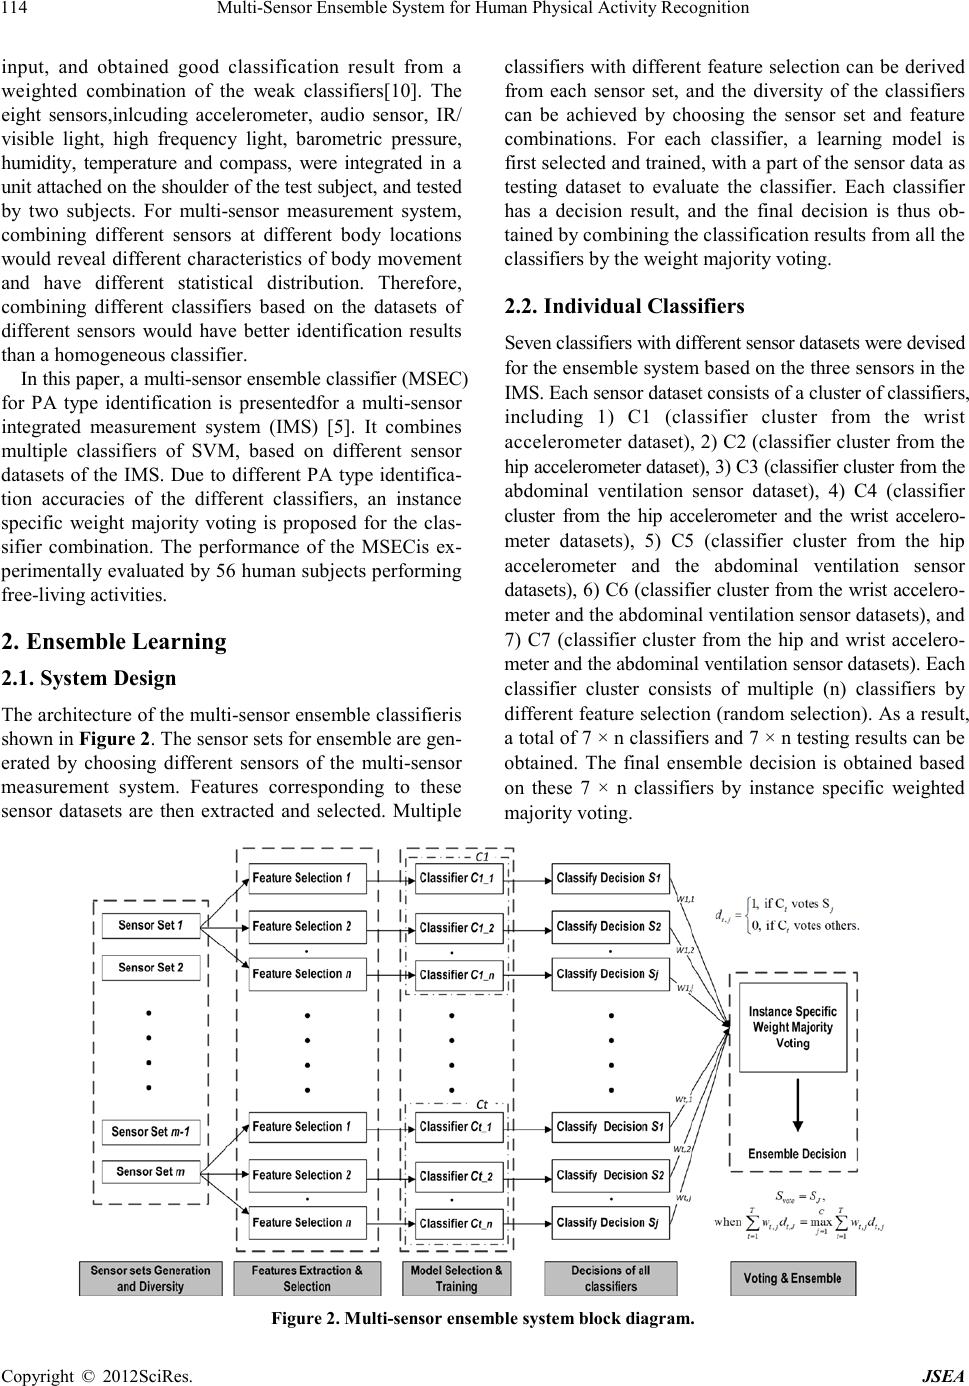
The performance of the ensemble system is based on the
number and accuracies of the classifiers integrated for
the ensemble learning. Various ensemble classifiers had
been evaluated. T he definitions of the different ensemble
classifiers are: E1–E7 integrate the classifiers within
each sensor cluster C1-C7, respectively, E8 integrates
classifiers of C1, C2 and C3, E9 integrates classifiers of
C4, C5 , and C6, and E10 integrates classifiers C1-C7.
Table 1. Physical Activities types for testing.
Activities Category Abbr.
Computer work Sedentary activity CW
Moving boxes Household and other MB
Cycling with 1-kp resistance C1
Treadmill a t 3.0 mph Moderate locomotion T3
Treadmill at 4.0 mph 5% grade Vigorous activity T4-5
Table 2. Classification accuracies of different sensor
classifiers on differ ent PA types
PA T ypes
CW MB C1 T3 T4-5 TE
Classifier Cluster
C2 88.2% 71.7% 86.2% 91.7% 86.0% 71.5%
C4 91.2% 87.1% 89.5% 91.4% 86.2% 73.4%
C6 91.2% 76.3% 81.3% 82.7% 66.5% 96.7%
C7 92.9% 72.9% 91.0% 94.0% 92.4% 85.4%