 Journal of Cancer Therapy, 2013, 4, 80-91 http://dx.doi.org/10.4236/jct.2013.41A012 Published Online January 2013 (http://www.scirp.org/journal/jct) A Population-Based Outcomes Analysis of the Impact of Age on Morbidity and Mortality Following Gastrectomy: An Analysis of 13,799 Patients from the Nationwide Inpatient Sample Database Ami Karkar1, Sachin Patil1, Ronald S. Chamberlain1,2,3* 1Department of Surgery, Saint Barnabas Medical Center, Livingston, USA; 2Saint George’s University School of Medicine, St. George, Grenada; 3Department of Sur g ery, Univer si ty of Medicine and Den tistry of Ne w Jersey, Newark, USA. Email: *rchamberlain@barnabashealth.org Received August 29th, 2012; revised September 30th, 2012; accepted October 12th, 2012 ABSTRACT Introduction: Gastric cancer is the 4th most common malignancy and second leading cause of cancer-related death worldwide, both its incidence and mortality have decreased over the past 70 years. Advancing life expectancy, as well as subtle change in the type and location of gastric cancer in the US, has resulted in an increased number of elderly pa- tients requiring gastric surgery. By 2050, the population older than 85 years is projected to reach 20.9 million, and as a result, the need to assess the operative outcomes and mortality following gastrectomy in this group is imperative. This study sought to assess age-related clinical outcomes following gastric cancer surgery across all age groups to provide more precise data for pre-operative surgical risk stratification. Methods: Discharge data on 40,276,240 patients was collected from Nationwide Inpatient Sample Database (NIS) (2004-2008). Data on patients undergoing gastrectomy as the primary procedure was analyzed including age, gender, elective/non-elective admission, pre-operative length of stay (LOS), total LOS, and mortality. Eight age groups were compared for two procedures: to tal gastrectomy (TG) and par- tial gastrectomy (PG). Categorical data was compared using the Chi square test an d continuous data usin g the Student’s t test. Univariate analysis and multivariate regr ession analysis were performed to assess independent variables. Results: 13,799 patients underwent gastrectomy surgery with 23.7% having TG and 76.3% PG. Gastric carcinoma was the most common indication for TG, while benign gastric disease was more common for PG, especially in years 51 - 70 (p < 0.001).The mean ag e for TG and PG groups were 63 ± 12.8 and 64 ± 15 years respectively. Males underw ent twice the number of TGs (p < 0.001), whereas equal number of males and females underwent PG (p < 0.001). The number of TGs increased over the 5-year study period, with the highest % change noted in those 41 - 50 years (1500%). PGs per- formed decreased overall, especially in patients <60 years, however PGs increased in patients >81 years with the great- est % change in the oldest patients >9 1 years (13%). Non-elective admissions were more common for PGs (N = 4844, 41%) than TGs (N = 695, 21.2%). Mean pre-operative LOS and total LOS increased with advancing age for both TG and PG (p < 0.001). HTN (45%), electrolyte imbalances (28%) and chronic pulmonary disease (18%) were the most prevalent co-morbidities and significantly affected mortality on univariate analysis (p = 0.001). Respiratory (18%) and GI complications (11%) were the most common post-operative complications following TG, while GI (9.6%) and bile duct fistulas (7.2%) were most common after PG. Overall TG and PG mortality rates were 7.6% and 6.4% respectively. Mortality increased with advanc ing age in both groups (p < 0.001). Multivariate analysis id entified HTN, valvular dis- ease, anemia, malignancy and non-elective admissions as independent predictors of mortality (p = 0.001). Conclusions: Advancing age is not an independent predictor of mortality following gastric surgery. Gastrectomy for gastric cancer is associated with a higher mortality than for benign gastric diseases. Non-elective admission, and pre-existing hyperten- sion, valvular disease and anemia independently predicted increased morbidity and mortality following gastric surgery and should be carefully considered in surgical planning and counseling. Gastric carcinoma is the most common indica- tion for TG, while benign gastric disease is a more common indication for PG. The number of TGs performed is in- creasing, especially in the males and younger patients, and may reflect an increased incidence of body and cardiac le- sions. Keywords: Gastric Cancer; Gastrectomy; Partial Gastrectomy; Total Gastrectomy *Corresponding a uthor. Copyright © 2013 SciRes. JCT  A Population-Based Outcomes Analysis of the Impact of Age on Morbidity and Mortality Following Gastrectomy: An Analysis of 13,799 Patients from the Nationwide Inpatient Sample Database Copyright © 2013 SciRes. JCT 81 1. Introduction Gastric cancer is the fourth most common malignancy and second leading cause of cancer-related death world- wide. Gastric cancer primarily presents in advanced stages especially among the elderly (>80 years) and is associated with a poor outcomes unless diagnosed early [1]. Hazanaki et al. observed advanced gastric cancer in 56% of patients >80 years compared to 27.9% of patients <80 years old (p < 0.01). Overall in-hospital mortality (2% versus 0%), and 5-year overall survival rates (46.1% versus 71.1% (p < 0.01)) were substantially higher among those >80 years compare those <80 years [2]. Precise explanations for the higher incidence of advanced disease and worse outcomes in the elderly remains largely unknown but is likely related to life expectancy, pre-existing co-morbidities, as well as age-related differ- ences in tumor location and histology [3,4]. Complete surgical resection with a R0 margin provides the highest survival benefit for gastric cancer, however this is achi- evable in only a select group of patients (approximately 50%). Moreover, gastrectomy is associated with signifi- cant morbidity and mortality, particularly in the elderly, and in-hospital mortality rates as high as 16.6% after total gastrectomy (TG) and 15.3% after partial gastrec- tomy (PG) have been reported [5]. The percent of pa- tients over 80 years is the fastest growing segment of the US population, and by 2050, those over 85 years is pro- jected to reach 20.9 million. As a result, there is a grow- ing and important need to have precise information re- lated to the operative risks, outcomes and mortality fol- lowing gastrectomy in elderly patients in order to im- prove surgical decision making and patient counseling. This study sought to compare population-based outcomes following gastrectomy across a wide range of age groups to determine whether advancing age, or other factors, were independently associated with increased morbidity and mortality. 2. Methods Discharge data for 40,276,240 patients from the 2004- 2008 Nationwide Inpatient Sample Database (NIS), a part of the Healthcare Cost and Utilization Project (HCUP) of the Agency for Healthcare Research and Quality (AHRQ) was analyzed. The NIS involved no identifying patient information and was thus exempt from Institutional Review Board approval at our institu- tion. Information on patients who had undergone total gastrectomy (ICD 9 code: 439.1) and partial gastrectomy (ICD 9 codes: 438.1 and 438.9) as the primary procedure was abstracted. Eight age groups (in increments of 10 years starting at 21 years) were compared for two proce- dures: total gastrectomy (TG) and partial gastrectomy (PG). The number of patients, gender ratio, most com- mon primary diagnosis, non-elective nature of admission, co-morbidities, pre-operative length of stay (LOS), total length of stay (LOS), and morbidity and mortality rates were abstracted separately for both TG and PG. Informa- tion on complication rates was extracted using ICD-9 codes. The type of complications and their broad group- ing is detailed in Table 1 . In addition, the total number of procedures performed (both TG and PG) over the five year period, as well as the percentage change in the num- ber of procedures for each type of gastrectomy (Figures 1(a) and (b)), were calculated by dividing the number of gastrectomies performed in 2008 by the number gastric- tomies performed in 2004. Statistical analysis was performed using th e Chi squ are test for categorical data and the Student’s t test for con- tinuous data. A value of p < 0.05 was considered statisti- cally significant. Univariate analysis and multivariate logistic regression analysis were performed to assess factors affecting mortality following gastrectomy. Data analysis was performed using SPSS version 19.0 (SPSS, Inc). As per NIS database reporting guidelines, values <10 are not shown in the results section and in the tables. 3. Results 3.1. Demographic Information 13,799 patients identified in the NIS underwent either total gastrectomy (TG) or partial gastrectomy (PG) be- tween 2004 and 2008, and formed the study population. Clinicopathological characteristics are detailed in Table 2. 23.7% (N = 3271) patients underwent a TG, while 76.3% (N = 10,528) underwen t a PG. Th e largest nu mber of TG were performed in patients age 61 - 70 years (N = 980, 30%), whereas the largest number of PG were per- formed in those age 71 - 80 years (N = 2436, 23.1%). The mean age for the TG and PG groups were 63.1 ± 12.8 and 64.1 ± 15 years, respectively. Twice the number of males compared to females received a TG (p < 0.001 ), whereas equal numbers received a PG (p < 0.001). The greatest gender difference was observed among those 61 - 70 years old for the TG group (M:F, 2.9:1), and among those 21 - 30 for the PG group (M:F, 1:1.6). Figures 1(a) and (b) detail the change in number and percent of TG and PG performed during the study period. TGs in- creased over the 5-year study period, with the highest percentage change among those 41 - 50 years (1500%). The number of PGs performed decreased overall, espe- cially in patients aged <60 years, but it increased among patients >80 years with the highest percentage change noted in patients >90 years (13%). 3.2. Pathology and Co-Morbidities Gastric carcinoma was the most common indication for  A Population-Based Outcomes Analysis of the Impact of Age on Morbidity and Mortality Following Gastrectomy: An Analysis of 13,799 Patients from the Nationwide Inpatient Sample Database 82 Table 1. Complications studied by ICD code and their broad grouping for analysis (national inpatient sample database 2004-2008). Broad group ICD 9 code Complication Components Medical complications Respiratory complications 512.1 415.11 518.5 518.4 997.31 997.39 Iatrogenic pneumothorax Iatrogenic pulmonary embolic inf a rct Post traumatic pulmonary insufficiency Acute lung edema NOS Ventilator associated pneumonia Respiratory complications NEC Cardiac complications 997.1 Post-operative complications of Heart Cardiac arrest during or resulting fr om a procedure Cardiac insufficiency during or resulting from a procedure Cardiorespiratory failure during or resulting from a procedure Heart failure during or resulting from a procedure Post-operative stroke 997.02 Post-operative stroke (Begins 1995) Urinary tract complications 997.5 Post-operative complications of urinary tract Complications of: External stoma of urinary tract Internal anastomosis and bypass of urinary tract, including tha involving intestinal tract Oliguria or anu ria specified as due to procedure Renal failure (acute) specified as due to procedure Insufficiency (acute) specified as due to procedure Tubular necrosis (acute) specified as due to procedure Sepsis 995.91 Intra-abdominal post-operative Stitch post-operative Subphrenic post-operative Wound post-ope rative Surgical complications Gastrointestinal complications 997.4 Post-operative complications of GI tract Complications of: intestinal (internal) anastomosis and bypass, not elsewhere classified, except that involving urinary tract Hepatic failure specified as due to a procedure Hepatorenal syndrome specified as due to a procedure Intestinal obstruction NOS specified as due to a procedure Fistula of bile duct 576.4 Fistula of bile duct Post-operative infection 998.59 Other post-ope rative infection Abscess: post-operative Accidental operative laceration 998.2 Accidental operative laceration Accidental perforation by catheter or other instrument during a procedure on: Blood vessel, Nerve, Organ Post-operative hemorrhage 998.11 Post-operative hemorrhage Disruption of internal operative wound 998.31 Disruption of internal operative wound Disruption of external operative wound 998.32 Disruption of external operative woun d Intestinal fistula 569.81 Intestinal fistula Deep vein thrombosis 453.9 453.40 453.41 453.42 Venous thrombosis NOS DVT/Embolism lower ext NOS DVT/Embolism proximal lower ext DVT/Embolism distal lower ext Copyright © 2013 SciRes. JCT 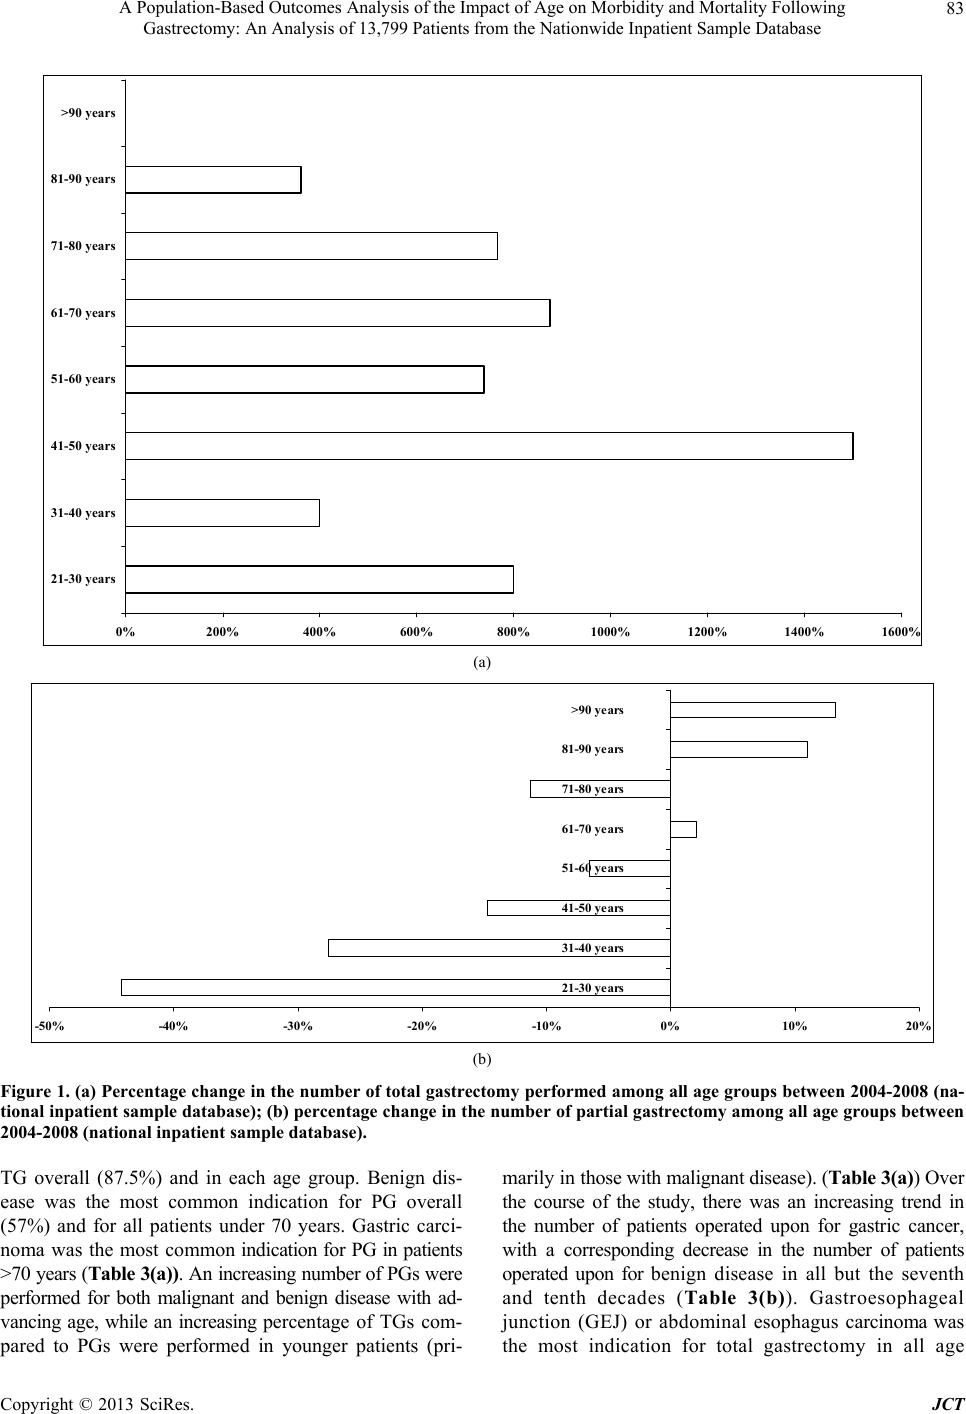 A Population-Based Outcomes Analysis of the Impact of Age on Morbidity and Mortality Following Gastrectomy: An Analysis of 13,799 Patients from the Nationwide Inpatient Sample Database 83 0%200%400%600%800%1000% 1200% 1400% 1600% 21-30 years 31-40 years 41-50 years 51-60 years 61-70 years 71-80 years 81-90 years >90 years (a) -50% -40%-30% -20%-10%0%10%20% 21- 30 y ears 31- 40 y ears 41- 50 y ears 51- 60 y ears 61- 70 y ears 71- 80 y ears 81- 90 y ears >90 year s (b) Figure 1. (a) Percentage change in the number of total gastrectomy performed among all age groups between 2004-2008 (na- tional inpatient sample database); (b) percentage change in the number of partial gastrectomy among all age groups between 2004-2008 (national inpatient sample database). TG overall (87.5%) and in each age group. Benign dis- ease was the most common indication for PG overall (57%) and for all patients under 70 years. Gastric carci- noma wa s t he mos t commo n indication for PG in patients >70 years (Table 3(a)) . An increa sing number o f PGs wer e performed for both malignant and benign disease with ad- vancing age, while an increasing percentage of TGs com- pared to PGs were performed in younger patients (pri- marily in those with malignant disease). ( T abl e 3(a) ) Over the course of the study, there was an increasing trend in the number of patients operated upon for gastric cancer, with a corresponding decrease in the number of patients operated upon for benign disease in all but the seventh and tenth decades (Table 3(b)). Gastroesophageal junction (GEJ) or abdominal esophagus carcinoma was the most indication for total gastrectomy in all age Copyright © 2013 SciRes. JCT 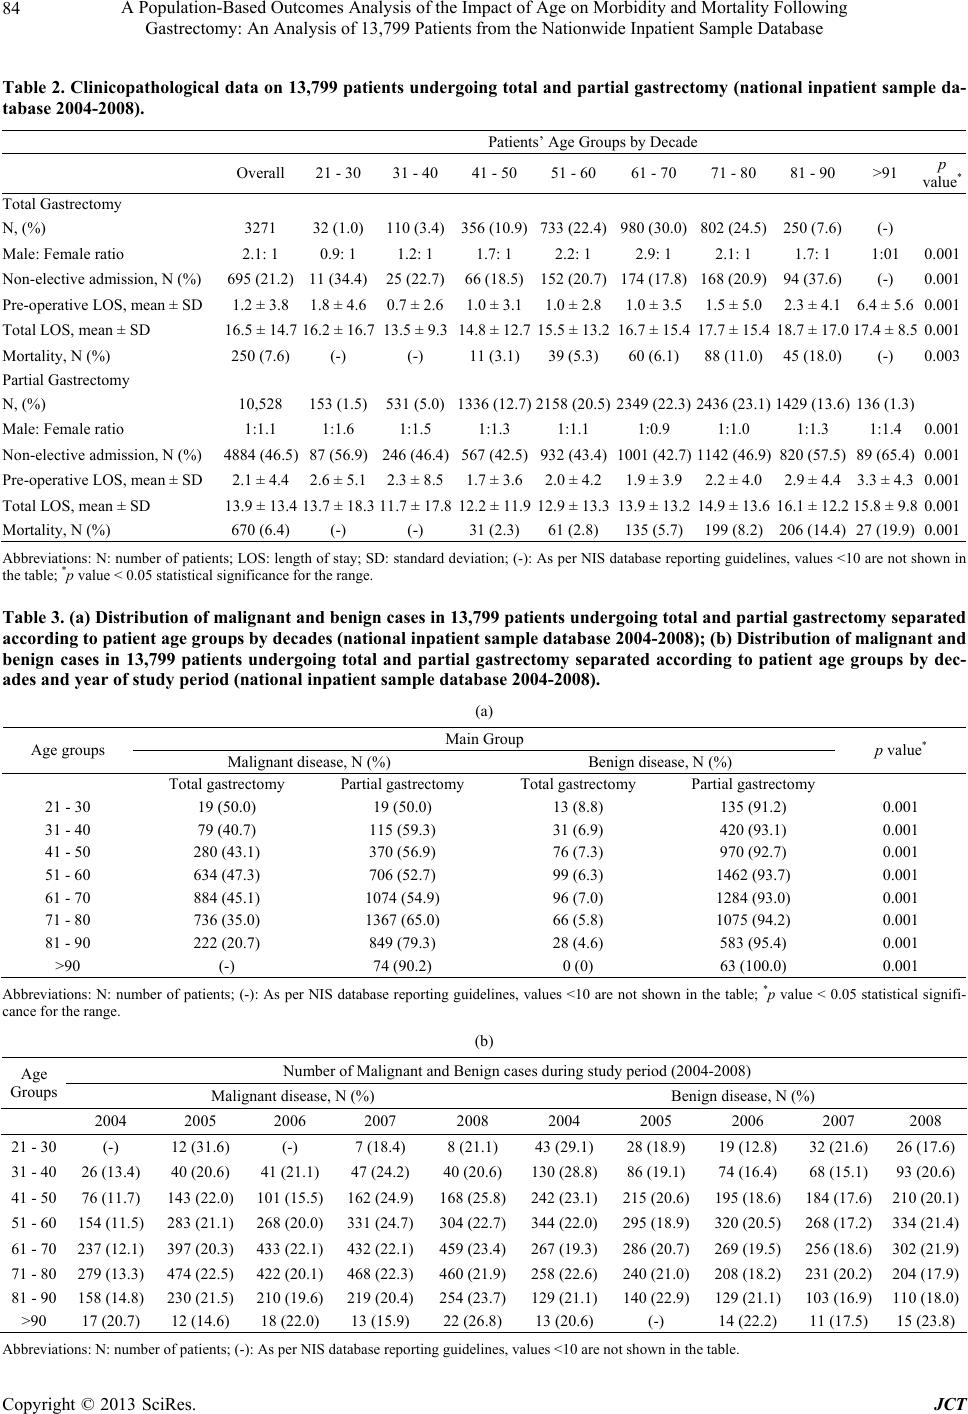 A Population-Based Outcomes Analysis of the Impact of Age on Morbidity and Mortality Following Gastrectomy: An Analysis of 13,799 Patients from the Nationwide Inpatient Sample Database 84 Table 2. Clinicopathological data on 13,799 patients undergoing total and partial gastrectomy (national inpatient sample da- tabase 2004-2008). Patients’ Age Groups by Decade Overall 21 - 30 31 - 40 41 - 50 51 - 60 61 - 70 71 - 80 81 - 90 >91 p value* Total Gastrectomy N, (%) 3271 32 (1.0) 110 (3.4)356 (10.9)733 (22.4)980 (30.0)802 (24.5) 250 (7.6) (-) Male: Female r a t i o 2.1: 1 0.9: 1 1.2: 1 1.7: 1 2.2: 1 2.9: 1 2.1: 1 1.7: 1 1:01 0.001 Non-elective admission, N (%) 695 (21.2) 11 (34.4) 25 (22.7)66 (18.5)152 (20.7)174 (17.8)168 (20.9) 94 (37.6) (-) 0.001 Pre-operativ e LOS, mean ± SD 1.2 ± 3.8 1.8 ± 4.6 0.7 ± 2.61.0 ± 3.11.0 ± 2.81.0 ± 3.51.5 ± 5.0 2.3 ± 4.1 6.4 ± 5.60.001 Total LOS, mean ± SD 16.5 ± 14.7 16.2 ± 16.7 13.5 ± 9.314. 8 ± 1 2 .715.5 ± 13.216.7 ± 15.417.7 ± 15.4 18.7 ± 17.0 17.4 ± 8.50.001 Mortality, N (%) 250 (7.6) (-) (-) 11 (3.1)39 (5.3)60 (6.1)88 (11.0) 45 (18.0) (-) 0.003 Partial Gastrectomy N, (%) 10,528 153 (1.5) 531 (5.0)1336 (12.7)2158 (20.5)2349 (22. 3)2436 (23.1) 1429 (13.6) 136 (1.3) Male: Female r a t i o 1:1.1 1:1.6 1:1.5 1:1.3 1:1.1 1:0.9 1:1.0 1:1.3 1:1.4 0.001 Non-elective admission, N (%) 4884 (46.5) 87 (56.9) 246 (46.4)567 (42.5)932 (43.4)1001 (42.7)1142 (46.9) 820 (57.5) 89 (65.4)0.001 Pre-operativ e LOS, mean ± SD 2.1 ± 4.4 2.6 ± 5.1 2.3 ± 8.51.7 ± 3.62.0 ± 4.21.9 ± 3.92.2 ± 4.0 2.9 ± 4.4 3.3 ± 4.30.001 Total LOS, mean ± SD 13.9 ± 13.4 13.7 ± 18.3 11.7 ± 17.812.2 ± 11.912.9 ± 13.313.9 ± 13.214.9 ± 13.6 16.1 ± 12.2 15.8 ± 9.80.001 Mortality, N (%) 670 (6.4) (-) (-) 31 (2.3)61 (2.8)135 (5.7)199 (8.2) 206 (14.4) 27 (19.9) 0.001 Abbreviations: N: number of patients; LOS: length of stay; SD: standard deviation; (-): As per NIS database reporting guidelines, values <10 are not shown in the table; *p value < 0.05 statistical significance for the range. Table 3. (a) Distribution of malignant and benign cases in 13,799 patients undergoing total and partial gastrectomy separated according to patient age groups by decades (national inpatient sample database 2004-2008); (b) Distribution of malignant and benign cases in 13,799 patients undergoing total and partial gastrectomy separated according to patient age groups by dec- ades and year of study period (national inpatient sample database 2004-2008). (a) Main Group Age groups Malignant disease, N (%) Benign disease, N (%) p value* Total gastrectomy Partial gastrectomy Total gastrectomy Partial gastrectomy 21 - 30 19 (50.0) 19 (50.0) 13 (8.8) 135 (91.2) 0.001 31 - 40 79 (40.7) 115 (59.3) 31 (6.9) 420 (93.1) 0.001 41 - 50 280 (43.1) 370 (56.9) 76 (7.3) 970 (92.7) 0.001 51 - 60 634 (47.3) 706 (52.7) 99 (6.3) 1462 (93.7) 0.001 61 - 70 884 (45.1) 1074 (54.9) 96 (7.0) 1284 (93.0) 0.001 71 - 80 736 (35.0) 1367 (65.0) 66 (5.8) 1075 (94.2) 0.001 81 - 90 222 (20.7) 849 (79.3) 28 (4.6) 583 (95.4) 0.001 >90 (-) 74 (90.2) 0 (0) 63 (100.0) 0.001 Abbreviations: N: number of patients; (-): As per NIS database reporting guidelines, values <10 are not shown in the table; *p value < 0.05 statistical signifi- cance for the range. (b) Number of Malignant and Benign cases d uring study period (20 04 -2008) Age Groups Malignant disease, N (%) Benign disease, N (%) 2004 2005 2006 2007 2008 2004 2005 2006 2007 2008 21 - 30 (-) 12 (31.6) (-) 7 (18.4) 8 (21.1) 43 (29.1) 28 (18.9) 19 (12.8) 32 (21.6) 26 (17.6) 31 - 40 26 (13.4) 40 (20.6) 41 (21.1) 47 (24.2) 40 (20.6) 130 (28.8)86 (19.1) 74 (16.4) 68 (15.1) 93 (20.6) 41 - 50 76 (11.7) 143 (22.0) 101 (15.5) 162 (24.9)168 (25.8)242 (23.1)215 (20.6)195 (18.6) 184 (17.6)210 (20.1) 51 - 60 154 (11.5) 283 (21.1) 268 (20.0) 331 (24.7)304 (22.7)344 (22.0)295 (18.9)320 (20.5) 268 ( 17.2)334 (21.4) 61 - 70 237 (12.1) 397 (20.3) 433 (22.1) 432 (22.1)459 (23.4)267 (19.3)286 (20.7)269 (19.5) 256 ( 18.6)302 (21.9) 71 - 80 279 (13.3) 474 (22.5) 422 (20.1) 468 (22.3)460 (21.9)258 (22.6)240 (21.0)208 (18.2) 231 ( 20.2)204 (17.9) 81 - 90 158 (14.8) 230 (21.5) 210 (19.6) 219 (20.4)254 (23.7)129 (21.1)140 (22.9)129 (21.1) 103 ( 16.9)110 (18.0) >90 17 (20.7) 12 (14.6) 18 (22.0) 13 (15.9) 22 (26.8) 13 (20.6) (-) 14 (22.2) 11 (17.5) 15 (23.8) Abbreviations: N: number of patients ; (-): As per NIS database r eporting guidelines, values <10 are not shown in the table. Copyright © 2013 SciRes. JCT 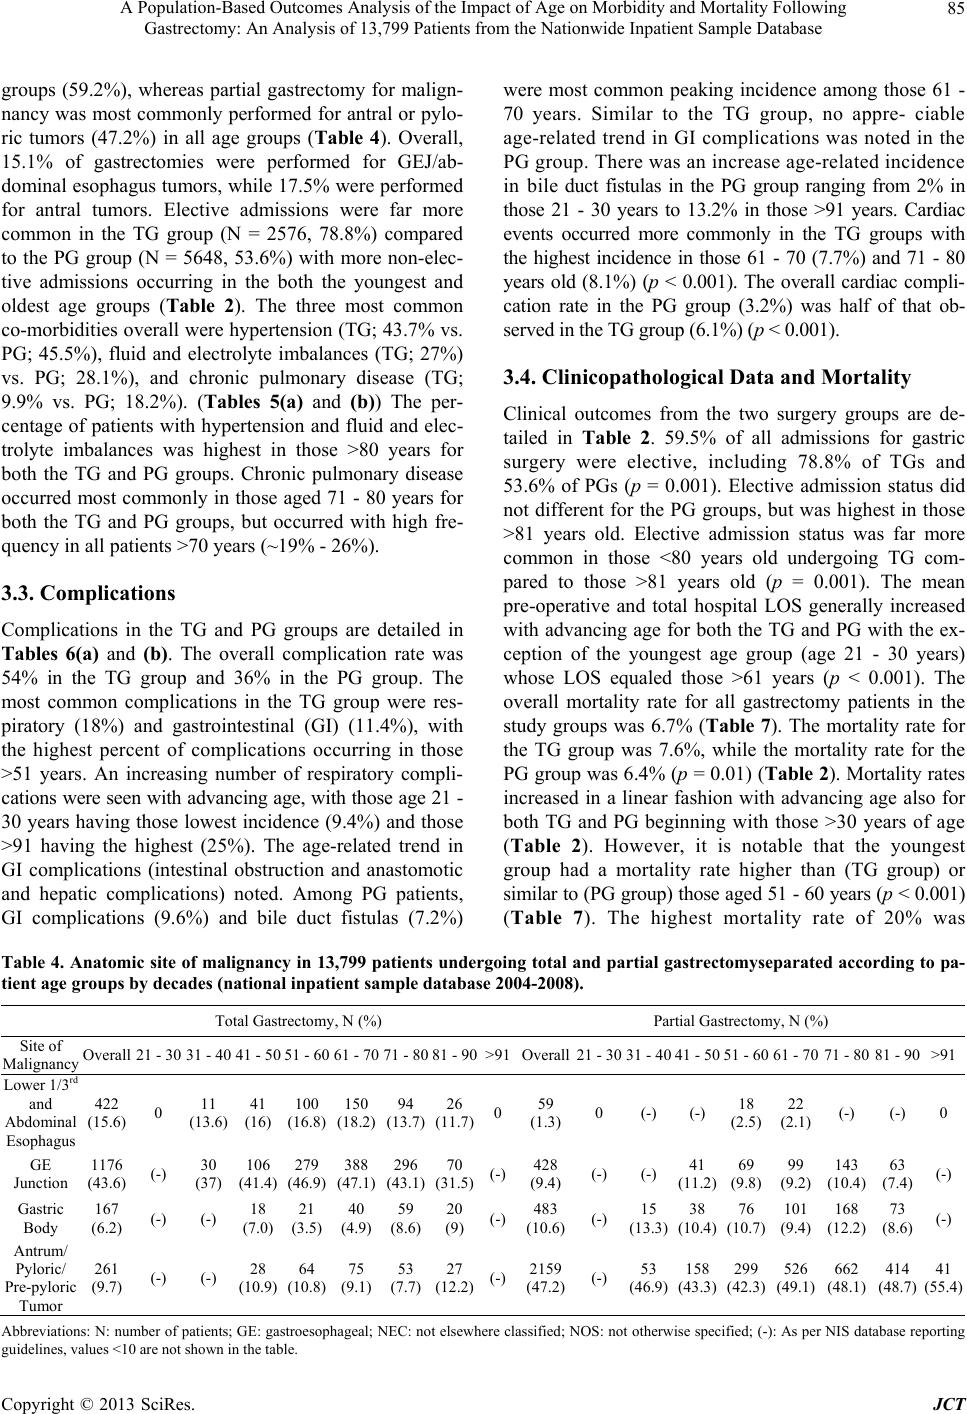 A Population-Based Outcomes Analysis of the Impact of Age on Morbidity and Mortality Following Gastrectomy: An Analysis of 13,799 Patients from the Nationwide Inpatient Sample Database 85 groups (59.2%), whereas partial gastrectomy for malign- nancy was most commonly performed for antral or pylo- ric tumors (47.2%) in all age groups (Table 4). Overall, 15.1% of gastrectomies were performed for GEJ/ab- dominal esophagus tumors, while 17.5% were performed for antral tumors. Elective admissions were far more common in the TG group (N = 2576, 78.8%) compared to the PG group (N = 5648, 53.6%) with more non-elec- tive admissions occurring in the both the youngest and oldest age groups (Table 2). The three most common co-morbidities overall were hypertension (TG; 43.7 % vs. PG; 45.5%), fluid and electrolyte imbalances (TG; 27%) vs. PG; 28.1%), and chronic pulmonary disease (TG; 9.9% vs. PG; 18.2%). (Tables 5(a) and (b)) The per- centage of patients with hypertension and fluid and elec- trolyte imbalances was highest in those >80 years for both the TG and PG groups. Chronic pulmonary disease occurred most commonly in those aged 71 - 80 years for both the TG and PG groups, but occurred with high fre- quency in all patients >70 years (~19% - 26%). 3.3. Complications Complications in the TG and PG groups are detailed in Tables 6(a) and (b). The overall complication rate was 54% in the TG group and 36% in the PG group. The most common complications in the TG group were res- piratory (18%) and gastrointestinal (GI) (11.4%), with the highest percent of complications occurring in those >51 years. An increasing number of respiratory compli- cations were seen with advancing age, with those age 21 - 30 years having those lowest incidence (9.4%) and those >91 having the highest (25%). The age-related trend in GI complications (intestinal obstruction and anastomotic and hepatic complications) noted. Among PG patients, GI complications (9.6%) and bile duct fistulas (7.2%) were most common peaking incidence among those 61 - 70 years. Similar to the TG group, no appre- ciable age-related trend in GI complications was noted in the PG group. There was an increase age-related incidence in bile duct fistulas in the PG group ranging from 2% in those 21 - 30 years to 13.2% in those >91 years. Cardiac events occurred more commonly in the TG groups with the highest incidence in those 61 - 70 (7.7%) and 71 - 80 years old (8.1%) (p < 0.001). The overall cardiac compli- cation rate in the PG group (3.2%) was half of that ob- served in the TG group (6.1% ) (p < 0.00 1). 3.4. Clinicopathological Data and Mortality Clinical outcomes from the two surgery groups are de- tailed in Table 2. 59.5% of all admissions for gastric surgery were elective, including 78.8% of TGs and 53.6% of PGs (p = 0.001). Elective admission status did not different for the PG groups, but was highest in those >81 years old. Elective admission status was far more common in those <80 years old undergoing TG com- pared to those >81 years old (p = 0.001). The mean pre-operative and total hospital LOS generally increased with advancing age for both the TG and PG with the ex- ception of the youngest age group (age 21 - 30 years) whose LOS equaled those >61 years (p < 0.001). The overall mortality rate for all gastrectomy patients in the study groups was 6.7% (Table 7). The mortality rate for the TG group was 7.6%, while the mortality rate for the PG group was 6.4% (p = 0.01) (Table 2). Mortality rates increased in a linear fashion with advancing age also for both TG and PG beginning with those >30 years of age (Table 2). However, it is notable that the youngest group had a mortality rate higher than (TG group) or similar to (PG group) those aged 51 - 60 years (p < 0.001) (Table 7). The highest mortality rate of 20% was Table 4. Anatomic site of malignancy in 13,799 patients undergoing total and partial gastrectomyseparated according to pa- tient age groups by decades (national inpatient sample database 2004-2008). Total Gastrectomy, N (%) Partial Gastrectomy, N (%) Site of Malignancy Overall 21 - 30 31 - 40 41 - 50 51 - 60 61 - 70 71 - 8081 - 90>91Overall21 - 3031 - 4041 - 5051 - 60 61 - 70 71 - 80 81 - 90>91 Lower 1/3rd and Abdominal Esophagus 422 (15.6) 0 11 (13.6) 41 (16) 100 (16.8) 150 (18.2) 94 (13.7) 26 (11.7) 059 (1.3) 0 (-) (-)18 (2.5) 22 (2.1) (-) (-) 0 GE Junction 1176 (43.6) (-) 30 (37) 106 (41.4) 279 (46.9) 388 (47.1) 296 (43.1) 70 (31.5) (-) 428 (9.4) (-) (-) 41 (11.2) 69 (9.8) 99 (9.2) 143 (10.4) 63 (7.4) (-) Gastric Body 167 (6.2) (-) (-) 18 (7.0) 21 (3.5) 40 (4.9) 59 (8.6) 20 (9) (-) 483 (10.6) (-) 15 (13.3) 38 (10.4) 76 (10.7) 101 (9.4) 168 (12.2) 73 (8.6) (-) Antrum/ Pyloric/ Pre-pyloric Tumor 261 (9.7) (-) (-) 28 (10.9) 64 (10.8) 75 (9.1) 53 (7.7) 27 (12.2) (-) 2159 (47.2) (-) 53 (46.9) 158 (43.3) 299 (42.3) 526 (49.1) 662 (48.1) 414 (48.7) 41 (55.4) Abbreviations: N: number of patients; GE: gastroesophageal; NEC: not elsewhere classified; NOS: not otherwise specified; (-): As per NIS database reporting guidelines, values <10 are not shown in the table. Copyright © 2013 SciRes. JCT 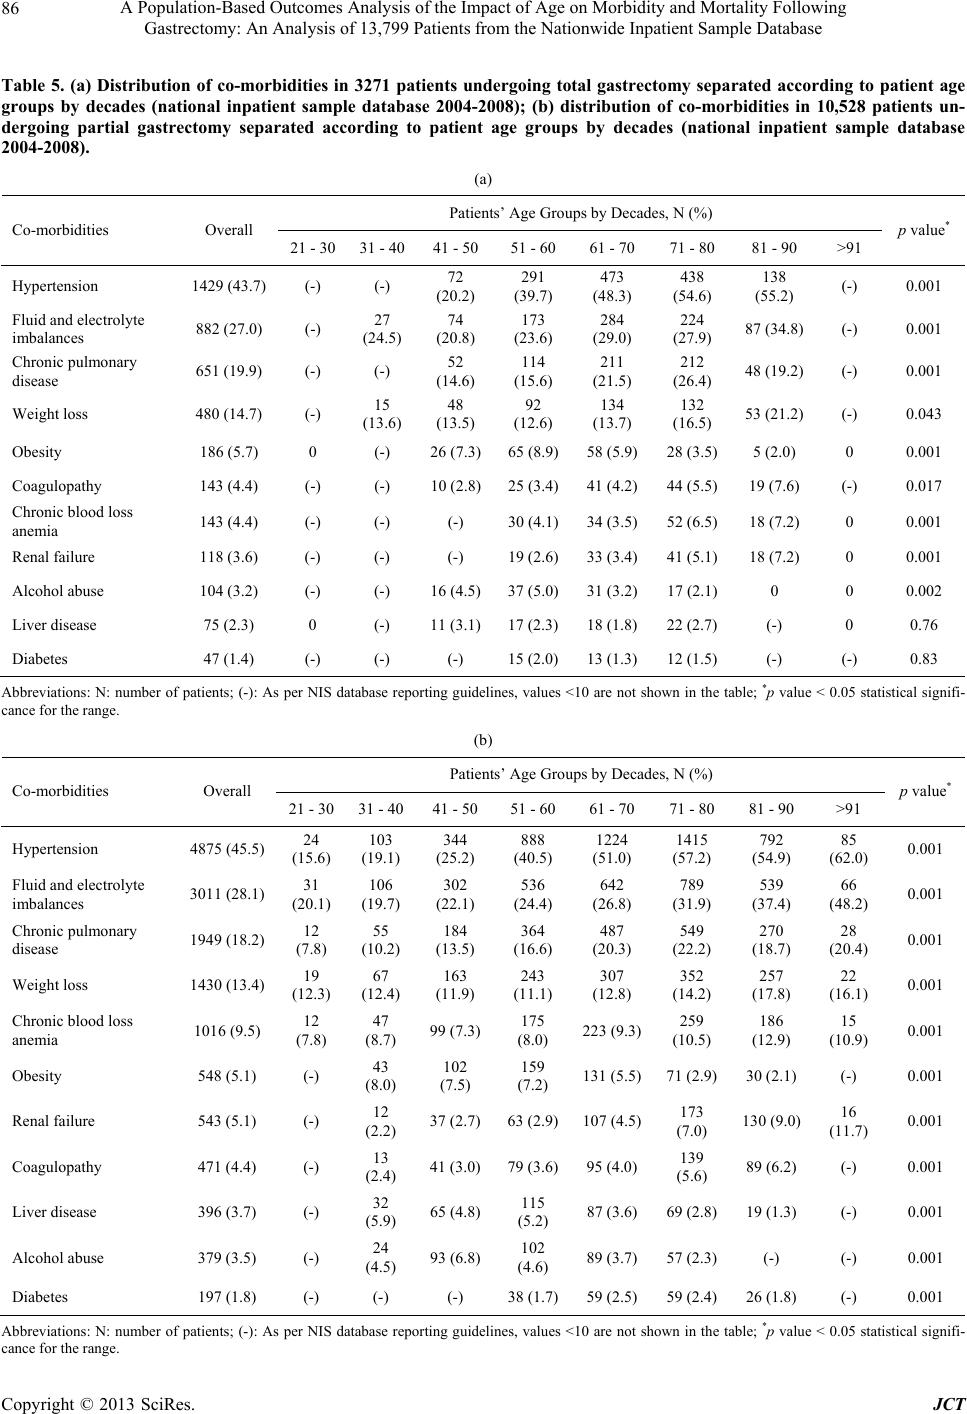 A Population-Based Outcomes Analysis of the Impact of Age on Morbidity and Mortality Following Gastrectomy: An Analysis of 13,799 Patients from the Nationwide Inpatient Sample Database 86 Table 5. (a) Distribution of co-morbidities in 3271 patients undergoing total gastrectomy separated according to patient age groups by decades (national inpatient sample database 2004-2008); (b) distribution of co-morbidities in 10,528 patients un- dergoing partial gastrectomy separated according to patient age groups by decades (national inpatient sample database 2004-2008). (a) Patients’ Age Groups by Decades, N (%) Co-morbidities Overall 21 - 30 31 - 4041 - 5051 - 60 61 - 70 71 - 80 81 - 90 >91 p value* Hypertension 1429 (43.7) (-) (-) 72 (20.2) 291 (39.7) 473 (48.3) 438 (54.6) 138 (55.2) (-) 0.001 Fluid and electrolyte imbalances 882 (27.0) (-) 27 (24.5) 74 (20.8) 173 (23.6) 284 (29.0) 224 (27.9) 87 (34.8) (-) 0.001 Chronic pulmonary disease 651 (19.9) (-) (-) 52 (14.6) 114 (15.6) 211 (21.5) 212 (26.4) 48 (19.2) (-) 0.001 Weight loss 480 (14.7) (-) 15 (13.6) 48 (13.5) 92 (12.6) 134 (13.7) 132 (16.5) 53 (21.2) (-) 0.043 Obesity 186 (5.7) 0 (-) 26 (7.3)65 (8.9)58 (5.9)28 (3.5)5 (2.0) 0 0.001 Coagulopathy 143 (4.4) (-) (-) 10 (2.8)25 (3.4)41 (4.2)44 (5.5)19 (7.6) (-) 0.017 Chronic blood loss anemia 143 (4.4) (-) (-) (-) 30 (4.1)34 (3.5)52 (6.5)18 (7.2) 0 0.001 Renal failure 118 (3.6) (-) (-) (-) 19 (2.6)33 (3.4)41 (5.1)18 (7.2) 0 0.001 Alcohol abuse 104 (3.2) (-) (-) 16 (4.5)37 (5.0)31 (3.2)17 (2.1)0 0 0.002 Liver disease 75 (2.3) 0 (-) 11 (3.1)17 (2.3)18 (1.8)22 (2.7)(-) 0 0.76 Diabetes 47 (1.4) (-) (-) (-) 15 (2.0)13 (1.3)12 (1.5)(-) (-) 0.83 Abbreviations: N: number of patients; (-): As per NIS database reporting guidelines, values <10 are not shown in the table; *p value < 0.05 statistical signifi- cance for the range. (b) Patients’ Age Groups by Decades, N (%) Co-morbidities Overall 21 - 30 31 - 4041 - 50 51 - 6061 - 70 71 - 80 81 - 90 >91 p value* Hypertension 4875 (45.5) 24 (15.6) 103 (19.1) 344 (25.2) 888 (40.5) 1224 (51.0) 1415 (57.2) 792 (54.9) 85 (62.0) 0.001 Fluid and electrolyte imbalances 3011 (28.1) 31 (20.1) 106 (19.7) 302 (22.1) 536 (24.4) 642 (26.8) 789 (31.9) 539 (37.4) 66 (48.2) 0.001 Chronic pulmonary disease 1949 (18.2) 12 (7.8) 55 (10.2) 184 (13.5) 364 (16.6) 487 (20.3) 549 (22.2) 270 (18.7) 28 (20.4) 0.001 Weight loss 1430 (13.4 ) 19 (12.3) 67 (12.4) 163 (11.9) 243 (11.1) 307 (12.8) 352 (14.2) 257 (17.8) 22 (16.1) 0.001 Chronic blood loss anemia 1016 (9.5) 12 (7.8) 47 (8.7) 99 (7.3)175 (8.0) 223 (9.3)259 (10.5) 186 (12.9) 15 (10.9) 0.001 Obesity 548 (5.1) (-) 43 (8.0) 102 (7.5) 159 (7.2) 131 (5.5)71 (2.9)30 (2.1) (-) 0.001 Renal failure 543 (5.1) (-) 12 (2.2) 37 (2.7)63 (2.9)107 (4.5)173 (7.0) 130 (9.0) 16 (11.7) 0.001 Coagulopathy 471 (4.4) (-) 13 (2.4) 41 (3.0)79 (3.6)95 (4.0)139 (5.6) 89 (6.2) (-) 0.001 Liver disease 396 (3.7) (-) 32 (5.9) 65 (4.8)115 (5.2) 87 (3.6)69 (2.8)19 (1.3) (-) 0.001 Alcohol abuse 379 (3.5) (-) 24 (4.5) 93 (6.8)102 (4.6) 89 (3.7)57 (2.3)(-) (-) 0.001 Diabetes 197 (1.8) (-) (-) (-) 38 (1.7)59 (2.5)59 (2.4)26 (1.8) (-) 0.001 Abbreviations: N: number of patients; (-): As per NIS database reporting guidelines, values <10 are not shown in the table; *p value < 0.05 statistical signifi- cance for the range. Copyright © 2013 SciRes. JCT 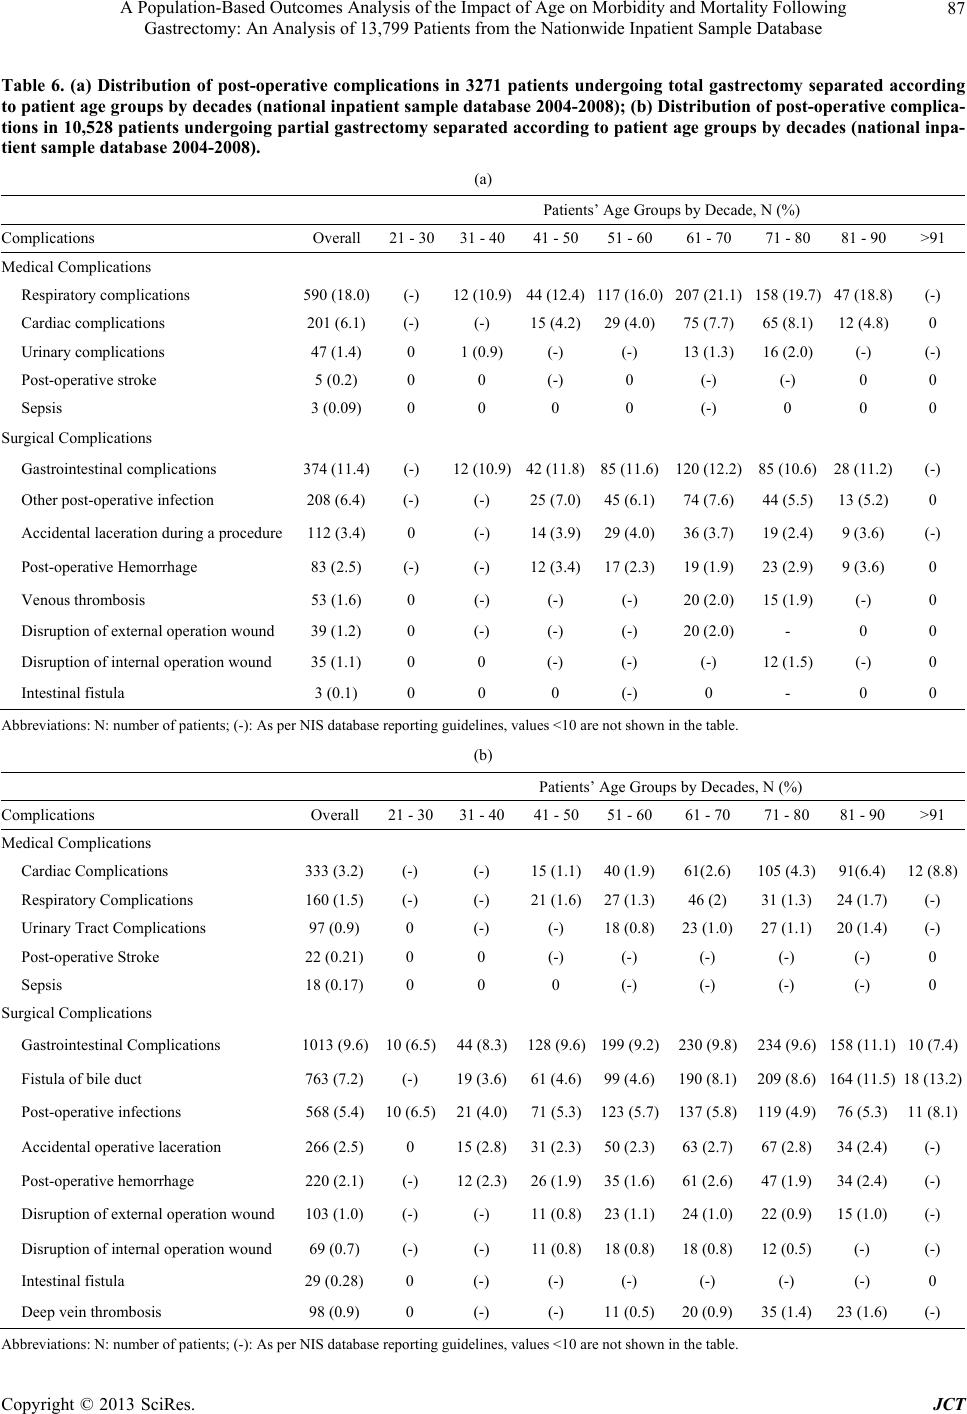 A Population-Based Outcomes Analysis of the Impact of Age on Morbidity and Mortality Following Gastrectomy: An Analysis of 13,799 Patients from the Nationwide Inpatient Sample Database 87 Table 6. (a) Distribution of post-operative complications in 3271 patients undergoing total gastrectomy separated according to patient age groups by decades (national inpatient sample database 2004-2008); (b) Distribution of post-operative complica- tions in 10,528 patients undergoing partial gastrectomy separated according to patient age groups by decades (national inpa- tient sample database 2004-2008). (a) Patients’ Age Groups by Decade, N (%) Complications Overall 21 - 3031 - 4041 - 5051 - 60 61 - 70 71 - 80 81 - 90>91 Medical Complications Respiratory complications 590 (18.0) (-) 12 (10.9)44 (12.4)117 (16. 0 )207 (21.1) 158 (19.7) 47 (18.8)(-) Cardiac complications 201 ( 6.1 ) (-) (-) 15 (4.2)29 (4.0)75 (7.7) 65 (8.1) 12 (4.8)0 Urinary complications 47 (1.4) 0 1 (0.9) (-) (-) 13 (1.3) 16 (2.0) (-) (-) Post-operative stroke 5 (0.2) 0 0 (-) 0 (-) (-) 0 0 Sepsis 3 (0.09) 0 0 0 0 (-) 0 0 0 Surgical Complications Gastrointestinal complications 374 (11.4) (-) 12 (10.9)42 (11.8)85 (11.6)120 (12.2) 85 (10.6) 28 (11.2)(-) Other post-operative infection 208 (6.4) (-) (-) 25 (7.0)45 (6.1)74 (7.6) 44 (5.5) 13 (5.2)0 Accidental laceration during a procedure 112 (3.4) 0 (-) 14 (3.9)29 (4.0)36 (3.7) 19 (2.4) 9 (3.6) (-) Post-operative Hemorrhage 83 (2.5) (-) (-) 12 (3.4)17 (2.3)19 (1.9) 23 (2.9) 9 (3.6) 0 Venous thrombosis 53 (1.6) 0 (-) (-) (-) 20 (2.0) 15 (1.9) (-) 0 Disruption of external operation wound 39 (1.2) 0 (-) (-) (-) 20 (2.0) - 0 0 Disruption of internal operation wound 35 (1.1) 0 0 (-) (-) (-) 12 (1.5) (-) 0 Intestinal fistula 3 (0.1) 0 0 0 (-) 0 - 0 0 Abbreviations: N: number of patients ; (-): As per NIS database r eporting guidelines, values <10 are not shown in the table. (b) Patients’ Age Groups by Decades, N (%) Complications Overall 21 - 3031 - 4041 - 5051 - 6061 - 70 71 - 80 81 - 90>91 Medical Complications Cardiac Complications 333 (3.2) (-) (-) 15 (1.1)40 (1.9)61(2.6) 105 (4.3) 91(6.4)12 (8.8) Respiratory Complications 160 (1.5) (-) ( -) 21 (1.6)27 (1.3)46 (2) 31 (1.3) 24 (1.7)(-) Urinary Tract Complications 97 (0.9) 0 (-) (-) 18 (0.8)23 (1.0) 27 (1.1) 20 (1.4)(-) Post-operative Stroke 22 (0.21) 0 0 (-) (-) (-) (-) (-) 0 Sepsis 18 (0.17) 0 0 0 (-) (-) (-) (-) 0 Surgical Complications Gastrointestinal Complications 1013 (9.6) 10 (6.5)44 (8.3)128 (9.6)199 (9.2)230 (9.8) 234 (9.6) 15 8 (11.1)10 (7.4) Fistula of bile duct 763 (7.2) (-) 19 (3.6)61 (4.6)99 (4.6)190 (8.1) 209 (8.6) 164 (11.5)18 (13.2) Post-operative infecti o n s 568 (5.4) 10 (6.5)21 (4.0)71 (5.3)123 (5.7)137 (5.8) 119 (4.9) 76 (5.3)11 (8.1) Accidental operative laceration 266 (2.5) 0 15 (2.8)31 (2.3)50 (2.3)63 (2.7) 67 (2.8) 34 (2.4)(-) Post-operative hemorrhage 220 (2.1) (-) 12 (2.3)26 (1.9)35 (1.6)61 (2.6) 47 (1.9) 34 (2.4)(-) Disruption of external operation wound 103 (1.0) (-) (-) 11 (0.8)23 (1.1)24 (1.0) 22 (0.9) 1 5 ( 1.0)(-) Disruption of internal operation wound 69 (0.7) (-) (-) 11 (0.8)18 (0.8)18 (0.8) 12 (0.5) (-) (-) Intestinal fistula 29 (0.28) 0 (-) (-) (-) (-) (-) (-) 0 Deep vein thrombosis 98 (0.9) 0 (-) (-) 11 (0.5)20 (0.9) 3 5 (1.4) 23 (1.6)(-) Abbreviations: N: number of patients ; (-): As per NIS database r eporting guidelines, values <10 are not shown in the table. Copyright © 2013 SciRes. JCT 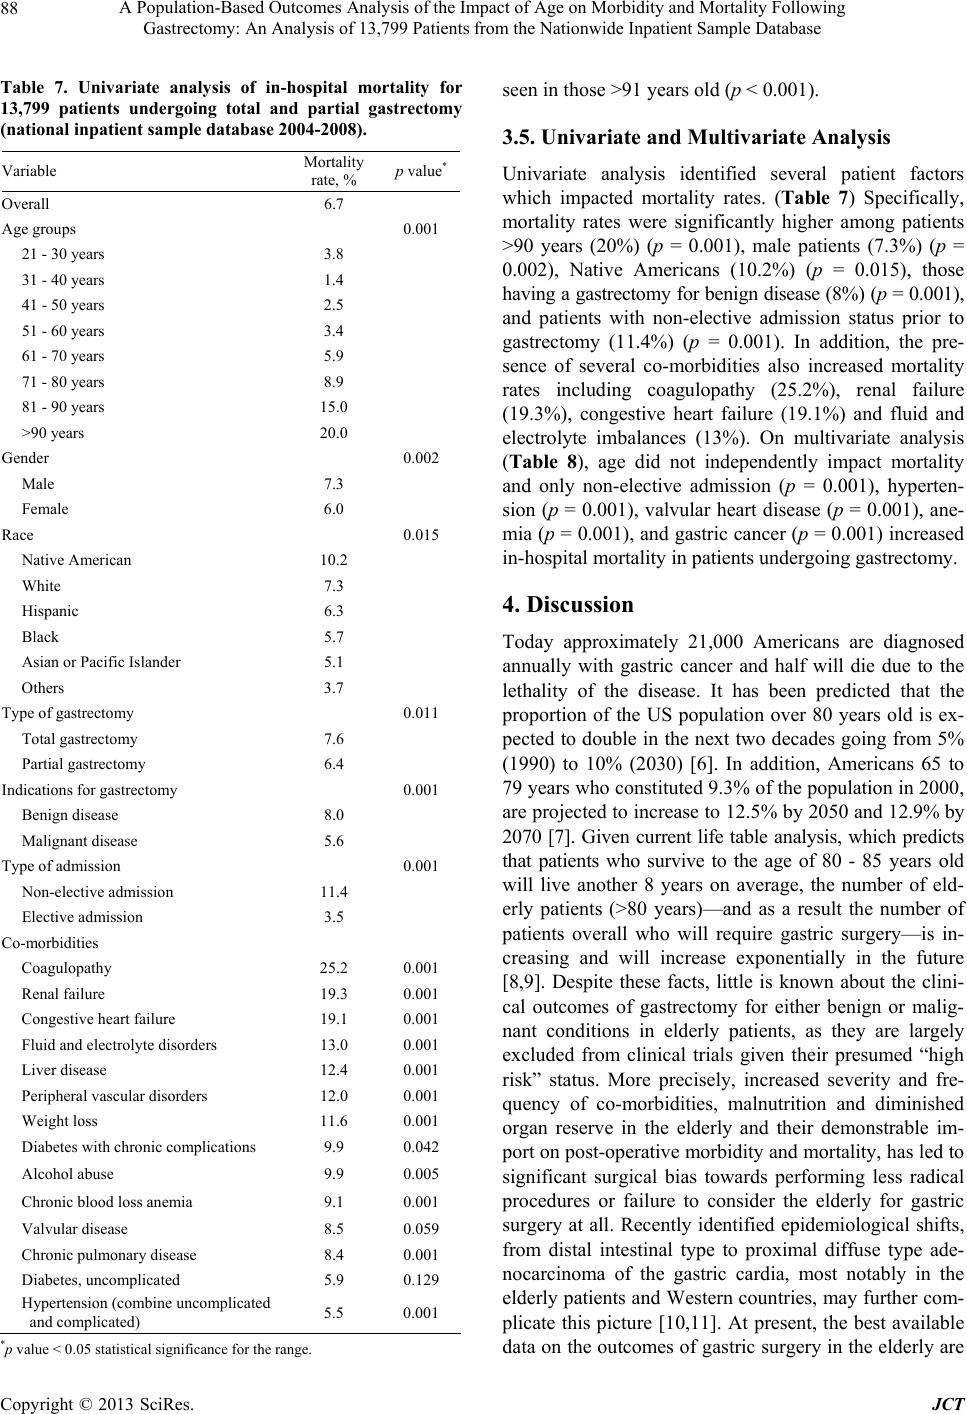 A Population-Based Outcomes Analysis of the Impact of Age on Morbidity and Mortality Following Gastrectomy: An Analysis of 13,799 Patients from the Nationwide Inpatient Sample Database Copyright © 2013 SciRes. JCT 88 Table 7. Univariate analysis of in-hospital mortality for 13,799 patients undergoing total and partial gastrectomy (national inpatient sample database 2004-2008). Variable Mortality rate, % p value* Overall 6.7 Age groups 0.001 21 - 30 years 3.8 31 - 40 years 1.4 41 - 50 years 2.5 51 - 60 years 3.4 61 - 70 years 5.9 71 - 80 years 8.9 81 - 90 years 15.0 >90 years 20.0 Gender 0.002 Male 7.3 Female 6.0 Race 0.015 Native American 10.2 White 7.3 Hispanic 6.3 Black 5.7 Asian or Pacific Islander 5.1 Others 3.7 Type of gastrectomy 0.011 Total gastrectomy 7.6 Partial gastrectomy 6.4 Indications for gastrectomy 0.001 Benign disease 8.0 Malignant disease 5.6 Type of admi s s i o n 0.001 Non-elective admission 11.4 Elective admission 3.5 Co-morbidities Coagulopathy 25.2 0.001 Renal failure 19.3 0.001 Congestive heart failure 19.1 0.001 Fluid and electroly te disorders 13.0 0.001 Liver disease 12.4 0.001 Peripheral vascular disorders 12.0 0.001 Weight loss 11.6 0.001 Diabetes with chronic complications 9.9 0.042 Alcohol abuse 9.9 0.005 Chronic blood loss anemia 9.1 0.001 Valvular disease 8.5 0.059 Chronic pulmonary disease 8.4 0. 0 0 1 Diabetes, uncomp licated 5.9 0.129 Hypertension (combine uncomplicated and complicated) 5.5 0.001 *p value < 0.05 statistical significance for the range. seen in those >91 years old (p < 0.001). 3.5. Univariate and Multivariate Analysis Univariate analysis identified several patient factors which impacted mortality rates. (Table 7) Specifically, mortality rates were significantly higher among patients >90 years (20%) (p = 0.001), male patients (7.3%) (p = 0.002), Native Americans (10.2%) (p = 0.015), those having a gastrectomy for benign disease (8%) (p = 0.001), and patients with non-elective admission status prior to gastrectomy (11.4%) (p = 0.001). In addition, the pre- sence of several co-morbidities also increased mortality rates including coagulopathy (25.2%), renal failure (19.3%), congestive heart failure (19.1%) and fluid and electrolyte imbalances (13%). On multivariate analysis (Table 8), age did not independently impact mortality and only non-elective admission (p = 0.001), hyperten- sion (p = 0.001), valvular heart disease (p = 0.001), ane- mia (p = 0.001), and g astric cancer (p = 0.001) incr eased in-hospital mortality in p a tients undergoing gastrectomy. 4. Discussion Today approximately 21,000 Americans are diagnosed annually with gastric cancer and half will die due to the lethality of the disease. It has been predicted that the proportion of the US population over 80 years old is ex- pected to double in the next two decades going from 5% (1990) to 10% (2030) [6]. In addition, Americans 65 to 79 years who con stituted 9.3% of the population in 2000, are projected to increase to 12.5% by 20 50 and 12.9% by 2070 [7]. Given current life table analysis, which predicts that patients who survive to the age of 80 - 85 years old will live another 8 years on average, the number of eld- erly patients (>80 years)—and as a result the number of patients overall who will require gastric surgery—is in- creasing and will increase exponentially in the future [8,9]. Despite these facts, little is known about the clini- cal outcomes of gastrectomy for either benign or malig- nant conditions in elderly patients, as they are largely excluded from clinical trials given their presumed “high risk” status. More precisely, increased severity and fre- quency of co-morbidities, malnutrition and diminished organ reserve in the elderly and their demonstrable im- port on post-operative morbidity and mortality, has led to significant surgical bias towards performing less radical procedures or failure to consider the elderly for gastric surgery at all. Recently identified epidemiological shifts, from distal intestinal type to proximal diffuse type ade- nocarcinoma of the gastric cardia, most notably in the elderly patients and Western countries, may further com- plicate this picture [10,11]. At present, the best available data on the outcomes of gastric surgery in the elderly are 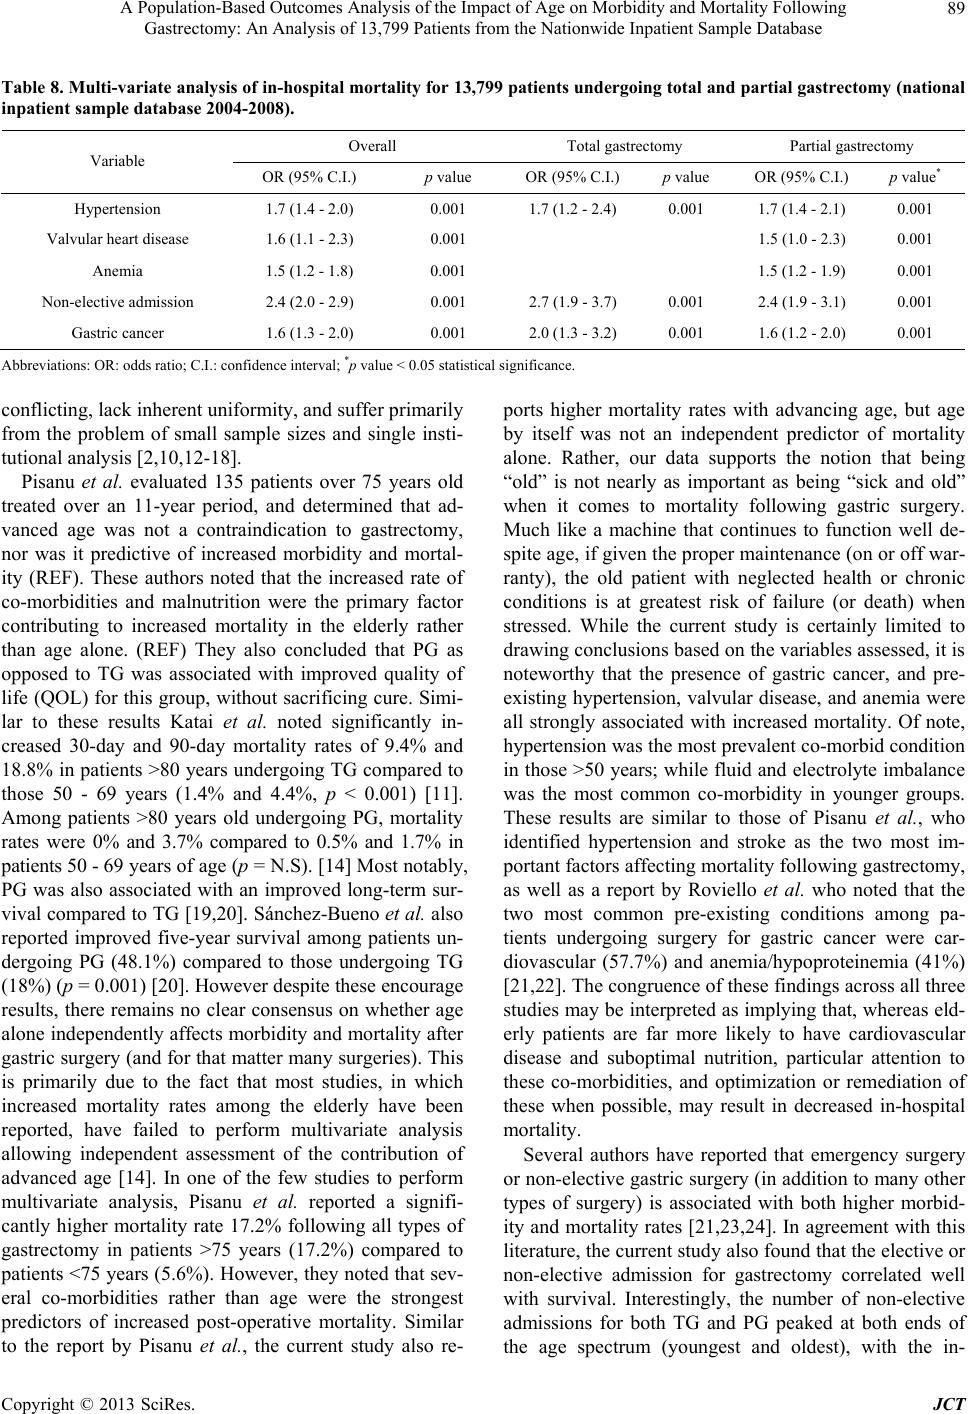 A Population-Based Outcomes Analysis of the Impact of Age on Morbidity and Mortality Following Gastrectomy: An Analysis of 13,799 Patients from the Nationwide Inpatient Sample Database 89 Table 8. Multi-variate analysis of in-hospital mortality for 13,799 patients undergoing total and partial gastrectomy (national inpatient sample database 2004-2008). Overall Total gastrectomy Partial gastrectomy Variable OR (95% C.I.) p value OR (95% C.I.)p value OR (95% C.I.) p value* Hypertension 1.7 (1.4 - 2.0) 0.001 1.7 (1.2 - 2.4) 0.001 1.7 (1.4 - 2.1) 0.001 Valvular heart disease 1.6 (1.1 - 2.3) 0.001 1.5 (1.0 - 2.3) 0.00 1 Anemia 1.5 (1.2 - 1.8) 0.001 1.5 (1.2 - 1.9) 0.001 Non-elective admission 2.4 (2.0 - 2.9) 0.001 2.7 (1.9 - 3.7) 0.001 2.4 (1.9 - 3.1) 0.001 Gastric cancer 1.6 (1.3 - 2.0) 0. 00 1 2.0 (1.3 - 3.2) 0.001 1.6 (1.2 - 2.0) 0.001 Abbreviations: OR: odds ratio; C.I.: confidence interval; *p value < 0.05 statistical signif icance. conflicting, lack inh eren t unifo rmity, and suffer pr imarily from the problem of small sample sizes and single insti- tutional an alysis [2,10,12-18]. Pisanu et al. evaluated 135 patients over 75 years old treated over an 11-year period, and determined that ad- vanced age was not a contraindication to gastrectomy, nor was it predictive of increased morbidity and mortal- ity (REF). These authors noted that the increased rate of co-morbidities and malnutrition were the primary factor contributing to increased mortality in the elderly rather than age alone. (REF) They also concluded that PG as opposed to TG was associated with improved quality of life (QOL) for this group, without sacrificing cure. Simi- lar to these results Katai et al. noted significantly in- creased 30-day and 90-day mortality rates of 9.4% and 18.8% in patients >80 years undergoing TG compared to those 50 - 69 years (1.4% and 4.4%, p < 0.001) [11]. Among patients >80 years old undergoing PG, mortality rates were 0% and 3.7% compared to 0.5% and 1.7% in patients 50 - 69 year s of ag e (p = N.S). [14] Most notably, PG was also associated with an improved long-term sur- vival compared to TG [19,20]. Sánchez-Bueno et al. also reported improved five-year survival among patients un- dergoing PG (48.1%) compared to those undergoing TG (18%) (p = 0.001) [20]. However despite these encourage results, there remains no clear consensus on whether age alone independently affects morbidity and mortality after gastric surgery (and for that matter many surgeries). This is primarily due to the fact that most studies, in which increased mortality rates among the elderly have been reported, have failed to perform multivariate analysis allowing independent assessment of the contribution of advanced age [14]. In one of the few studies to perform multivariate analysis, Pisanu et al. reported a signifi- cantly higher mortality rate 17.2% following all types of gastrectomy in patients >75 years (17.2%) compared to patients <75 years (5.6%). However, they noted that sev- eral co-morbidities rather than age were the strongest predictors of increased post-operative mortality. Similar to the report by Pisanu et al., the current study also re- ports higher mortality rates with advancing age, but age by itself was not an independent predictor of mortality alone. Rather, our data supports the notion that being “old” is not nearly as important as being “sick and old” when it comes to mortality following gastric surgery. Much like a machine that continues to function well de- spite age, if giv en the p roper mainten ance (on or off war- ranty), the old patient with neglected health or chronic conditions is at greatest risk of failure (or death) when stressed. While the current study is certainly limited to drawing conclusions b ased on the variables assessed, it is noteworthy that the presence of gastric cancer, and pre- existing hypertension, valvular disease, and anemia were all strongly associated with increased mortality. Of note, hypertension was the most prevalent co-morbid condition in those >50 years; while fluid and electrolyte i mbalance was the most common co-morbidity in younger groups. These results are similar to those of Pisanu et al., who identified hypertension and stroke as the two most im- portant factors affecting mortality following gastrectomy, as well as a report by Roviello et al. who noted that the two most common pre-existing conditions among pa- tients undergoing surgery for gastric cancer were car- diovascular (57.7%) and anemia/hypoproteinemia (41%) [21,22]. The congruence of these findings across all three studies may be interpreted as implying that, whereas eld- erly patients are far more likely to have cardiovascular disease and suboptimal nutrition, particular attention to these co-morbidities, and optimization or remediation of these when possible, may result in decreased in-hospital mortality. Several authors have reported that emergency surgery or non-elective gastric surgery (in addition to many other types of surgery) is associated with both higher morbid- ity and mortality rates [21,23,24]. In agreement with this literature, the current study also found that the elective or non-elective admission for gastrectomy correlated well with survival. Interestingly, the number of non-elective admissions for both TG and PG peaked at both ends of the age spectrum (youngest and oldest), with the in- Copyright © 2013 SciRes. JCT  A Population-Based Outcomes Analysis of the Impact of Age on Morbidity and Mortality Following Gastrectomy: An Analysis of 13,799 Patients from the Nationwide Inpatient Sample Database 90 creased number of non-elective admissions in the PG group compared to the TG group perhaps indicative of surgical bias and teaching, which urges performing the least radical procedure necessary in the sick patient. Published reports of increased medical and surgical complications post gastrectomy among the elderly are numerous, and unifor mly comment on decreased compli- cations when performing PG compared to TG—albeit this is not just in the elderly population [22,25,26]. Gas- trointestinal (GI) complications (11.3%) were the most common surgical complication noted in the current study (ICD 997.4). Medical complications were noted in 16% of patients, and were far more of a concern in TG pa- tients (23.6%) than PG patients (13.6%). In the TG group, the most common complication overall was respiratory issues (18%) which is similar to the findings of Bittner et al. [10]. While Bitner et al. did report on variations in complications between gastrectomy patients <70 and >70 years, the current report is the first study to analyze com- plications by decade. It is quite clear from the current results that the increased morbidity in elderly patients comes primarily in the form of medical complications (namely respiratory and cardiac events) and not surgical complications. (Tables 6(a) and (b)) Furthermore, car- diac events occurred at nearly twice the rate in the TG (6.1%) compare that PG group (3.2%). Taken on the who le, these results support the notion that when feasible, PG is the preferred surgical therapy in elderly patients (particularly in those with pre-existing co-morbidities that may increase the likelihood of post-operative com- plications). The limitations of the study are that it is primarily ret- rospective in nature, as well as those factors inherent in working with large administrative databases. Complica- tions that may have occurred post-discharge or on re- admission within 30 days of procedure were not neces- sarily captured by the data set. That said, the underesti- mation of the actual complication rates should apply across all patients equally and thus not alter the findings of this report. In addition, the current study is limited by errors in cod ing that may have occurred at the time of the hospitalization. Under-reporting of co-morbidities in elderly patients is another potential limitation due to not including confounding factors like frailty, in which three or more of these following criteria are present: uninten- tional weight loss, exhaustion, weakness, slow walking speed, and low physical activity [27]. Finally, this study did not differentiate between stages of disease or extent of lymphadenectomy performed which could affect out- comes. In summary, age alone is not an independent factor predictive of increased mortality following gastrectomy, while non-elective admissions, gastric cancer, hyperten- sion, valvular disease and anemia are. That said, whereas the elderly are more likely to be afflicted with these (and other co-morbidities), as well as to suffer from increased rates of post-operative morbidity, these results imply that surgical risk stratification of patients considered from gastrectomy, should focus primarily on the overall pre- operative status of the patient’s health rather than their chronologic age. Can gastrectomy be safely performed in elderly patients with acceptable clinical outcomes? The answer is yes. That said, all efforts should be made to optimize the patients remediable pre-operative co-mor- bidities prior to elective procedures, and provide appro- priate counseling regarding the risks and expected post- operative course. Which type of gastrectomy is safer or preferred in the elderly patient remains a more difficult question to answer. While all surgeons have as their mantra “do no harm” and should select the least radical operation with similar outcomes and lowest anticipated morbidity/mortality, these goals must be undertaken aga- inst a backdrop of following sound surgical oncologic principles, by achieving a negative margin and adequate information to permit appropriate staging. REFERENCES [1] R. F. Saidi, J. L. Bell and P. S. Dudrick, “Surgical Resec- tion for Gastric Cancer in Elderly Patients: Is There a Dif- ference in Outcome? ” Journal of Surgical Research, Vol. 118, No. 1, 2004, pp. 15-20. doi:10.1016/S0022-4804(03)00353-6 [2] K. Hanazaki, M. Wakabayashi, H. Sodeyama, et al., “Sur- gery for Gastric Cancer in Patients Older than 80 Years of Age,” Hepatogastroenterology, Vol. 45, No. 19, 1998, pp. 268-275. [3] W. C. Meyers, R. J. Damiano Jr., F. S. Rotolo and R. W. Postlethwait, “Adenocarcinoma of the Stomach. Chang- ing Patterns over the Last 4 Decades,” Annals of Surgery, Vol. 205, No. 1, 1987, pp. 1-8. doi:10.1097/00000658-198701000-00001 [4] D. M. Parkin, P. Pisani and J. Ferlay, “Estimates of the Worldwide Incidence of Eighteen Major Ca ncers in 1985,” International Journal of Cancer, Vol. 54, No. 4, 1993, pp. 594-606. doi:10.1002/ijc.2910540413 [5] B. Martella, C. Militello, S. Spirch, et al., “Palliative Sur- gery for Gastric Cancer in Elderly Patients,” Acta Bio- Medica, Vol. 76, Suppl. 1, 2005, pp. 49-51. [6] B. Cartier, “Carotid Surgery in Octogenarians: Why Not?” Annals of Vascular Surgery, Vol. 16, No. 6, 2002, pp. 751-755. doi:10.1007/s10016-001-0243-0 [7] United States Census Bureau, 2012. http://www.census.gov/population/www/projections/natd et-d1a.html [8] I. Matsushita, H. Hanai, M. Kajimura, et al., “Should Gastric Cancer Patients more than 80 Years of Age Un- dergo Surgery? Comparison with Patients Not Treated Copyright © 2013 SciRes. JCT  A Population-Based Outcomes Analysis of the Impact of Age on Morbidity and Mortality Following Gastrectomy: An Analysis of 13,799 Patients from the Nationwide Inpatient Sample Database Copyright © 2013 SciRes. JCT 91 Surgically Concerning Prognosis and Quality of Life,” Journal of Clinical Gastroenterology, Vol. 35, No. 1, 2002, pp. 29-34. doi:10.1097/00004836-200207000-00008 [9] R. J. McKenna Sr., “Clinical Aspects of Cancer in the Eld- erly. Treatment Decisions, Treatment Choices, and Follow- Up,” Cancer, Vol. 74, Su ppl. 7, 1994 , pp. 21 07-2117. doi:10.1002/1097-0142(19941001)74:7+<2107::AID-CN CR2820741719>3.0.CO;2-1 [10] R. Bittner, M. Butters, M. Ulrich, S. Uppenbrink and H. G. Beger, “Total Gastrectomy. Updated Operative Mor- tality and Long-Term Survival with Particular Reference to Patients Older than 70 Years of Age,” Annals of Sur- gery, Vol. 224, No. 1, 1996, pp. 37-42. doi:10.1097/00000658-199607000-00006 [11] P. Lauren, “The Two Histological Main Types of Gastric Carcinoma: Diffuse and So-Called Intestinal-Type Car- cinoma. An Attempt at a Histo-Clinical Classification,” Acta Pathologica et Microbiologica Scandinavica, Vol. 64, No. 1, 1965, pp. 31-49. [12] T. Bandoh, T. Isoyama and H. Toyoshima, “Total Gas- trectomy for Gastric Cancer in the Elderly,” Surgery, Vol. 109, No. 2, 1991, pp. 136-142. [13] S. Ishigami, S. Natsugoe, T. Saihara, et al., “Clinical and Pathologic Features of Early Gastric Cancer in Elderly Patients,” Hepatogastroenterolo gy, Vol. 44, No. 16, 1997, pp. 1164-1168. [14] H. Katai, M. Sasako, T. Sano and K. Maruyama, “The Outcome of Surgical Treatment for Gastric Carcinoma in the Elderly,” Japanese Journal of Clinical Oncology, Vol. 28, No. 2, 1998, pp. 112-115. doi:10.1093/jjco/28.2.112 [15] K. Kitamura, T. Yamaguchi, H. Taniguchi et al., “Clini- copathological Characteristics of Gastric Cancer in the Elderly,” British Journal of Cancer, Vol. 73, No. 6, 1996, pp. 798-802. doi:10.1038/bjc.1996.139 [16] H. Kubota, T. Kotoh, D. K. Dhar, et al., “Gastric Resec- tion in the Aged (> or = 80 Years) with Gastric Carci- noma: A Multivariate Analysis of Prognostic Factors,” Australian and New Zealand Journal of Surgery, Vol. 70, No. 4, 2000, pp. 254-257. doi:10.1046/j.1440-1622.2000.01802.x [17] Y. Maehara, T. Oshiro, H. Oiwa, et al., “Gastric Carci- noma in Patients over 70 Years of Age,” British Journal of Surgery, Vol. 82, No. 1, 1995, pp. 102-105. doi:10.1002/bjs.1800820134 [18] Y. Maehara, Y. Emi, S. Tomisaki, et al., “Age-Related Cha r a c teristics of Ga stric Carcinoma in Youn g and Elderly Patients,” Cance r, Vol. 77, No. 9, 1996, pp. 1774-1780. doi:10.1002/(SICI)1097-0142(19960501)77:9<1774::AID -CNCR3>3.0.CO;2-C [19] H. J. Meyer, J. Jahne, H. Wilke and R. Pichlmayr, “Sur- gical Treatment of Gastric Cancer: Retrospective Survey of 1704 Operated Cases with Special Reference to Total Gastrectomy as the Operation of Choice,” Seminars in Surgical Oncology, Vol. 7, No. 6, 1991, pp. 356-364. doi:10.1002/ssu.2980070607 [20] F. Sanchez-Bueno, J. A. Garcia-Marcilla, D. Perez-Flores, et al., “Prognostic Factors in a Series of 297 Patients with Gastric Adenocarcinoma Undergoing Surgical Resec- tion,” British Journal of Surgery, Vol. 85, No. 2, 1998, pp. 255-260. doi:10.1046/j.1365-2168.1998.00558.x [21] F. Roviello, D. Marrelli, S. A. De, A. Messano, E. Pinto and A. Carli, “Complications after Surgery for Gastric Cancer in Patients Aged 80 Years and over,” Japanese Journal of Clinical Oncology, Vol. 28, No. 2, 1998, pp. 116-122. doi:10.1093/jjco/28.2.116 [22] A. Pisanu, A. Montisci, S. Piu and A. Uccheddu, “Cura- tive Surgery for Gastric Cancer in the Elderly: Treatment Decisions, Surgical Morbidity, Mortality, Prognosis and Quality of Life,” Tumori, Vol. 93, No. 5, 2007, pp. 478- 484. [23] A. G. Greenburg, R. P. Saik, J. J. Coyle and G. W. Peskin, “Mortality and Gastrointestinal Surgery in the Aged: Elec- tive vs. Emergency Procedures,” Archives of Surgery, Vol. 116, No. 6, 1981, pp. 788-791. doi:10.1001/archsurg.1981.01380180046009 [24] C. W. Wu, S. S. Lo, K. H. Shen, M. C. Hsieh, W. Y. Lui and F. K. P’eng, “Surgical Mortality, Survival, and Qual- ity of Life after Resection for Gastric Cancer in the Eld- erly,” World Journal of Surgery, Vol. 24, No. 4, 2000, pp. 465-472. doi:10.1007/s002689910074 [25] F. Bozzetti, “Total versus Subtotal Gastrectomy in Cancer of the Distal Stomach: Facts and Fantasy,” European Journal of Surgical Oncology, Vol. 18, No. 6, 1992, pp. 572-579. [26] J. Davies, D. Johnston, H. Sue-Ling, et al., “Total or Sub- total Gastrectomy for Gastric Carcinoma? A Study of Quality of Life,” World Journal of Surgery, Vol. 22, No. 10, 1998, pp. 1048-1055. doi:10.1007/s002689900515 [27] J. A. Sosa, P. J. Mehta, T. S. Wang, L. Boudourakis and S. A. Roman, “A Population-Based Study of Outcomes from Thyroidectomy in Aging Americans: At What Cost?” Journal of the American College of Surgeons, Vol. 206, No. 3, 2008, pp. 1097-1105. doi:10.1016/j.jamcollsurg.2007.11.023
|