Paper Menu >>
Journal Menu >>
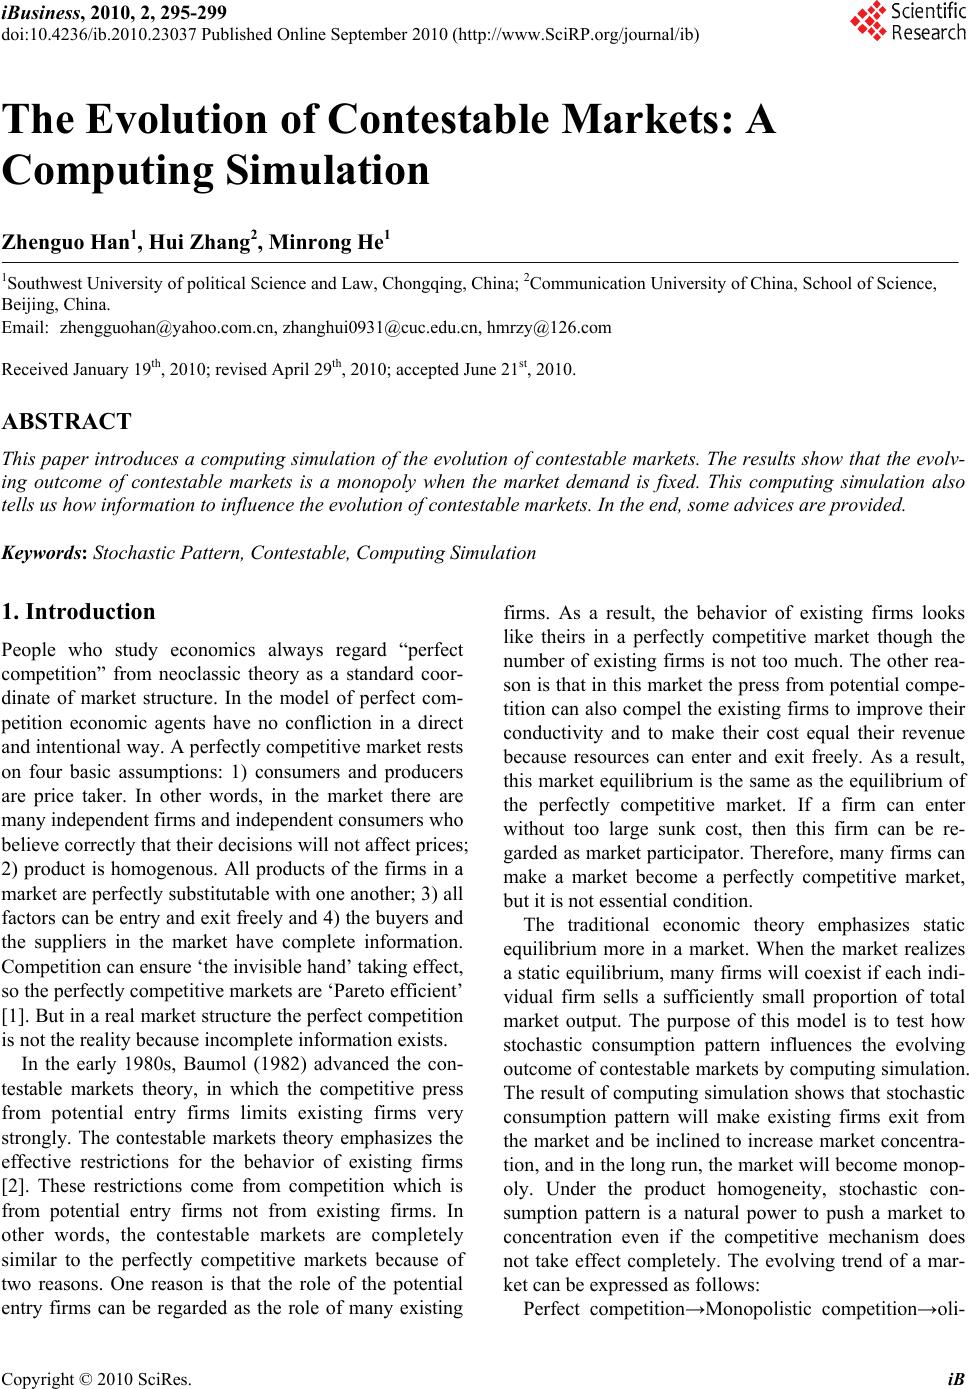 iBusiness, 2010, 2, 295-299 doi:10.4236/ib.2010.23037 Published Online September 2010 (http://www.SciRP.org/journal/ib) Copyright © 2010 SciRes. iB The Evolution of Contestable Markets: A Computing Simulation Zhenguo Han1, Hui Zhang2, Minrong He1 1Southwest University of political Science and Law, Chongqing, China; 2Communication University of China, School of Science, Beijing, China. Email: zhengguohan@yahoo.com.cn, zhanghui0931@cuc.edu.cn, hmrzy@126.com Received January 19th, 2010; revised April 29th, 2010; accepted June 21st, 2010. ABSTRACT This paper introduces a computing simulation of the evolution of contestable markets. The results show that the evolv- ing outcome of contestable markets is a monopoly when the market demand is fixed. This computing simulation also tells us how information to influence the evolution of contestable markets. In the end, some advices are provided. Keywords: Stochastic Pattern, Contestable, Computing Simulation 1. Introduction People who study economics always regard “perfect competition” from neoclassic theory as a standard coor- dinate of market structure. In the model of perfect com- petition economic agents have no confliction in a direct and intentional way. A perfectly competitive market rests on four basic assumptions: 1) consumers and producers are price taker. In other words, in the market there are many independent firms and independent consumers who believe correctly that their decisions will not affect prices; 2) product is homogenous. All products of the firms in a market are perfectly substitutable with one another; 3) all factors can be entry and exit freely and 4) the buyers and the suppliers in the market have complete information. Competition can ensure ‘the invisible hand’ taking effect, so the perfectly competitive markets are ‘Pareto efficient’ [1]. But in a real market structure the perfect competition is not the reality because incomplete information exists. In the early 1980s, Baumol (1982) advanced the con- testable markets theory, in which the competitive press from potential entry firms limits existing firms very strongly. The contestable markets theory emphasizes the effective restrictions for the behavior of existing firms [2]. These restrictions come from competition which is from potential entry firms not from existing firms. In other words, the contestable markets are completely similar to the perfectly competitive markets because of two reasons. One reason is that the role of the potential entry firms can be regarded as the role of many existing firms. As a result, the behavior of existing firms looks like theirs in a perfectly competitive market though the number of existing firms is not too much. The other rea- son is that in this market the press from potential compe- tition can also compel the existing firms to improve their conductivity and to make their cost equal their revenue because resources can enter and exit freely. As a result, this market equilibrium is the same as the equilibrium of the perfectly competitive market. If a firm can enter without too large sunk cost, then this firm can be re- garded as market participator. Therefore, many firms can make a market become a perfectly competitive market, but it is not essential condition. The traditional economic theory emphasizes static equilibrium more in a market. When the market realizes a static equilibrium, many firms will coexist if each indi- vidual firm sells a sufficiently small proportion of total market output. The purpose of this model is to test how stochastic consumption pattern influences the evolving outcome of contestable markets by computing simulation. The result of computing simulation shows that stochastic consumption pattern will make existing firms exit from the market and be inclined to increase market concentra- tion, and in the long run, the market will become monop- oly. Under the product homogeneity, stochastic con- sumption pattern is a natural power to push a market to concentration even if the competitive mechanism does not take effect completely. The evolving trend of a mar- ket can be expressed as follows: Perfect competition→Monopolistic competition→oli- 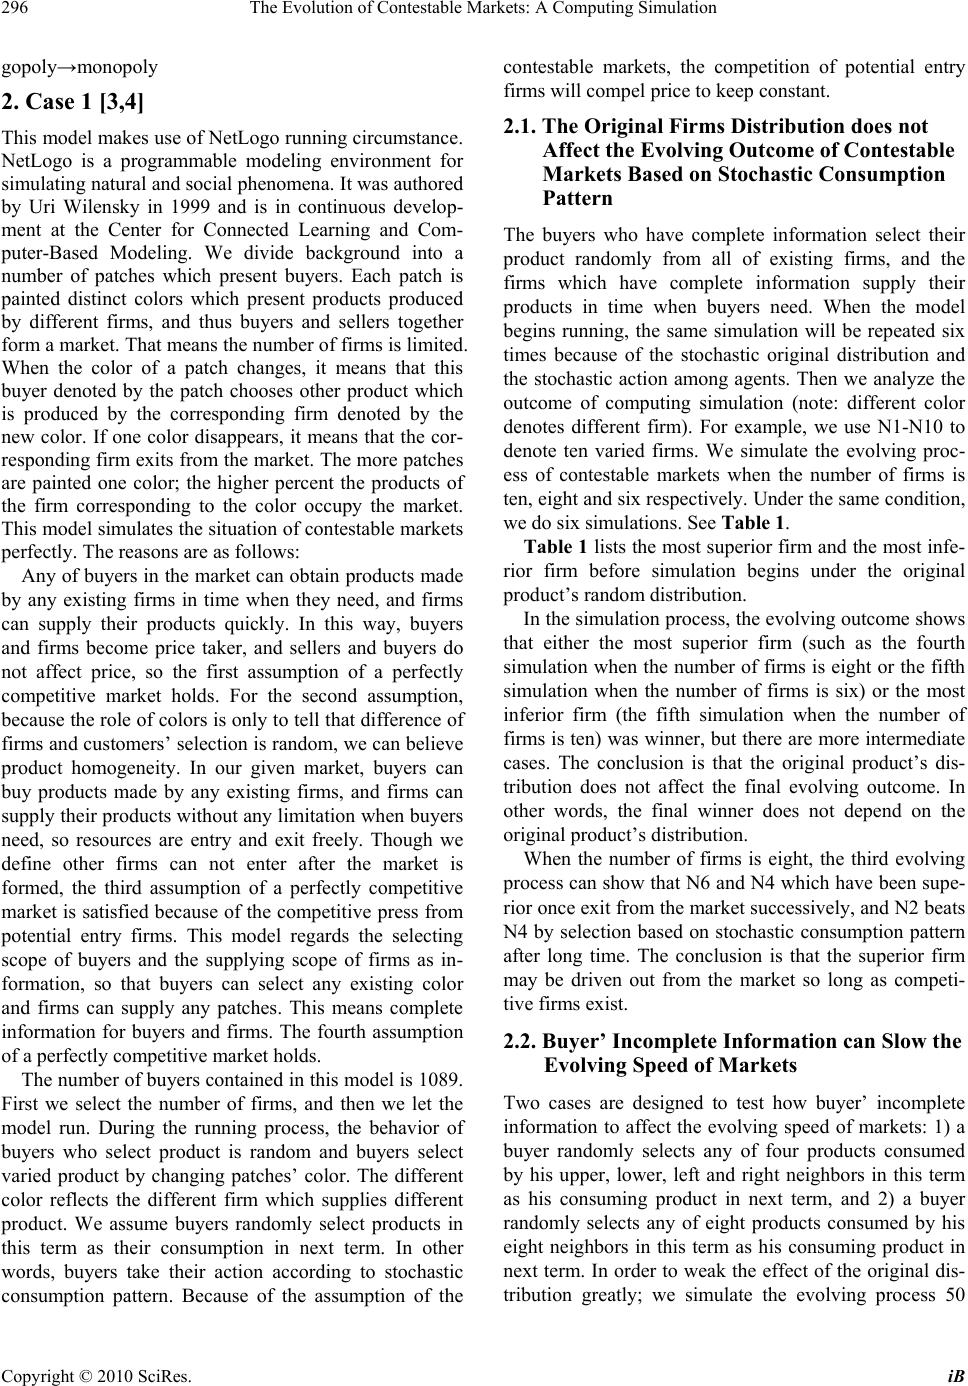 The Evolution of Contestable Markets: A Computing Simulation Copyright © 2010 SciRes. iB 296 gopoly→monopoly 2. Case 1 [3,4] This model makes use of NetLogo running circumstance. NetLogo is a programmable modeling environment for simulating natural and social phenomena. It was authored by Uri Wilensky in 1999 and is in continuous develop- ment at the Center for Connected Learning and Com- puter-Based Modeling. We divide background into a number of patches which present buyers. Each patch is painted distinct colors which present products produced by different firms, and thus buyers and sellers together form a market. That means the number of firms is limited. When the color of a patch changes, it means that this buyer denoted by the patch chooses other product which is produced by the corresponding firm denoted by the new color. If one color disappears, it means that the cor- responding firm exits from the market. The more patches are painted one color; the higher percent the products of the firm corresponding to the color occupy the market. This model simulates the situation of contestable markets perfectly. The reasons are as follows: Any of buyers in the market can obtain products made by any existing firms in time when they need, and firms can supply their products quickly. In this way, buyers and firms become price taker, and sellers and buyers do not affect price, so the first assumption of a perfectly competitive market holds. For the second assumption, because the role of colors is only to tell that difference of firms and customers’ selection is random, we can believe product homogeneity. In our given market, buyers can buy products made by any existing firms, and firms can supply their products without any limitation when buyers need, so resources are entry and exit freely. Though we define other firms can not enter after the market is formed, the third assumption of a perfectly competitive market is satisfied because of the competitive press from potential entry firms. This model regards the selecting scope of buyers and the supplying scope of firms as in- formation, so that buyers can select any existing color and firms can supply any patches. This means complete information for buyers and firms. The fourth assumption of a perfectly competitive market holds. The number of buyers contained in this model is 1089. First we select the number of firms, and then we let the model run. During the running process, the behavior of buyers who select product is random and buyers select varied product by changing patches’ color. The different color reflects the different firm which supplies different product. We assume buyers randomly select products in this term as their consumption in next term. In other words, buyers take their action according to stochastic consumption pattern. Because of the assumption of the contestable markets, the competition of potential entry firms will compel price to keep constant. 2.1. The Original Firms Distribution does not Affect the Evolving Outcome of Contestable Markets Based on Stochastic Consumption Pattern The buyers who have complete information select their product randomly from all of existing firms, and the firms which have complete information supply their products in time when buyers need. When the model begins running, the same simulation will be repeated six times because of the stochastic original distribution and the stochastic action among agents. Then we analyze the outcome of computing simulation (note: different color denotes different firm). For example, we use N1-N10 to denote ten varied firms. We simulate the evolving proc- ess of contestable markets when the number of firms is ten, eight and six respectively. Under the same condition, we do six simulations. See Table 1. Table 1 lists the most superior firm and the most infe- rior firm before simulation begins under the original product’s random distribution. In the simulation process, the evolving outcome shows that either the most superior firm (such as the fourth simulation when the number of firms is eight or the fifth simulation when the number of firms is six) or the most inferior firm (the fifth simulation when the number of firms is ten) was winner, but there are more intermediate cases. The conclusion is that the original product’s dis- tribution does not affect the final evolving outcome. In other words, the final winner does not depend on the original product’s distribution. When the number of firms is eight, the third evolving process can show that N6 and N4 which have been supe- rior once exit from the market successively, and N2 beats N4 by selection based on stochastic consumption pattern after long time. The conclusion is that the superior firm may be driven out from the market so long as competi- tive firms exist. 2.2. Buyer’ Incomplete Information can Slow the Evolving Speed of Markets Two cases are designed to test how buyer’ incomplete information to affect the evolving speed of markets: 1) a buyer randomly selects any of four products consumed by his upper, lower, left and right neighbors in this term as his consuming product in next term, and 2) a buyer randomly selects any of eight products consumed by his eight neighbors in this term as his consuming product in next term. In order to weak the effect of the original dis- tribution greatly; we simulate the evolving process 50 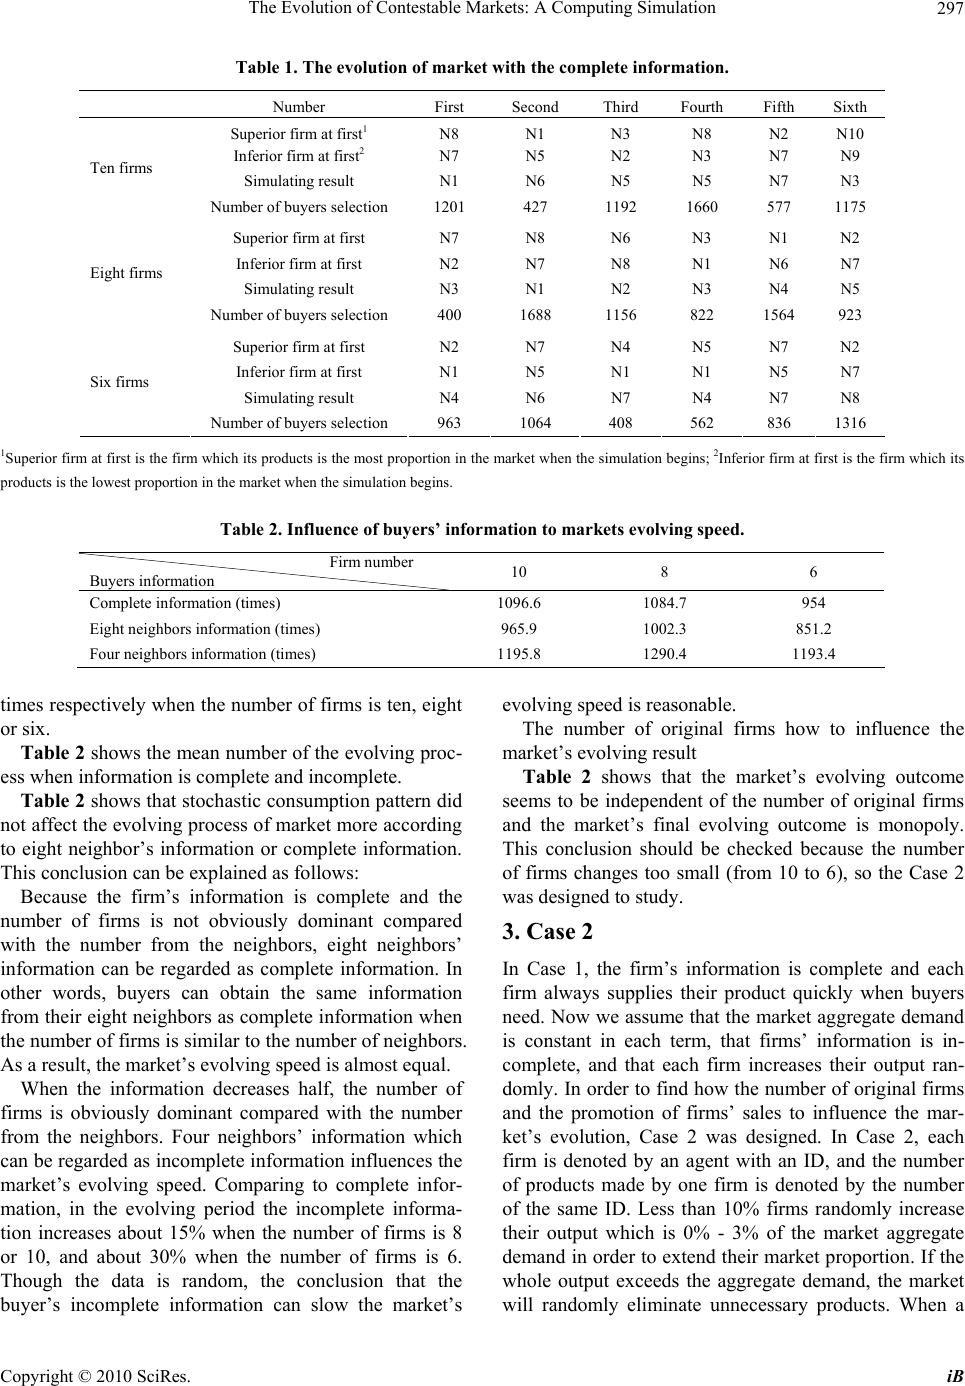 The Evolution of Contestable Markets: A Computing Simulation Copyright © 2010 SciRes. iB 297 Table 1. The evolution of market with the complete information. Number First Second Third Fourth Fifth Sixth Superior firm at first1 N8 N1 N3 N8 N2 N10 Inferior firm at first2 N7 N5 N2 N3 N7 N9 Simulating result N1 N6 N5 N5 N7 N3 Ten firms Number of buyers selection 1201 427 1192 1660 577 1175 Superior firm at first N7 N8 N6 N3 N1 N2 Inferior firm at first N2 N7 N8 N1 N6 N7 Simulating result N3 N1 N2 N3 N4 N5 Eight firms Number of buyers selection 400 1688 1156 822 1564 923 Superior firm at first N2 N7 N4 N5 N7 N2 Inferior firm at first N1 N5 N1 N1 N5 N7 Simulating result N4 N6 N7 N4 N7 N8 Six firms Number of buyers selection 963 1064 408 562 836 1316 1Superior firm at first is the firm which its products is the most proportion in the market when the simulation begins; 2Inferior firm at first is the firm which its products is the lowest proportion in the market when the simulation begins. Table 2. Influence of buyers’ information to markets evolving speed. Firm number Buyers information 10 8 6 Complete information (times) 1096.6 1084.7 954 Eight neighbors information (times) 965.9 1002.3 851.2 Four neighbors information (times) 1195.8 1290.4 1193.4 times respectively when the number of firms is ten, eight or six. Table 2 shows the mean number of the evolving proc- ess when information is complete and incomplete. Table 2 shows that stochastic consumption pattern did not affect the evolving process of market more according to eight neighbor’s information or complete information. This conclusion can be explained as follows: Because the firm’s information is complete and the number of firms is not obviously dominant compared with the number from the neighbors, eight neighbors’ information can be regarded as complete information. In other words, buyers can obtain the same information from their eight neighbors as complete information when the number of firms is similar to the number of neighbors. As a result, the market’s evolving speed is almost equal. When the information decreases half, the number of firms is obviously dominant compared with the number from the neighbors. Four neighbors’ information which can be regarded as incomplete information influences the market’s evolving speed. Comparing to complete infor- mation, in the evolving period the incomplete informa- tion increases about 15% when the number of firms is 8 or 10, and about 30% when the number of firms is 6. Though the data is random, the conclusion that the buyer’s incomplete information can slow the market’s evolving speed is reasonable. The number of original firms how to influence the market’s evolving result Table 2 shows that the market’s evolving outcome seems to be independent of the number of original firms and the market’s final evolving outcome is monopoly. This conclusion should be checked because the number of firms changes too small (from 10 to 6), so the Case 2 was designed to study. 3. Case 2 In Case 1, the firm’s information is complete and each firm always supplies their product quickly when buyers need. Now we assume that the market aggregate demand is constant in each term, that firms’ information is in- complete, and that each firm increases their output ran- domly. In order to find how the number of original firms and the promotion of firms’ sales to influence the mar- ket’s evolution, Case 2 was designed. In Case 2, each firm is denoted by an agent with an ID, and the number of products made by one firm is denoted by the number of the same ID. Less than 10% firms randomly increase their output which is 0% - 3% of the market aggregate demand in order to extend their market proportion. If the whole output exceeds the aggregate demand, the market will randomly eliminate unnecessary products. When a 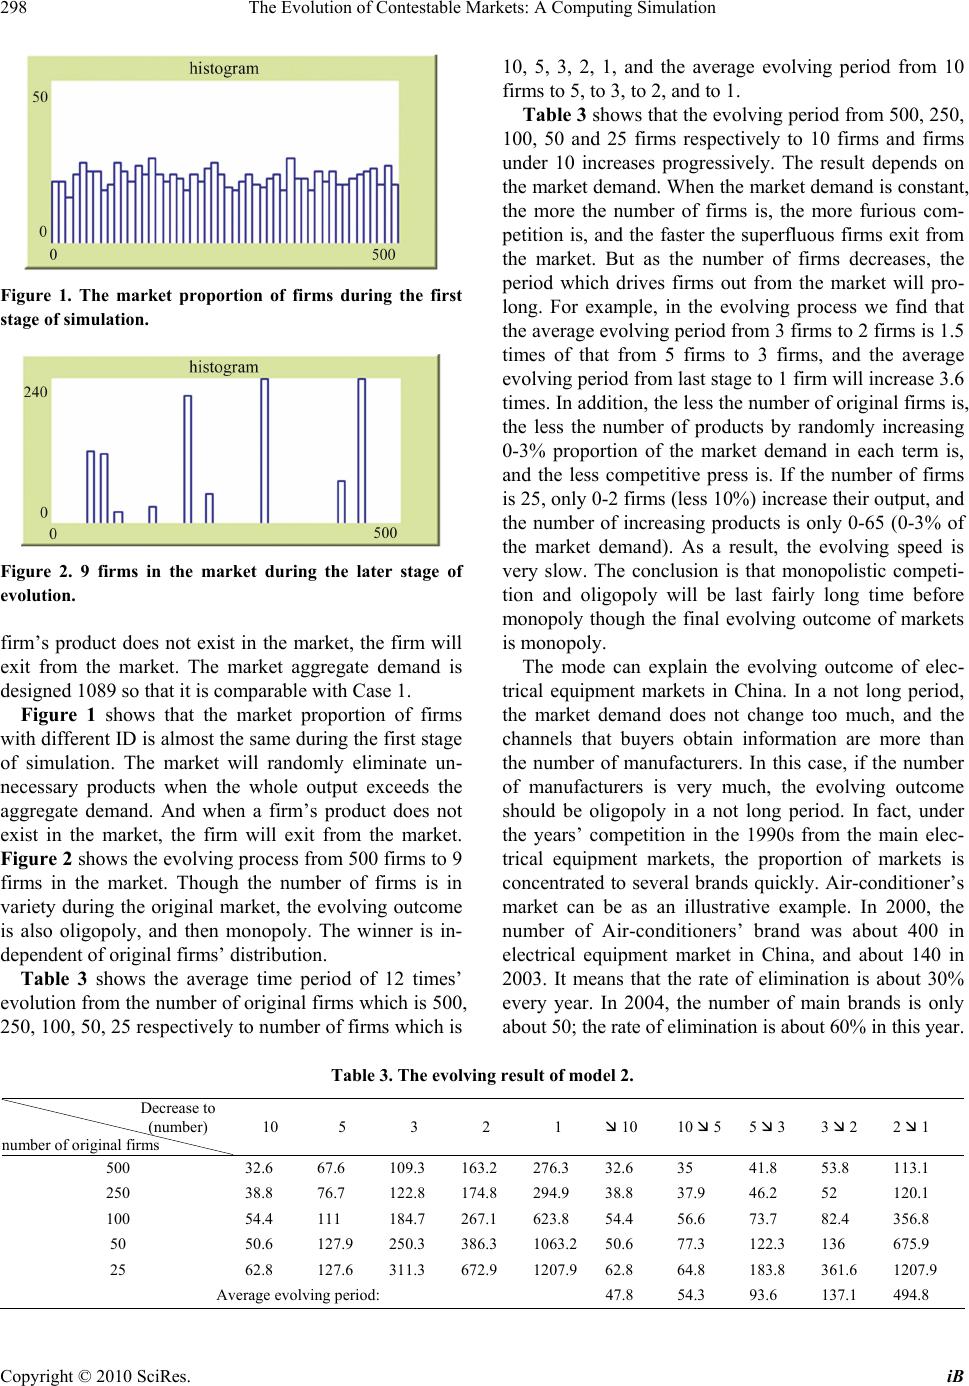 The Evolution of Contestable Markets: A Computing Simulation Copyright © 2010 SciRes. iB 298 Figure 1. The market proportion of firms during the first stage of simulation. Figure 2. 9 firms in the market during the later stage of evolution. firm’s product does not exist in the market, the firm will exit from the market. The market aggregate demand is designed 1089 so that it is comparable with Case 1. Figure 1 shows that the market proportion of firms with different ID is almost the same during the first stage of simulation. The market will randomly eliminate un- necessary products when the whole output exceeds the aggregate demand. And when a firm’s product does not exist in the market, the firm will exit from the market. Figure 2 shows the evolving process from 500 firms to 9 firms in the market. Though the number of firms is in variety during the original market, the evolving outcome is also oligopoly, and then monopoly. The winner is in- dependent of original firms’ distribution. Table 3 shows the average time period of 12 times’ evolution from the number of original firms which is 500, 250, 100, 50, 25 respectively to number of firms which is 10, 5, 3, 2, 1, and the average evolving period from 10 firms to 5, to 3, to 2, and to 1. Table 3 shows that the evolving period from 500, 250, 100, 50 and 25 firms respectively to 10 firms and firms under 10 increases progressively. The result depends on the market demand. When the market demand is constant, the more the number of firms is, the more furious com- petition is, and the faster the superfluous firms exit from the market. But as the number of firms decreases, the period which drives firms out from the market will pro- long. For example, in the evolving process we find that the average evolving period from 3 firms to 2 firms is 1.5 times of that from 5 firms to 3 firms, and the average evolving period from last stage to 1 firm will increase 3.6 times. In addition, the less the number of original firms is, the less the number of products by randomly increasing 0-3% proportion of the market demand in each term is, and the less competitive press is. If the number of firms is 25, only 0-2 firms (less 10%) increase their output, and the number of increasing products is only 0-65 (0-3% of the market demand). As a result, the evolving speed is very slow. The conclusion is that monopolistic competi- tion and oligopoly will be last fairly long time before monopoly though the final evolving outcome of markets is monopoly. The mode can explain the evolving outcome of elec- trical equipment markets in China. In a not long period, the market demand does not change too much, and the channels that buyers obtain information are more than the number of manufacturers. In this case, if the number of manufacturers is very much, the evolving outcome should be oligopoly in a not long period. In fact, under the years’ competition in the 1990s from the main elec- trical equipment markets, the proportion of markets is concentrated to several brands quickly. Air-conditioner’s market can be as an illustrative example. In 2000, the number of Air-conditioners’ brand was about 400 in electrical equipment market in China, and about 140 in 2003. It means that the rate of elimination is about 30% every year. In 2004, the number of main brands is only about 50; the rate of elimination is about 60% in this year. Table 3. The evolving result of model 2. Decrease to (number) number of original firms 10 5 3 2 1 10 10 5 5 3 3 2 2 1 500 32.6 67.6 109.3 163.2 276.3 32.6 35 41.8 53.8 113.1 250 38.8 76.7 122.8 174.8 294.9 38.8 37.9 46.2 52 120.1 100 54.4 111 184.7 267.1 623.8 54.4 56.6 73.7 82.4 356.8 50 50.6 127.9 250.3 386.3 1063.2 50.6 77.3 122.3 136 675.9 25 62.8 127.6 311.3 672.9 1207.9 62.8 64.8 183.8 361.6 1207.9 Average evolving period: 47.8 54.3 93.6 137.1 494.8  The Evolution of Contestable Markets: A Computing Simulation Copyright © 2010 SciRes. iB 299 In five years, nearly 90% air-conditioner’s manufacturers exit from the market. In other electrical equipment mar- kets in China, the situation is similar-over 60% propor- tion belonging to the first ten brands. In the retail market of electrical equipment, the market concentration is in- creasing, and the growth rate of turnover of the main retail traders, such as SuNing, GuoMei, are over 50% every year. The evolving outcome is fit for the Case 2. The current situation of electrical equipment market has some difference compared with the model in this paper. The main reason is that personal income increases more and the price of electrical equipment decreases quickly. These factors make the market demand change; therefore the market concentration is lower than that of the model simulation. This tells us how to effectively use the surplus capacity of electrical equipment trade. This conclusion gives an answer-adopting vigorous measure to exploit the rural market and to increase export. The life of a product how to influence the evolving speed The number of buyers’ selection times the life of the product equals the evolving time from the contestable markets to monopoly. So if other factors are fixed, the longer the life of the product is, the slower the evolving speed is. Even if the life of a product is only one day, the evolving time from the contestable markets to monopoly needs at least 1.36 years (Case 1), and 2.6 years (Case 2). If the life of a product is one week, the evolving time needs 9.5 years to 18 years. The conclusion is that mo- nopoly is impossible in the contestable markets if the only reason of the evolution is that consumers stochasti- cally select products or the market stochastically elimi- nates unnecessary products. 4. Conclusions and Suggestions The final evolving outcome of the contestable markets is monopoly though this process is very long. The incom- plete information of buyers and the incomplete informa- tion of firms have different influence to the evolving speed. Competition can short the evolving period. Fur- thermore, the longer the life of a product is, the more difficult the monopoly forms. The stochastic difference of the original factors cannot explain the difference of the evolving outcome. It means that the high proportion of one firm owning today cannot ensure that the firm will become winner tomorrow. So each firm should keep the sense of crisis, and never release. Those conclusions can instruct government to make policies. A government which believes that competition can gain maximum welfares should help new firms to enter the markets if the life of products is very short, and should make potential entry firms become real entry firms. This is an effective measure to stop monopoly. REFERENCES [1] Y. D. Yu, Y. Y. Zhang and B. W. Zheng, “Western Eco- nomics,” Economic Science Press, Beijing, 1997. [2] N. D. Steven and E. B. Lawrence, “The New Palgrave Dictionary of Economics,” Economic Science Press, Bei- jing, Vol. 2, 1996. [3] U. Wilensky, “NetLogo GenDrift P Global Model Center for Connected Learning and Computer-Based Modeling,” Northwestern University, Evanston, 2001. [4] U. Wilensky, “NetLogo GenDrift P Local Model,” Center for Connected Learning and Computer-Based Modeling, Northwestern University, Evanston, 2001. |