 Graphene, 2013, 2, 42-48 http://dx.doi.org/10.4236/graphene.2013.21006 Published Online January 2013 (http://www.scirp.org/journal/graphene) One Pot Synthesis of Graphene by Exfoliation of Graphite in ODCB Sumanta Sahoo, Goutam Hatui, Pallab Bhattacharya, Saptarshi Dhibar, Chapal Kumar Das* Materials Science Centre, Indian Institute of Technology, Kharagpur, India Email: *chapal12@yahoo.co.in Received November 14, 2012; revised December 18, 2012; accepted January 15, 2013 ABSTRACT Graphene, an extraordinary allotropy of carbon, the 2D nanosheet, have been synthesized through exfoliation of graph- ite in ortho-dichloro benzene by sonication. The morphological changes in different interval of sonication have been investigated by Scanning Electron Microscopy (SEM) and Transmission Electron Microscopy (TEM). Raman Spectra confirmed the formation of defect free Graphene sheets. As prepared Graphene showed high thermal stability under N2 atmosphere. It has been observed that sonication for 4 hours, effectively exfoliates graphite to form Graphene sheets. However, further sonication leads to restacking of Graphene sheets. The formation of Graphene is supposed to be due to the Sonopolymerization of the solvent (ortho-dichloro benzene) and graphite-solvent interaction. Keywords: Graphene; Graphite; Ortho-Dichloro Benzene; Sonication; Raman Spectra 1. Introduction The discovery of Graphene stimulates the scientists to unlock a new aspect in the field of nanoscience and nanotechnology. Graphene has become the “miracle ma- terial” of the 21st Century. It is considered as the thinnest material of today’s world. It has no band gap, which al- lows it to be a wonderful candidate for use in photo-vol- taic (PV) cells. Beside this, it has attracted great deal of research due to its excellent electrical conductivity, ex- traordinary mechanical properties, large surface area, high aspect ratio, low coefficient of thermal expansion [1-5]. Graphene is the flat layer of carbon atoms, com- pactly packed into a two-dimensional honeycomb lattice. It is expected that, with its outstanding properties, Gra- phene can replace Silicone in near future. However, great deal of researches has been done to synthesize single layer as well as multi-layer Graphene. Earlier, Graphene were synthesized by different procedures like mechanical exfoliation of graphite [6], Chemical vapor deposition method [7] etc. But these are not efficient method to synthesize Graphene in commercial scale. Chemical route is the most realistic as well as most promising method for Graphene synthesis from graphite. The simplest and most common method of graphite exfoliation is the oxidation of graphite to graphite oxide by strong oxidizing agent [8]. Further exfoliation and reduction of Graphene oxide forms chemically converted Graphene [9-11]. Though some other methods like thermal expansion [12], ball mixing, liquid phase exfoliation [13] etc. were tried to synthesize Graphene, but this oxidation-reduction meth- od is the most widely used method for large scale syn- thesis of Graphene. Though this method is most practical method, it also has some disadvantages like presence of defects, low yield, presence of harsh oxidation chemistry and long term reaction. The homogeneous Graphene dispersion in some com- mon organic solvents like benzene, toluene, nitrobenzene etc was reported [14]. Polar solvents like N, N-dimethyl- formamide (DMF), N-methylpyrrolidone (NMP) can also exfoliate graphite to form homogeneous Graphene dis- persion [15,16]. But, among the nonpolar solvents, ortho- dichloro benzene (ODCB) was reported to produce ho- mogeneous Graphene dispersion [17]. Here we have demonstrated one pot synthesis of Gra- phene through exfoliation of graphite in ODCB. The syn- thesis based only on sonication. We have studied the ef- fect of chlorinated organic molecules on the electronic structure of Graphene upon sonication. Further, we have tried to find the mechanism of the formation of Graphene through exfoliation of graphite. Sonication for a particu- lar time interval leads complete dispersion of graphite molecules in ODCB to form homogeneous dispersion of Graphene. Further, the electronic structure of Graphene has been characterized by FTIR, SEM, TEM and Raman spectra. The advantages of this synthesis method are its simplicity, absence of long term synthetic route and high yield. ODCB is a versatile, high boiling solvent. It is a pre- *Corresponding author. C opyright © 2013 SciRes. Graphene  S. SAHOO ET AL. 43 ferred solvent for dissolving fullerenes and also it can form stable Single Wall Carbon Nano tube (SWCNT) dispersion. However the reasons behind the choice of this solvent for graphiteexfoliation were well described by Hamilton et al. [16]. Additionally one of the major ad- vantages of ODCB is, like other organic halides, it is also known to decompose during sonication to liberate chlo- rine and polymerize [17,18]. 2. Experimental 2.1. Materials Used Graphite Fine Powder (Extra Pure) was obtained from Loba Chemie Pvt. Ltd. Mumbai (India). 1,2-dichloro benzene was supplied by MERCK Limited. Mumbai (India). Both the chemicals used as received, without any further distillation or purification. 2.2. Synthesis of ODCB Suspension of Graphene Stable homogeneous dispersion of Graphene was ob- tained through a simple chemical approach [16]. In a typical process, Graphite (1 gm) was mixed with ODCB (300 ml) in a beaker. The black colored solution was homogenized for different time interval in an ultrasonic bath (Freq. 40 KHz and Power 100 W). All the solutions were heated at 185˚C for solvent evaporation. The sam- ple codes with sonication time are shown in the Table 1. After each time interval (1 hr) some solution were taken out from the beaker and kept in sample vial for charac- terization. All the sample vials were kept for one month in room temperature in order to verify stable dispersion of Gra- phene. The corresponding vial pictures are shown in Figure 1. As observed from the Figure 1, it is clear that in Gr1, the graphite molecules were settled down in the bottom part of the vial. Partial settle down was observed for Gr2. So, it can be concluded that 2 hrs sonication is not sufficient to get colloidal dispersion of Graphene. However for rest of the samples black colored colloidal solution was observed. As prepared colloids were homo- geneous and they remained stable for more than 6 months without any sediment. Stable uniform dispersion of Graphene can be achieved after 4 hrs sonication. Table 1. Sample details. Sample Codes Sonication Time (mins) Gr1 60 Gr2 120 Gr3 180 Gr4 240 Gr5 300 Figure 1. Vial images (before and after one month). 3. Characterization Techniques 3.1. Fourier Transform Infrared Spectroscopy (FTIR) FTIR analysis of Graphene samples was characterized using a NEXUS 870 FTIR (Thermo Nicolet). For the IR spectrum a small amount of material was mixed with KBr in adequate level to make a disk and the disk was analyzed for getting the spectrum. 3.2. Scanning Electron Microscopy (SEM) The surface morphologies of the samples were analyzed by using Tescan VEGA LSU SEM. 3.3. Transmission Electron Microscopy (TEM) All the samples were analyzed by TEM, JEOL 2100 in order to understand exact morphological change of Gra- phene dispersion in ODCB with sonication time. A small amount of the sample was dispersed in acetone and de- posited on copper grid. 3.4. Raman Spectra Raman spectra were recorded between 500 to 3500 cm−1 in a Raman Imaging System WITEC alpha 300 R with 532 nm wavelength. 3.5. Thermogravimetric Analysis (TGA) Thermogravimetric analysis curve was recorded with a Dupont 2100. Thermogravimetric analyzer. The TGA measurement was conducted with a heating rate of 10˚C/min under N2 atmosphere from room temperature to 800˚C. 4. Results and Discussion 4.1. FTIR Analysis The chemical environment of all Graphene samples has Copyright © 2013 SciRes. Graphene  S. SAHOO ET AL. 44 been analyzed by FTIR and spectrums of are shown in Figure 2. All the characteristic peaks of graphite are present in all the samples. The peak at 1634 cm−1 arises due to the C=O stretching vibration of carbonyl func- tional group. Broad peak at 3434 cm−1 corresponds to the O-H stretching vibration. Further, peaks at 2854 and 2924 cm−1 attributes to the symmetric and asymmetric stretching vibrations of C-H bonds respectively. Addi- tionally, several peaks arises in the range of 400 - 800 cm−1 due to several vibration modes of C-H like outer bending vibration, C-H in plane bending, C-H out of plane wagging [19,20]. However, there are no drastic changes in the spectrums of the prepared samples. These indicate the absence of any functional group in as pre- pared samples. 4.2. Morphological Study The morphological changes upon sonication for different time interval are analyzed by SEM and TEM analysis and the images are presented in Figures 3 and 4. Figure 3 shows the SEM image of graphite fine powder which clearly demonstrated the stacked Graphene sheet struc- ture. Sonication for 1 hr, exfoliated the Graphene sheets and the intergalary distance increased tremendously (Gr1). Further increase in the sonication time (2 hrs), resulted in the delamination of the Graphene sheets (Gr2). Sonica- tion for 3 hrs showed reduction in the Graphene layers, as compared to two hour sonication (Gr3). However, 4 hour sonication showed complete delamination of Gra- phene layers (Gr4). Increase in sonication time to 5 hrs (Gr5) showed restacking of the Graphene sheets. The delamination process was further confirmed by TEM. The characteristic TEM images of as prepared samples are shown in the Figure 4. In Gr1 graphite particles are present in agglomerated form. On the other hand, in Gr2, some portions of the graphite particles are remained in agglomerated form as well as in some portion, Gra- Figure 2. FTIR spectra of Gr1, Gr2, Gr3, Gr4, Gr5. phene nanosheets are formed. However, homogeneous dispersion of Graphene nanosheets is observed only for Gr4. The TEM image of Gr4 shows the multilayered Graphene nanosheets and the thicknesses of the Gra- phene nanosheets are 10 - 15 nm. This indicates that a particular sonication time is required for the exfoliation of Graphene in ODCB. 4 hrs sonication is sufficient for the homogeneous dispersion of Graphene. Further soni- cation leads to the agglomeration of graphite. Based on the morphological study and other relevant characterizations, we have demonstrated a diagram (Fig- ure 5) for better understanding of the changes during sonication for different time interval. As shown in the diagram, 1 hr sonication has not able to separate the graphite particles. 2 hrs sonication can only separate some portion of the graphite particles. However, better exfoliation of Graphene sheets is observed for Gr4. Fur- ther re stacking of Graphene sheets is found for Gr5. The characteristic SAED (Selected Area Electron Dif- fraction) images of the samples are shown in Figure 6. For Gr1, no ring patterns are observed, which is due to the amorphous nature of graphite. A perfect six mem- bered ring pattern is observed for Gr4 among all the samples. This is due to the crystalline nature of Graphene. These results indicate the formation of Graphene sheets in Gr4. 4.3. Raman Spectra Raman spectroscopy is mainly used to understand the structural properties of Graphene materials. It is also an important tool for identification of disorder and defect in molecular structure as well as to calculate defect density, doping level etc. The major Raman features of the Gra- phene samples are so called G band (~1575 cm−1) and D band (~1350 cm−1). However G band initiates from in- plane vibration of sp2 carbon atoms of Graphene samples [21], whereas the D mode arising from a breathing mode of a K-point photons of A1g symmetry [22]. Besides these two, one additional peak arises from a two phonon dou- ble resonance Raman process, known as 2D band (~2670 cm−1). The Raman spectra of all the samples and Graph- ite (inset) are shown in Figure 7. Among all the samples, Gr4 shows G band at 1353 cm−1 and D band at 1584 cm−1, which are comparable with the characteristic peaks of Graphene. The peak intensity ratio (ID/IG) is found to be 0.015 for Gr4 (Figure 8). Similar value was reported by W. Yang et al. [13]. However, the peak intensity ratio decreases from Gr1 to Gr4 and then increases for Gr5. The decrease in D band intensity with increasing sonica- tion time indicates that sonication induces defect-free Graphene sheets. It is also found that among all the sam- ples, Gr4 shows lowest D band intensity, after that D band intensity increases with further sonication. This proves that sonication for a particular time interval Copyright © 2013 SciRes. Graphene  S. SAHOO ET AL. Copyright © 2013 SciRes. Graphene 45 Figure 3. SEM images of Graphite, Gr1, Gr2, Gr3, Gr4, Gr5. Figure 4. TEM images of Gr1, Gr2, Gr3, Gr4, Gr5. 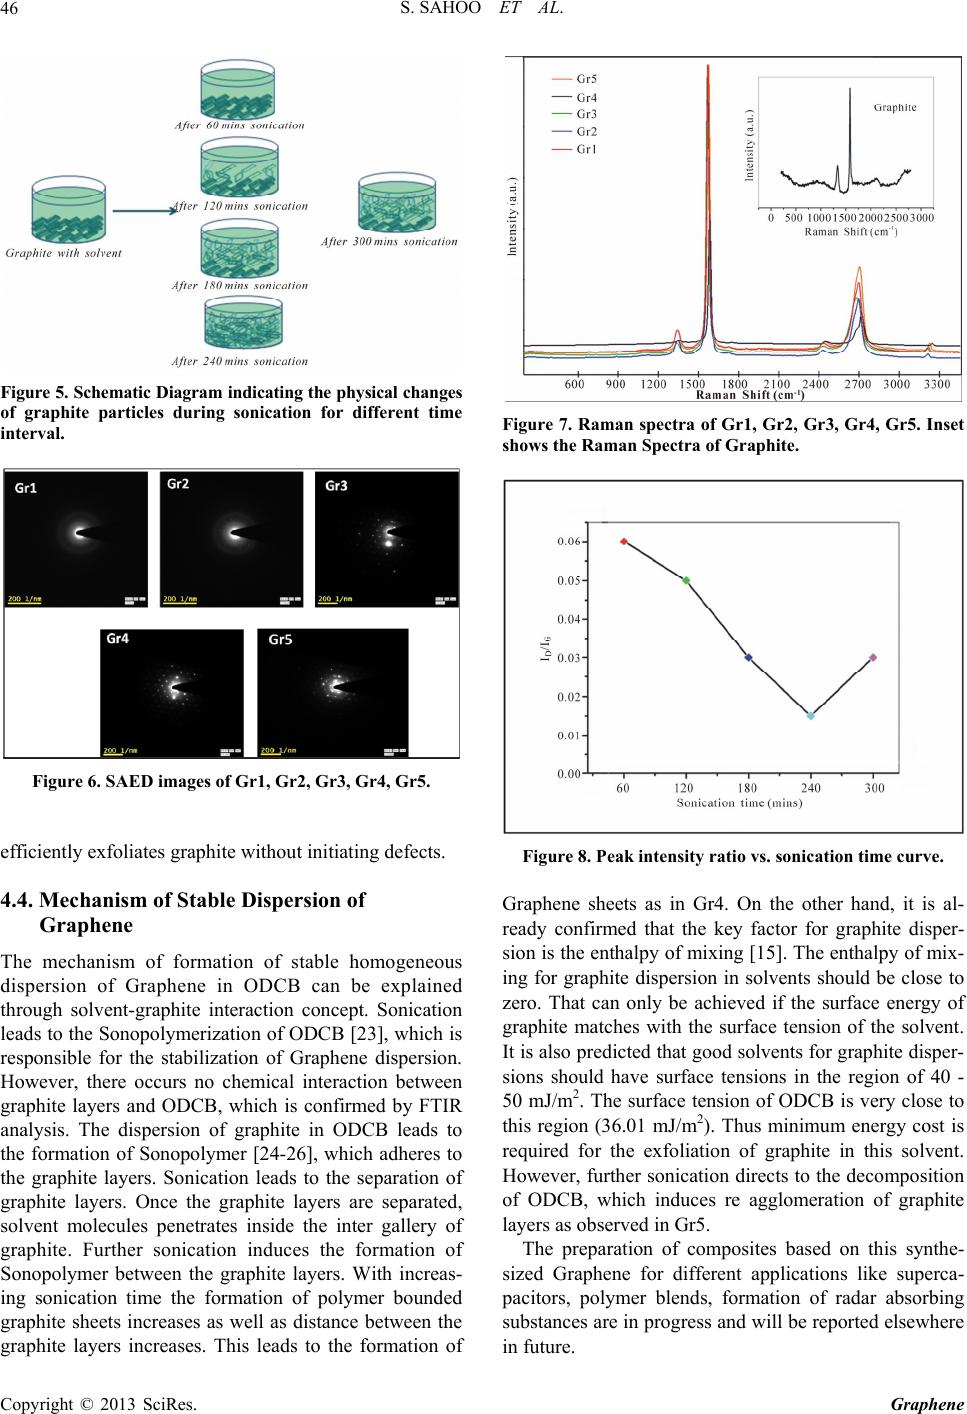 S. SAHOO ET AL. 46 Figure 5. Schematic Diagram indicating the physical changes of graphite particles during sonication for different time interval. Figure 6. SAED images of Gr1, Gr2, Gr3, Gr4, Gr5. efficiently exfoliates graphite without initiating defects. 4.4. Mechanism of Stable Dispersion of Graphene The mechanism of formation of stable homogeneous dispersion of Graphene in ODCB can be explained through solvent-graphite interaction concept. Sonication leads to the Sonopolymerization of ODCB [23], which is responsible for the stabilization of Graphene dispersion. However, there occurs no chemical interaction between graphite layers and ODCB, which is confirmed by FTIR analysis. The dispersion of graphite in ODCB leads to the formation of Sonopolymer [24-26], which adheres to the graphite layers. Sonication leads to the separation of graphite layers. Once the graphite layers are separated, solvent molecules penetrates inside the inter gallery of graphite. Further sonication induces the formation of Sonopolymer between the graphite layers. With increas- ing sonication time the formation of polymer bounded graphite sheets increases as well as distance between the graphite layers increases. This leads to the formation of Figure 7. Raman spectra of Gr1, Gr2, Gr3, Gr4, Gr5. Inset shows the Raman Spectr a of Gr aphite. Figure 8. Peak intensity ratio vs. sonication time curve. Graphene sheets as in Gr4. On the other hand, it is al- ready confirmed that the key factor for graphite disper- sion is the enthalpy of mixing [15]. The enthalpy of mix- ing for graphite dispersion in solvents should be close to zero. That can only be achieved if the surface energy of graphite matches with the surface tension of the solvent. It is also predicted that good solvents for graphite disper- sions should have surface tensions in the region of 40 - 50 mJ/m2. The surface tension of ODCB is very close to this region (36.01 mJ/m2). Thus minimum energy cost is required for the exfoliation of graphite in this solvent. However, further sonication directs to the decomposition of ODCB, which induces re agglomeration of graphite layers as observed in Gr5. The preparation of composites based on this synthe- sized Graphene for different applications like superca- pacitors, polymer blends, formation of radar absorbing substances are in progress and will be reported elsewhere in future. Copyright © 2013 SciRes. Graphene 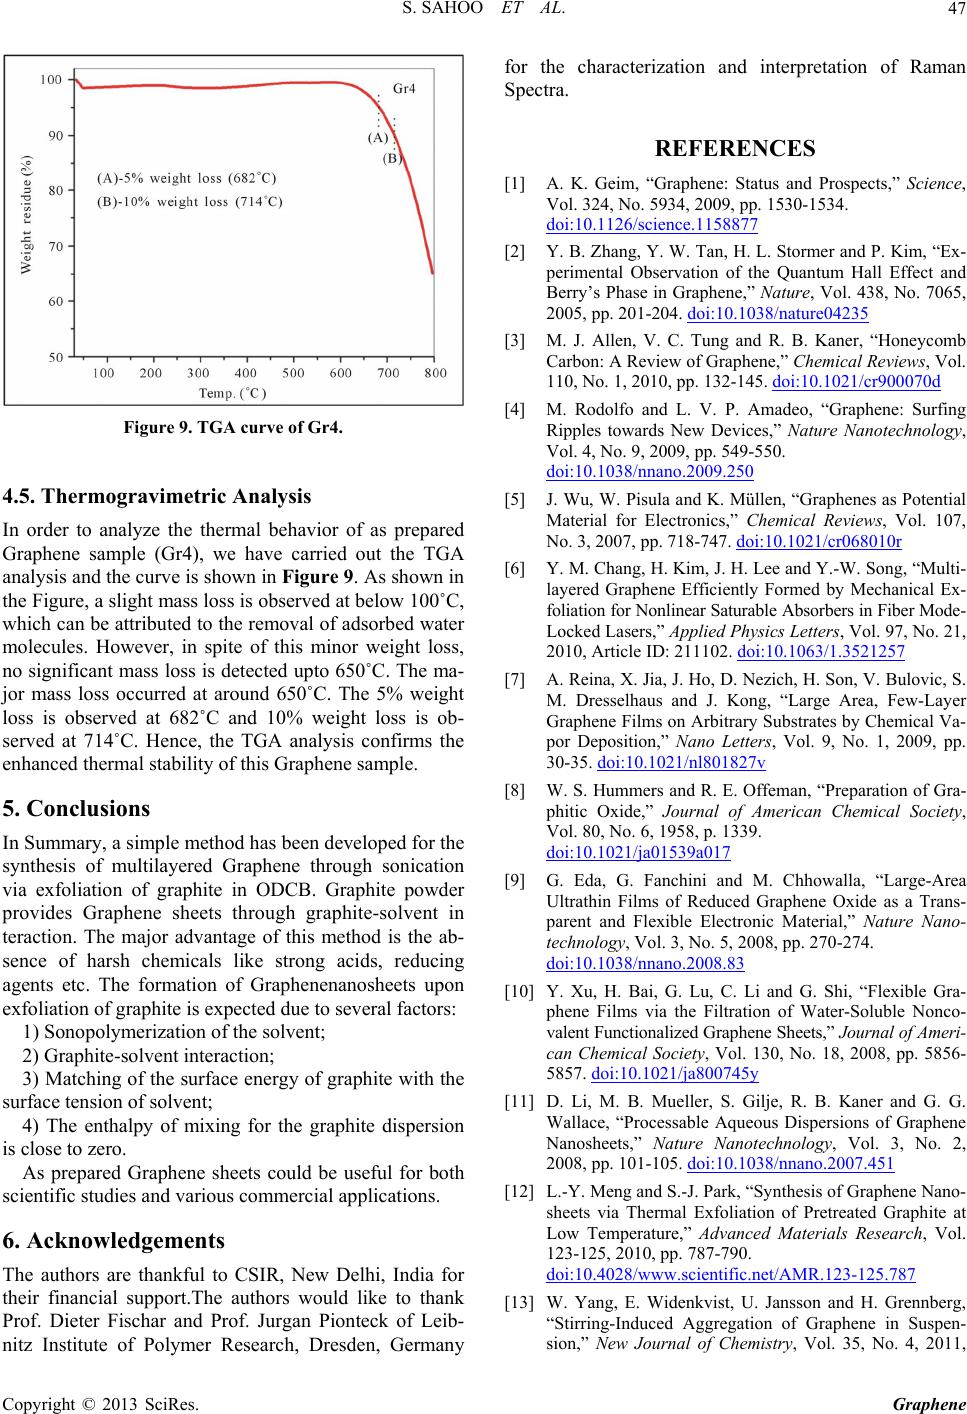 S. SAHOO ET AL. 47 Figure 9. TGA curve of Gr4. 4.5. Thermogravimetric Analysis In order to analyze the thermal behavior of as prepared Graphene sample (Gr4), we have carried out the TGA analysis and the curve is shown in Figure 9. As shown in the Figure, a slight mass loss is observed at below 100˚C, which can be attributed to the removal of adsorbed water molecules. However, in spite of this minor weight loss, no significant mass loss is detected upto 650˚C. The ma- jor mass loss occurred at around 650˚C. The 5% weight loss is observed at 682˚C and 10% weight loss is ob- served at 714˚C. Hence, the TGA analysis confirms the enhanced thermal stability of this Graphene sample. 5. Conclusions In Summary, a simple method has been developed for the synthesis of multilayered Graphene through sonication via exfoliation of graphite in ODCB. Graphite powder provides Graphene sheets through graphite-solvent in teraction. The major advantage of this method is the ab- sence of harsh chemicals like strong acids, reducing agents etc. The formation of Graphenenanosheets upon exfoliation of graphite is expected due to several factors: 1) Sonopolymerization of the solvent; 2) Graphite-solvent interaction; 3) Matching of the surface energy of graphite with the surface tension of solvent; 4) The enthalpy of mixing for the graphite dispersion is close to zero. As prepared Graphene sheets could be useful for both scientific studies and various commercial applications. 6. Acknowledgements The authors are thankful to CSIR, New Delhi, India for their financial support.The authors would like to thank Prof. Dieter Fischar and Prof. Jurgan Pionteck of Leib- nitz Institute of Polymer Research, Dresden, Germany for the characterization and interpretation of Raman Spectra. REFERENCES [1] A. K. Geim, “Graphene: Status and Prospects,” Science, Vol. 324, No. 5934, 2009, pp. 1530-1534. doi:10.1126/science.1158877 [2] Y. B. Zhang, Y. W. Tan, H. L. Stormer and P. Kim, “Ex- perimental Observation of the Quantum Hall Effect and Berry’s Phase in Graphene,” Nature, Vol. 438, No. 7065, 2005, pp. 201-204. doi:10.1038/nature04235 [3] M. J. Allen, V. C. Tung and R. B. Kaner, “Honeycomb Carbon: A Review of Graphene,” Chemical Reviews, Vol. 110, No. 1, 2010, pp. 132-145. doi:10.1021/cr900070d [4] M. Rodolfo and L. V. P. Amadeo, “Graphene: Surfing Ripples towards New Devices,” Nature Nanotechnology, Vol. 4, No. 9, 2009, pp. 549-550. doi:10.1038/nnano.2009.250 [5] J. Wu, W. Pisula and K. Müllen, “Graphenes as Potential Material for Electronics,” Chemical Reviews, Vol. 107, No. 3, 2007, pp. 718-747. doi:10.1021/cr068010r [6] Y. M. Chang, H. Kim, J. H. Lee and Y.-W. Song, “Multi- layered Graphene Efficiently Formed by Mechanical Ex- foliation for Nonlinear Saturable Absorbers in Fiber Mode- Locked Lasers,” Applied Physics Letters, Vol. 97, No. 21, 2010, Article ID: 211102. doi:10.1063/1.3521257 [7] A. Reina, X. Jia, J. Ho, D. Nezich, H. Son, V. Bulovic, S. M. Dresselhaus and J. Kong, “Large Area, Few-Layer Graphene Films on Arbitrary Substrates by Chemical Va- por Deposition,” Nano Letters, Vol. 9, No. 1, 2009, pp. 30-35. doi:10.1021/nl801827v [8] W. S. Hummers and R. E. Offeman, “Preparation of Gra- phitic Oxide,” Journal of American Chemical Society, Vol. 80, No. 6, 1958, p. 1339. doi:10.1021/ja01539a017 [9] G. Eda, G. Fanchini and M. Chhowalla, “Large-Area Ultrathin Films of Reduced Graphene Oxide as a Trans- parent and Flexible Electronic Material,” Nature Nano- technology, Vol. 3, No. 5, 2008, pp. 270-274. doi:10.1038/nnano.2008.83 [10] Y. Xu, H. Bai, G. Lu, C. Li and G. Shi, “Flexible Gra- phene Films via the Filtration of Water-Soluble Nonco- valent Functionalized Graphene Sheets,” Journal of Ameri- can Chemical Society, Vol. 130, No. 18, 2008, pp. 5856- 5857. doi:10.1021/ja800745y [11] D. Li, M. B. Mueller, S. Gilje, R. B. Kaner and G. G. Wallace, “Processable Aqueous Dispersions of Graphene Nanosheets,” Nature Nanotechnology, Vol. 3, No. 2, 2008, pp. 101-105. doi:10.1038/nnano.2007.451 [12] L.-Y. Meng and S.-J. Park, “Synthesis of Graphene Nano- sheets via Thermal Exfoliation of Pretreated Graphite at Low Temperature,” Advanced Materials Research, Vol. 123-125, 2010, pp. 787-790. doi:10.4028/www.scientific.net/AMR.123-125.787 [13] W. Yang, E. Widenkvist, U. Jansson and H. Grennberg, “Stirring-Induced Aggregation of Graphene in Suspen- sion,” New Journal of Chemistry, Vol. 35, No. 4, 2011, Copyright © 2013 SciRes. Graphene 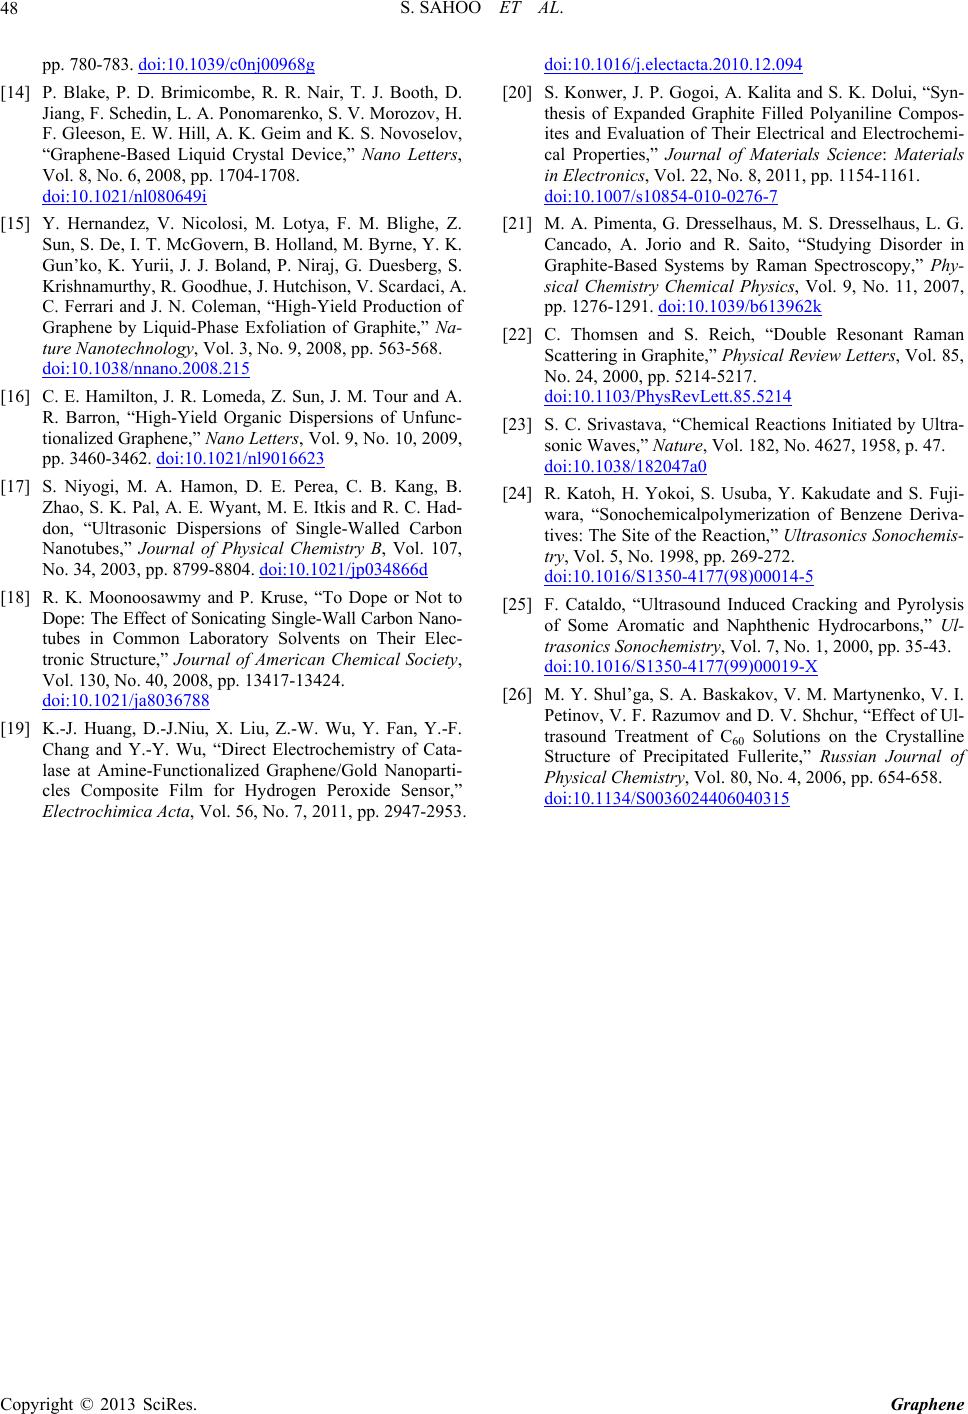 S. SAHOO ET AL. Copyright © 2013 SciRes. Graphene 48 pp. 780-783. doi:10.1039/c0nj00968g [14] P. Blake, P. D. Brimicombe, R. R. Nair, T. J. Booth, D. Jiang, F. Schedin, L. A. Ponomarenko, S. V. Morozov, H. F. Gleeson, E. W. Hill, A. K. Geim and K. S. Novoselov, “Graphene-Based Liquid Crystal Device,” Nano Letters, Vol. 8, No. 6, 2008, pp. 1704-1708. doi:10.1021/nl080649i [15] Y. Hernandez, V. Nicolosi, M. Lotya, F. M. Blighe, Z. Sun, S. De, I. T. McGovern, B. Holland, M. Byrne, Y. K. Gun’ko, K. Yurii, J. J. Boland, P. Niraj, G. Duesberg, S. Krishnamurthy, R. Goodhue, J. Hutchison, V. Scardaci, A. C. Ferrari and J. N. Coleman, “High-Yield Production of Graphene by Liquid-Phase Exfoliation of Graphite,” Na- ture Nanotechnology, Vol. 3, No. 9, 2008, pp. 563-568. doi:10.1038/nnano.2008.215 [16] C. E. Hamilton, J. R. Lomeda, Z. Sun, J. M. Tour and A. R. Barron, “High-Yield Organic Dispersions of Unfunc- tionalized Graphene,” Nano Letters, Vol. 9, No. 10, 2009, pp. 3460-3462. doi:10.1021/nl9016623 [17] S. Niyogi, M. A. Hamon, D. E. Perea, C. B. Kang, B. Zhao, S. K. Pal, A. E. Wyant, M. E. Itkis and R. C. Had- don, “Ultrasonic Dispersions of Single-Walled Carbon Nanotubes,” Journal of Physical Chemistry B, Vol. 107, No. 34, 2003, pp. 8799-8804. doi:10.1021/jp034866d [18] R. K. Moonoosawmy and P. Kruse, “To Dope or Not to Dope: The Effect of Sonicating Single-Wall Carbon Nano- tubes in Common Laboratory Solvents on Their Elec- tronic Structure,” Journal of American Chemical Society, Vol. 130, No. 40, 2008, pp. 13417-13424. doi:10.1021/ja8036788 [19] K.-J. Huang, D.-J.Niu, X. Liu, Z.-W. Wu, Y. Fan, Y.-F. Chang and Y.-Y. Wu, “Direct Electrochemistry of Cata- lase at Amine-Functionalized Graphene/Gold Nanoparti- cles Composite Film for Hydrogen Peroxide Sensor,” Electrochimica Acta, Vol. 56, No. 7, 2011, pp. 2947-2953. doi:10.1016/j.electacta.2010.12.094 [20] S. Konwer, J. P. Gogoi, A. Kalita and S. K. Dolui, “Syn- thesis of Expanded Graphite Filled Polyaniline Compos- ites and Evaluation of Their Electrical and Electrochemi- cal Properties,” Journal of Materials Science: Materials in Electronics, Vol. 22, No. 8, 2011, pp. 1154-1161. doi:10.1007/s10854-010-0276-7 [21] M. A. Pimenta, G. Dresselhaus, M. S. Dresselhaus, L. G. Cancado, A. Jorio and R. Saito, “Studying Disorder in Graphite-Based Systems by Raman Spectroscopy,” Phy- sical Chemistry Chemical Physics, Vol. 9, No. 11, 2007, pp. 1276-1291. doi:10.1039/b613962k [22] C. Thomsen and S. Reich, “Double Resonant Raman Scattering in Graphite,” Physical Review Letters, Vol. 85, No. 24, 2000, pp. 5214-5217. doi:10.1103/PhysRevLett.85.5214 [23] S. C. Srivastava, “Chemical Reactions Initiated by Ultra- sonic Waves,” Nature, Vol. 182, No. 4627, 1958, p. 47. doi:10.1038/182047a0 [24] R. Katoh, H. Yokoi, S. Usuba, Y. Kakudate and S. Fuji- wara, “Sonochemicalpolymerization of Benzene Deriva- tives: The Site of the Reaction,” Ultrasonics Sonochemis- try, Vol. 5, No. 1998, pp. 269-272. doi:10.1016/S1350-4177(98)00014-5 [25] F. Cataldo, “Ultrasound Induced Cracking and Pyrolysis of Some Aromatic and Naphthenic Hydrocarbons,” Ul- trasonics Sonochemistry, Vol. 7, No. 1, 2000, pp. 35-43. doi:10.1016/S1350-4177(99)00019-X [26] M. Y. Shul’ga, S. A. Baskakov, V. M. Martynenko, V. I. Petinov, V. F. Razumov and D. V. Shchur, “Effect of Ul- trasound Treatment of C60 Solutions on the Crystalline Structure of Precipitated Fullerite,” Russian Journal of Physical Chemistry, Vol. 80, No. 4, 2006, pp. 654-658. doi:10.1134/S0036024406040315
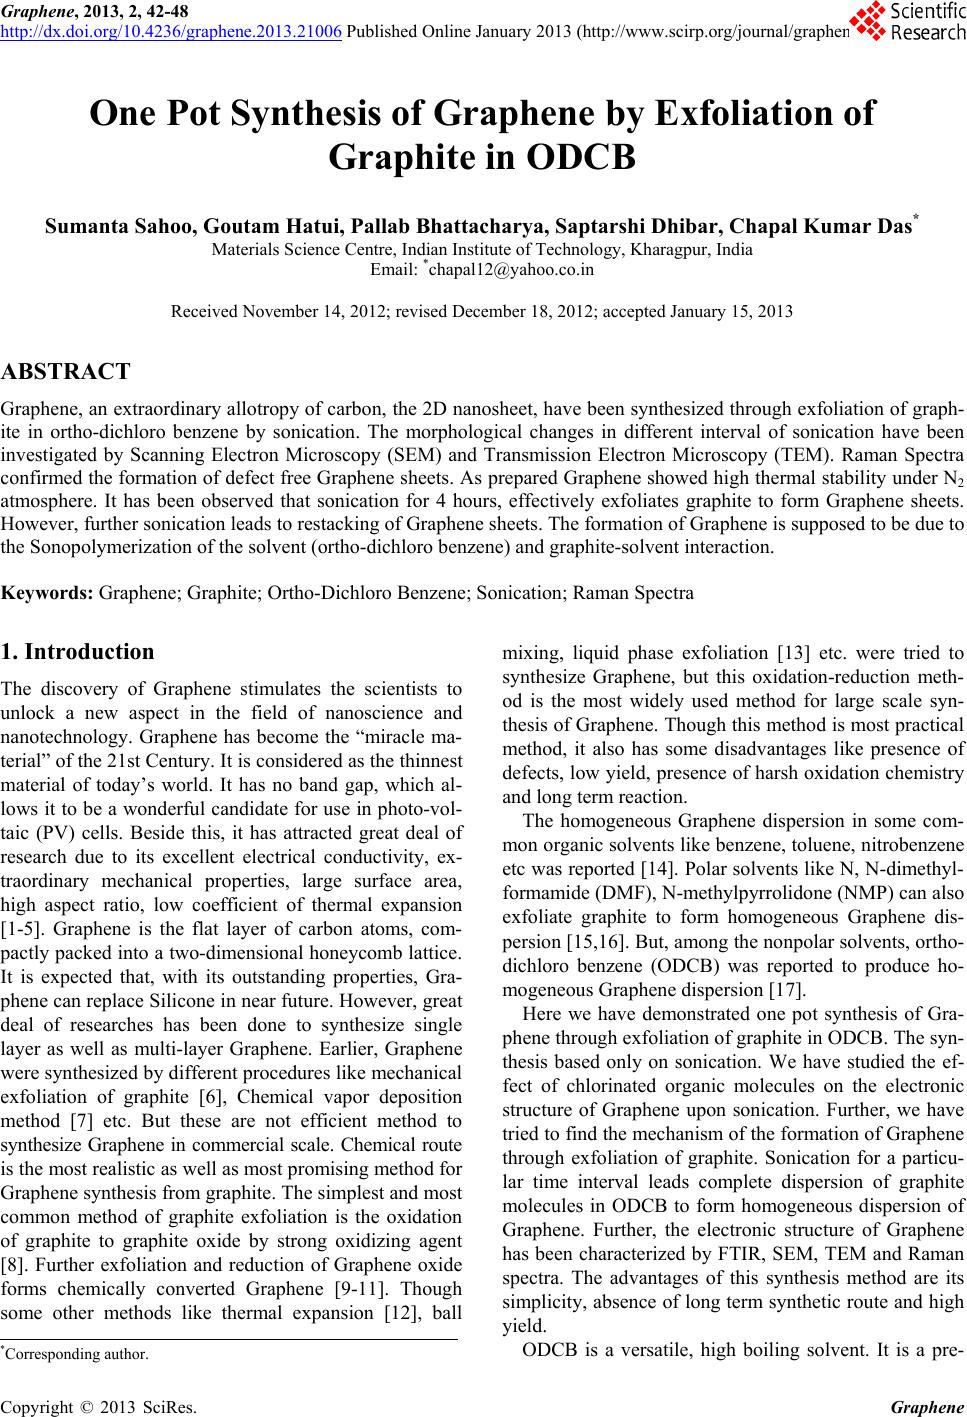
|