J. J. VÁZQUEZ ET AL.
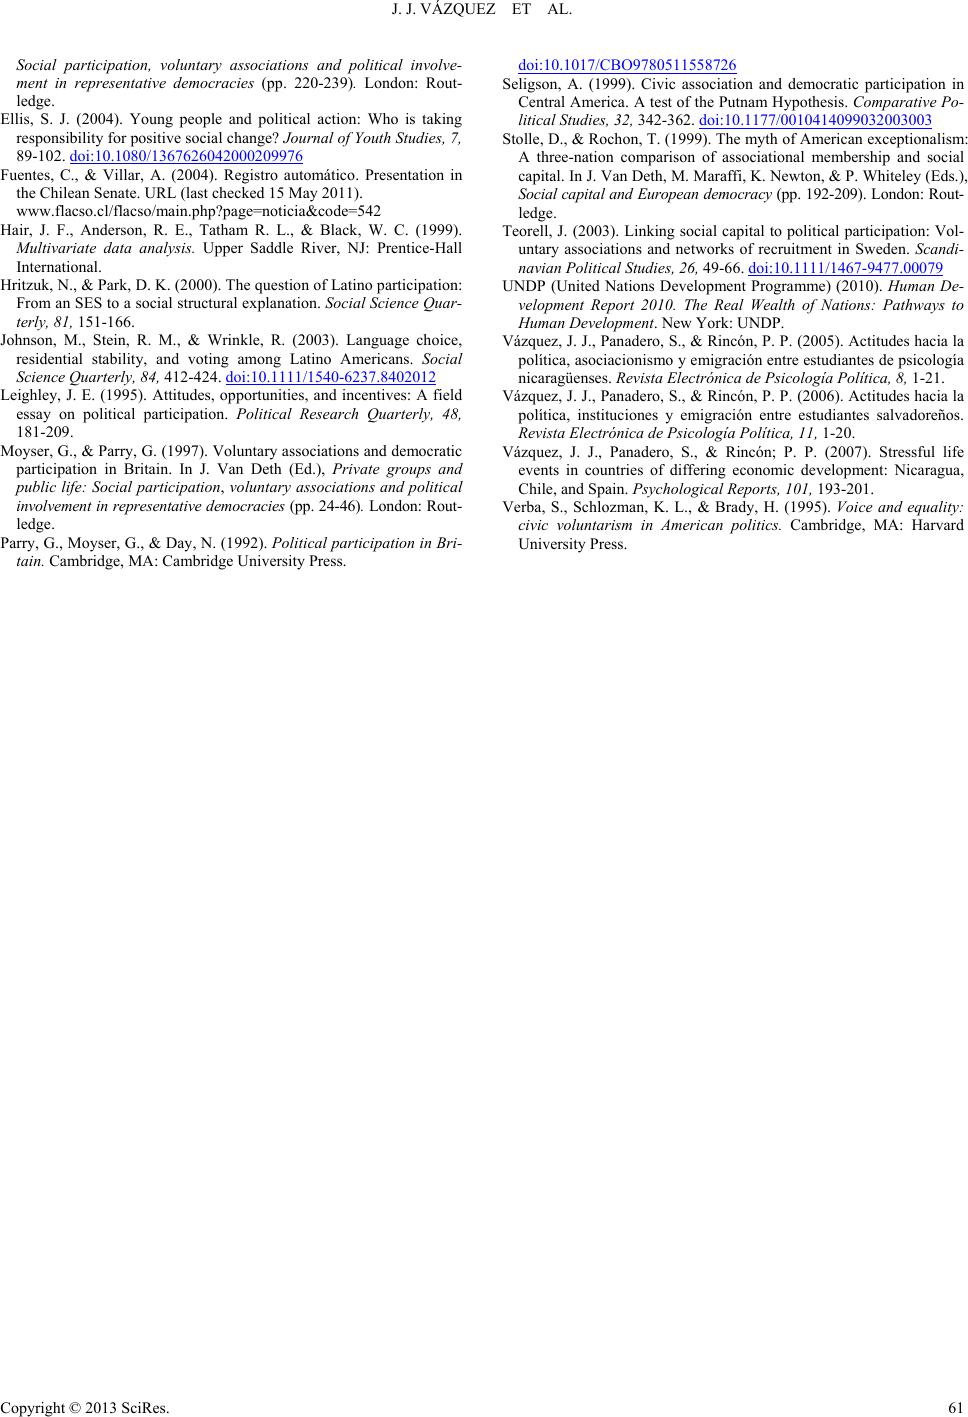
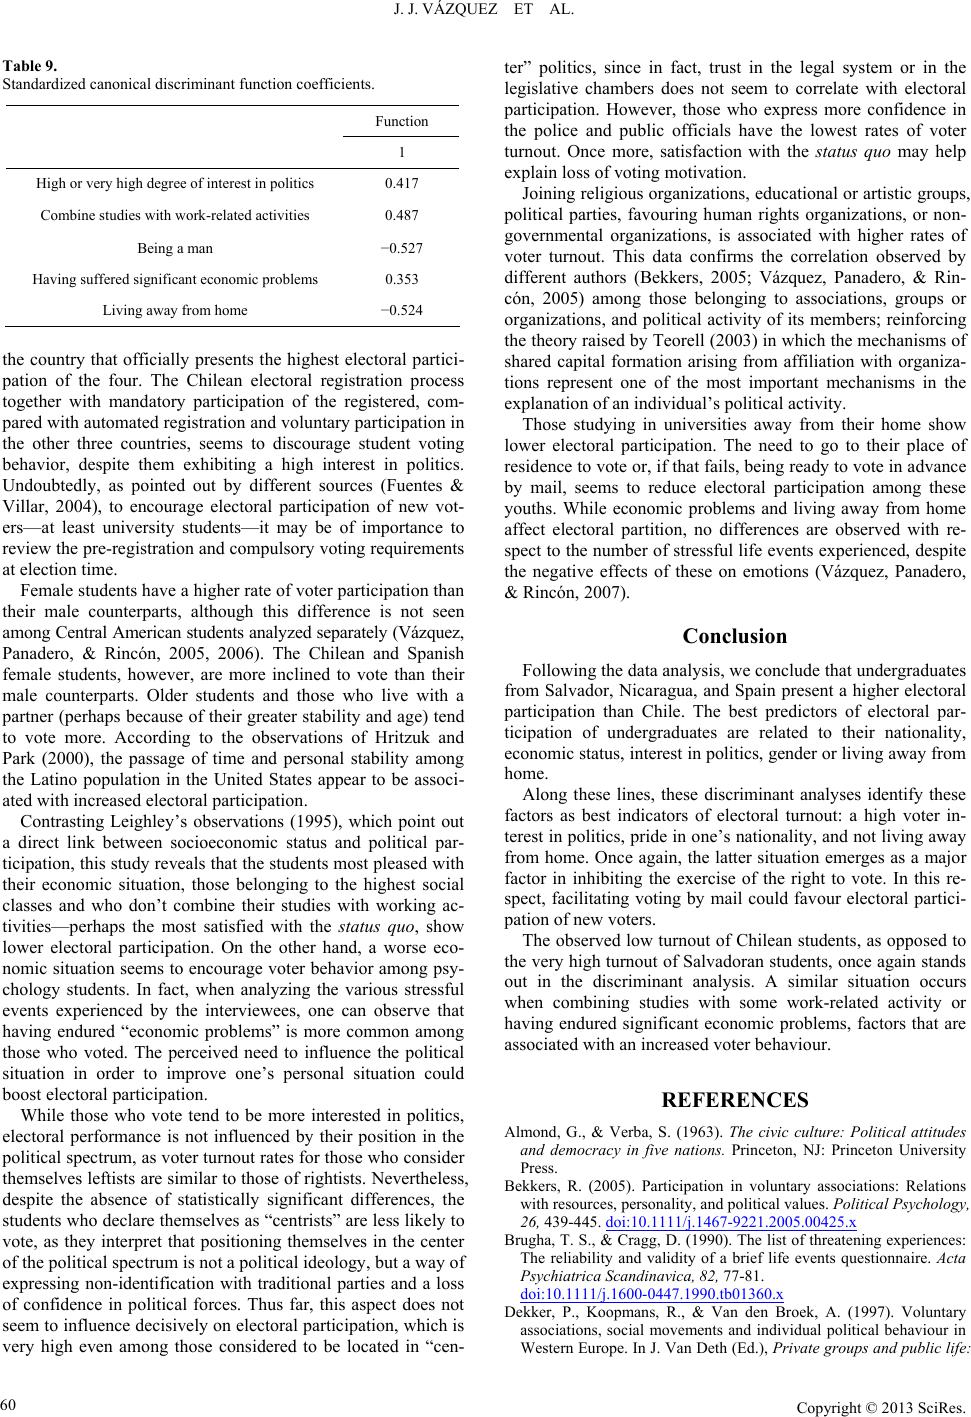
Table 9.
Standardized canonical discriminant function coefficients.
Function
1
High or very high degree of interest in politics 0.417
Combine studies with work-related activities 0.487
Being a man −0.527
Having suffered significant economic problems 0.353
Living away from home −0.524
the country that officially presents the highest electoral partici-
pation of the four. The Chilean electoral registration process
together with mandatory participation of the registered, com-
pared with automated registration and voluntary participation in
the other three countries, seems to discourage student voting
behavior, despite them exhibiting a high interest in politics.
Undoubtedly, as pointed out by different sources (Fuentes &
Villar, 2004), to encourage electoral participation of new vot-
ers—at least university students—it may be of importance to
review the pre-registration and compulsory voting requirements
at election time.
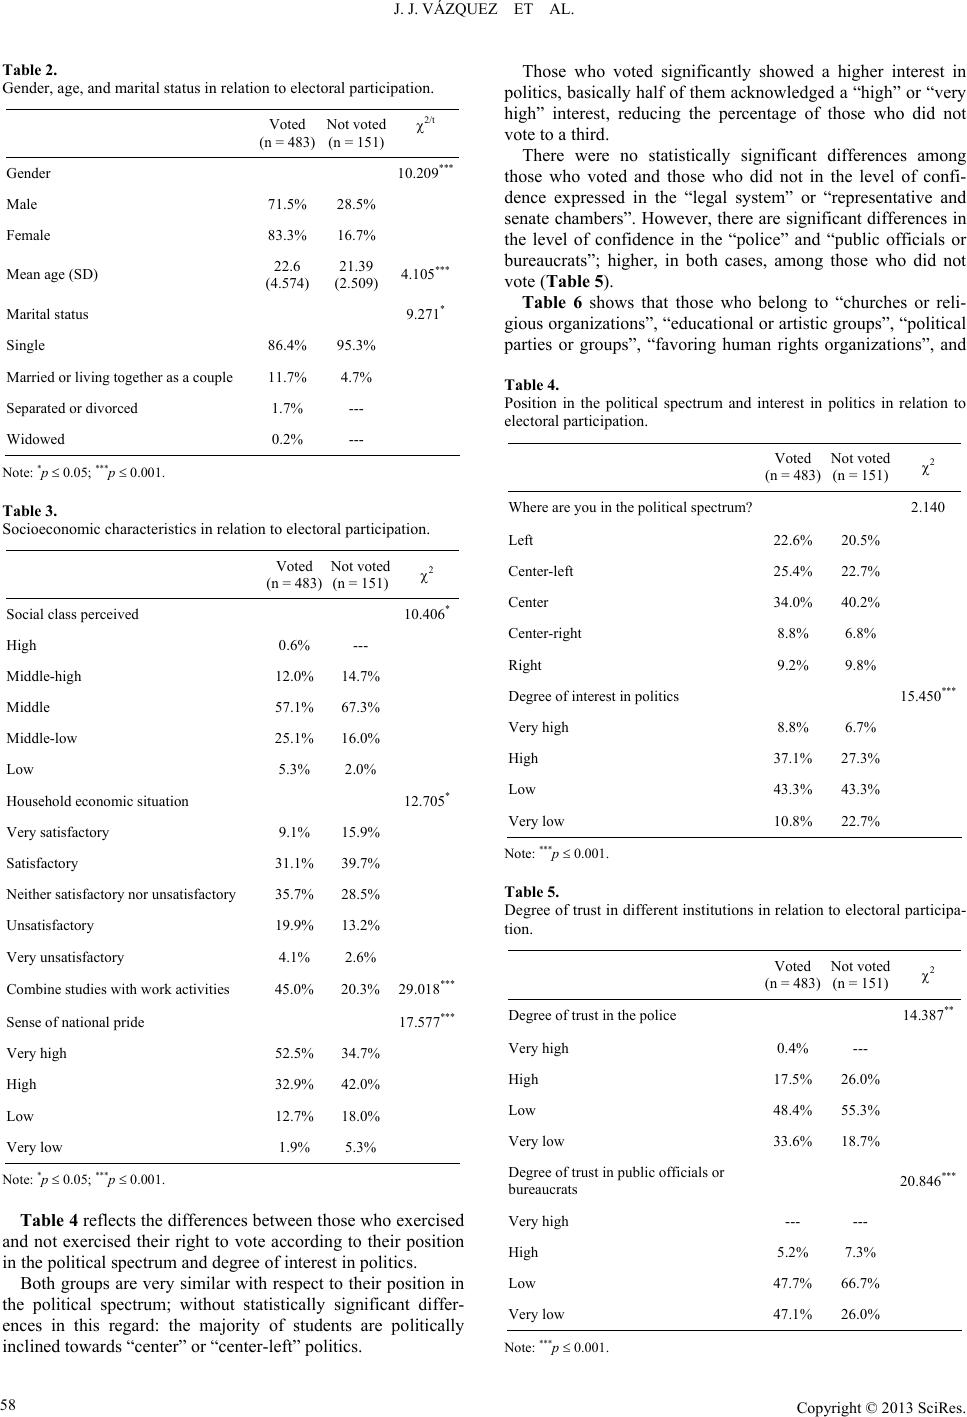
Female students have a higher rate of voter participation than
their male counterparts, although this difference is not seen
among Central American students analyzed separately (Vázquez,
Panadero, & Rincón, 2005, 2006). The Chilean and Spanish
female students, however, are more inclined to vote than their
male counterparts. Older students and those who live with a
partner (perhaps because of their greater stability and age) tend
to vote more. According to the observations of Hritzuk and
Park (2000), the passage of time and personal stability among
the Latino population in the United States appear to be associ-
ated with increased electoral participation.
Contrasting Leighley’s observations (1995), which point out
a direct link between socioeconomic status and political par-
ticipation, this study reveals that the students most pleased with
their economic situation, those belonging to the highest social
classes and who don’t combine their studies with working ac-
tivities—perhaps the most satisfied with the status quo, show
lower electoral participation. On the other hand, a worse eco-
nomic situation seems to encourage voter behavior among psy-
chology students. In fact, when analyzing the various stressful
events experienced by the interviewees, one can observe that
having endured “economic problems” is more common among
those who voted. The perceived need to influence the political
situation in order to improve one’s personal situation could
boost electoral participation.
While those who vote tend to be more interested in politics,
electoral performance is not influenced by their position in the
political spectrum, as voter turnout rates for those who consider
themselves leftists are similar to those of rightists. Nevertheless,
despite the absence of statistically significant differences, the
students who declare themselves as “centrists” are less likely to
vote, as they interpret that positioning themselves in the center
of the political spectrum is not a political ideology, but a way of
expressing non-identification with traditional parties and a loss
of confidence in political forces. Thus far, this aspect does not
seem to influence decisively on electoral participation, which is
very high even among those considered to be located in “cen-
ter” politics, since in fact, trust in the legal system or in the
legislative chambers does not seem to correlate with electoral
participation. However, those who express more confidence in
the police and public officials have the lowest rates of voter
turnout. Once more, satisfaction with the status quo may help
explain loss of voting motivation.
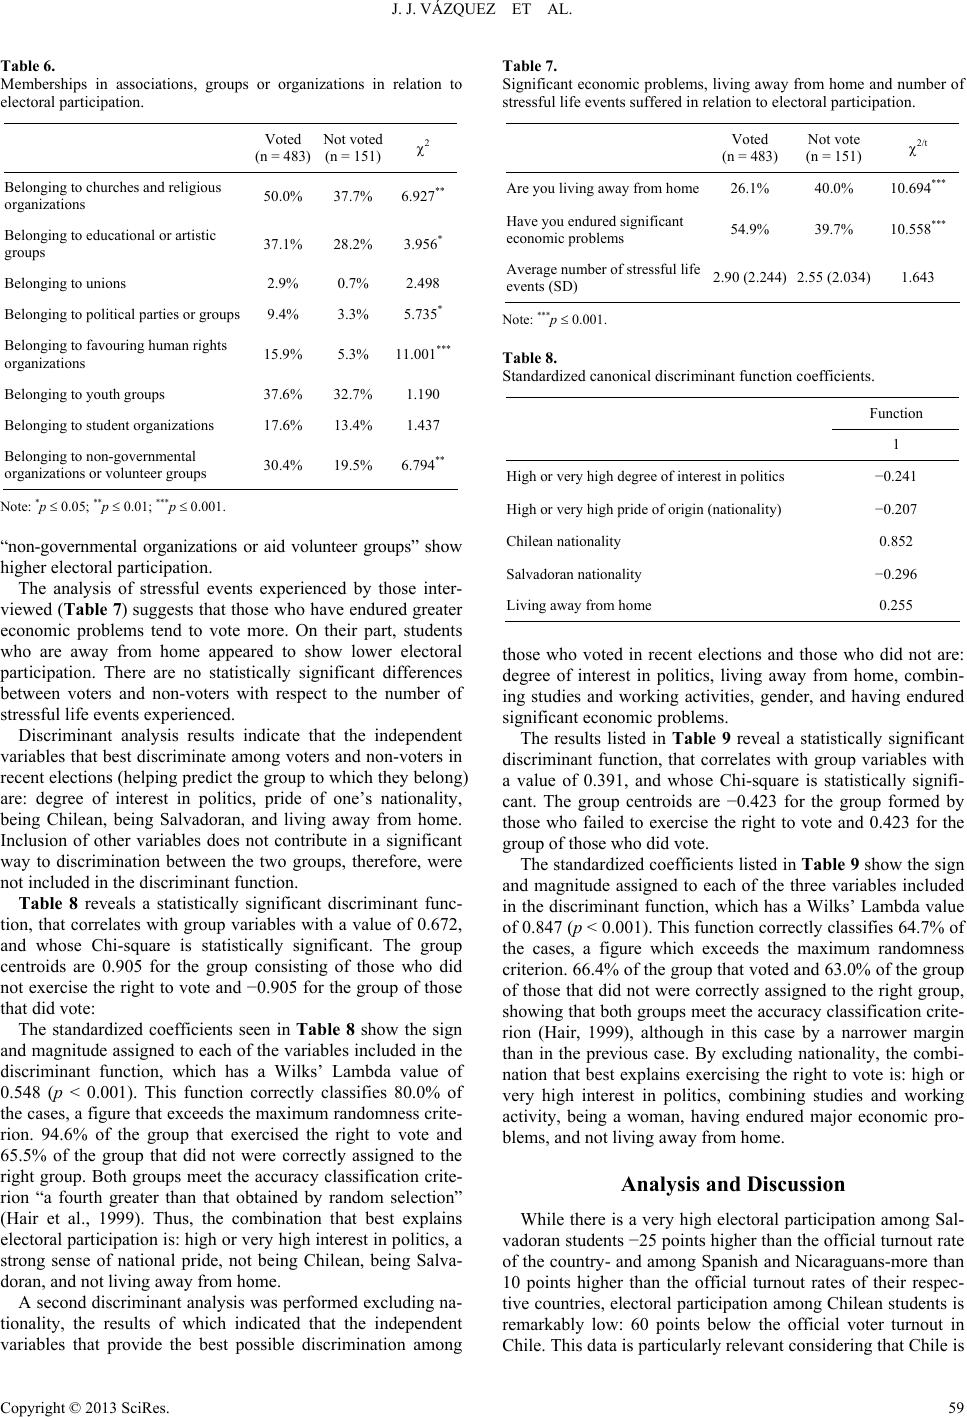
Joining religious organizations, educational or artistic groups,
political parties, favouring human rights organizations, or non-
governmental organizations, is associated with higher rates of
voter turnout. This data confirms the correlation observed by
different authors (Bekkers, 2005; Vázquez, Panadero, & Rin-
cón, 2005) among those belonging to associations, groups or
organizations, and political activity of its members; reinforcing
the theory raised by Teorell (2003) in which the mechanisms of
shared capital formation arising from affiliation with organiza-
tions represent one of the most important mechanisms in the
explanation of an individual’s political activity.
Those studying in universities away from their home show
lower electoral participation. The need to go to their place of
residence to vote or, if that fails, being ready to vote in advance
by mail, seems to reduce electoral participation among these
youths. While economic problems and living away from home
affect electoral partition, no differences are observed with re-
spect to the number of stressful life events experienced, despite
the negative effects of these on emotions (Vázquez, Panadero,
& Rincón, 2007).
Conclusion
Following the data analysis, we conclude that undergraduates
from Salvador, Nicaragua, and Spain present a higher electoral
participation than Chile. The best predictors of electoral par-
ticipation of undergraduates are related to their nationality,
economic status, interest in politics, gender or living away from
home.
Along these lines, these discriminant analyses identify these
factors as best indicators of electoral turnout: a high voter in-
terest in politics, pride in one’s nationality, and not living away
from home. Once again, the latter situation emerges as a major
factor in inhibiting the exercise of the right to vote. In this re-
spect, facilitating voting by mail could favour electoral partici-
pation of new voters.
The observed low turnout of Chilean students, as opposed to
the very high turnout of Salvadoran students, once again stands
out in the discriminant analysis. A similar situation occurs
when combining studies with some work-related activity or
having endured significant economic problems, factors that are
associated with an increased voter behaviour.
REFERENCES
Almond, G., & Verba, S. (1963). The civic culture: Political attitudes
and democracy in five nations. Princeton, NJ: Princeton University
Press.
Bekkers, R. (2005). Participation in voluntary associations: Relations
with resources, personality, and political values. Political Psychology,
26, 439-445. doi:10.1111/j.1467-9221.2005.00425.x
Brugha, T. S., & Cragg, D. (1990). The list of threatening experiences:
The reliability and validity of a brief life events questionnaire. Acta
Psychiatrica Scandinavica, 82, 77-81.
doi:10.1111/j.1600-0447.1990.tb01360.x
Dekker, P., Koopmans, R., & Van den Broek, A. (1997). Voluntary
associations, social movements and individual political behaviour in
Western Europe. In J. Van Deth (Ed.), Private groups and public life:
Copyright © 2013 SciRes.
60