Paper Menu >>
Journal Menu >>
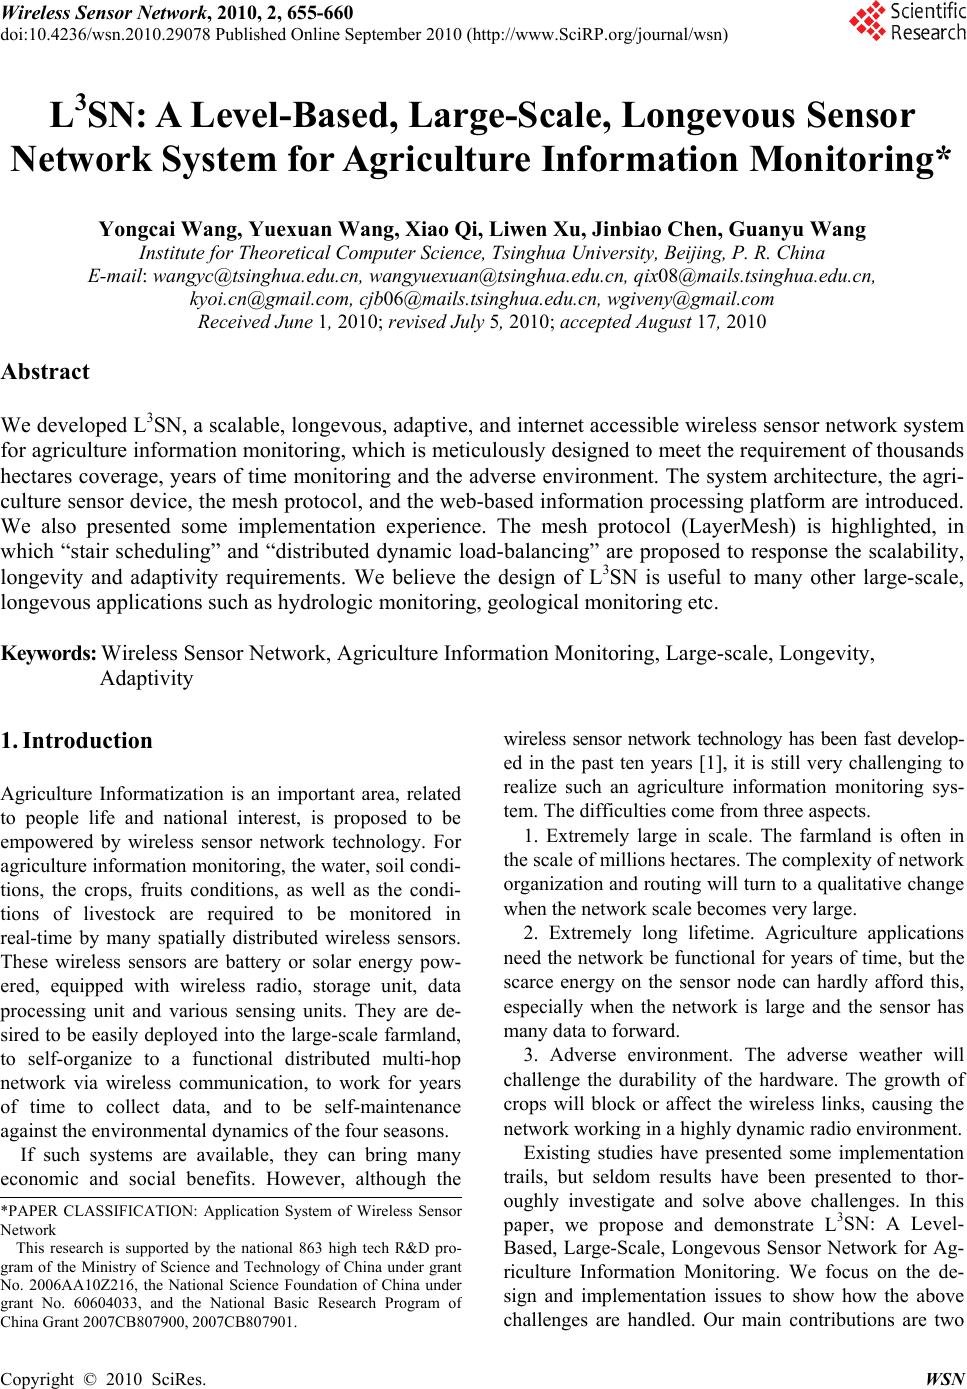 Wireless Sensor Network, 2010, 2, 655-660 doi:10.4236/wsn.2010.29078 Published Online September 2010 (http://www.SciRP.org/journal/wsn) Copyright © 2010 SciRes. WSN L3SN: A Level-Based, Large-Scale, Longevous Sensor Network System for Agriculture Information Monitoring* Yongcai Wang, Yuexuan Wang, Xiao Qi, Liwen Xu, Jinbiao Chen, Guanyu Wang Institute for Theoretical Computer Science, Tsinghua University, Beijing, P. R. China E-mail: wangyc@tsinghua.edu.cn, wangyuexuan@tsinghua.edu.cn, qix08@mails.tsinghua.edu.cn, kyoi.cn@gmail.com, cjb06@mails.tsinghua.edu.cn, wgiveny@gmail.com Received June 1, 2010; revised July 5, 2010; accepted August 17, 2010 Abstract We developed L3SN, a scalable, longevous, adaptive, and internet accessible wireless sensor network system for agriculture information monitoring, which is meticulously designed to meet the requirement of thousands hectares coverage, years of time monitoring and the adverse environment. The system architecture, the agri- culture sensor device, the mesh protocol, and the web-based information processing platform are introduced. We also presented some implementation experience. The mesh protocol (LayerMesh) is highlighted, in which “stair scheduling” and “distributed dynamic load-balancing” are proposed to response the scalability, longevity and adaptivity requirements. We believe the design of L3SN is useful to many other large-scale, longevous applications such as hydrologic monitoring, geological monitoring etc. Keywords: Wireless Sensor Network, Agriculture Information Monitoring, Large-scale, Longevity, Adaptivity 1. Introduction Agriculture Informatization is an important area, related to people life and national interest, is proposed to be empowered by wireless sensor network technology. For agriculture information monitoring, the water, soil condi- tions, the crops, fruits conditions, as well as the condi- tions of livestock are required to be monitored in real-time by many spatially distributed wireless sensors. These wireless sensors are battery or solar energy pow- ered, equipped with wireless radio, storage unit, data processing unit and various sensing units. They are de- sired to be easily deployed into the large-scale farmland, to self-organize to a functional distributed multi-hop network via wireless communication, to work for years of time to collect data, and to be self-maintenance against the environmental dynamics of the four seasons. If such systems are available, they can bring many economic and social benefits. However, although the wireless sensor network technology has been fast develop- ed in the past ten years [1], it is still very challenging to realize such an agriculture information monitoring sys- tem. The difficulties come from three aspects. 1. Extremely large in scale. The farmland is often in the scale of millions hectares. The complexity of network organization and routing will turn to a qualitative change when the network scale becomes very large. 2. Extremely long lifetime. Agriculture applications need the network be functional for years of time, but the scarce energy on the sensor node can hardly afford this, especially when the network is large and the sensor has many data to forward. 3. Adverse environment. The adverse weather will challenge the durability of the hardware. The growth of crops will block or affect the wireless links, causing the network working in a highly dynamic radio environment. Existing studies have presented some implementation trails, but seldom results have been presented to thor- oughly investigate and solve above challenges. In this paper, we propose and demonstrate L3SN: A Level- *PAPER CLASSIFICATION: Application System of Wireless Senso r N etwor k This research is supported by the national 863 high tech R&D pro- gram of the Ministry of Science and Technology of China under gran t N o. 2006AA10Z216, the National Science Foundation of China under grant No. 60604033, and the National Basic Research Program o f China Grant 2007CB807900, 2007CB807901. Based, Large-Scale, Longevous Sensor Network for Ag- riculture Information Monitoring. We focus on the de- sign and implementation issues to show how the above challenges are handled. Our main contributions are two 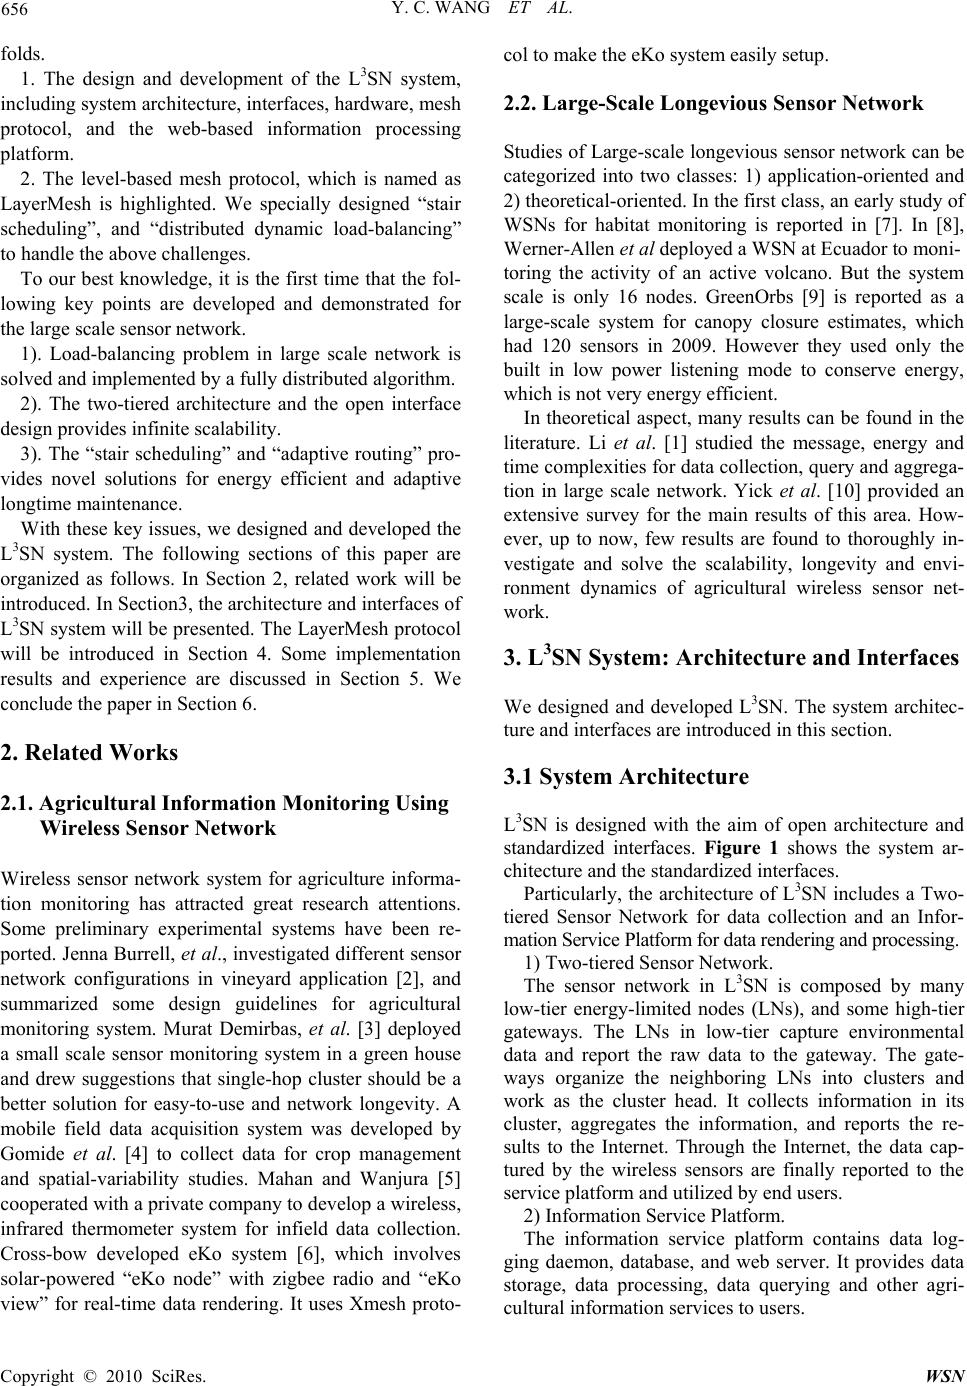 656 Y. C. WANG ET AL. folds. 1. The design and development of the L3SN system, including system architecture, interfaces, hardware, mesh protocol, and the web-based information processing platform. 2. The level-based mesh protocol, which is named as LayerMesh is highlighted. We specially designed “stair scheduling”, and “distributed dynamic load-balancing” to handle the above challenges. To our best knowledge, it is the first time that the fol- lowing key points are developed and demonstrated for the large scale sensor network. 1). Load-balancing problem in large scale network is solved and implemented by a fully distributed algorithm. 2). The two-tiered architecture and the open interface design provides infinite scalability. 3). The “stair scheduling” and “adaptive routing” pro- vides novel solutions for energy efficient and adaptive longtime maintenance. With these key issues, we designed and developed the L3SN system. The following sections of this paper are organized as follows. In Section 2, related work will be introduced. In Section3, the architecture and interfaces of L3SN system will be presented. The LayerMesh protocol will be introduced in Section 4. Some implementation results and experience are discussed in Section 5. We conclude the paper in Section 6. 2. Related Works 2.1. Agricultural Information Monitoring Using Wireless Sensor Network Wireless sensor network system for agriculture informa- tion monitoring has attracted great research attentions. Some preliminary experimental systems have been re- ported. Jenna Burrell, et al., investigated different sensor network configurations in vineyard application [2], and summarized some design guidelines for agricultural monitoring system. Murat Demirbas, et al. [3] deployed a small scale sensor monitoring system in a green house and drew suggestions that single-hop cluster should be a better solution for easy-to-use and network longevity. A mobile field data acquisition system was developed by Gomide et al. [4] to collect data for crop management and spatial-variability studies. Mahan and Wanjura [5] cooperated with a private company to develop a wireless, infrared thermometer system for infield data collection. Cross-bow developed eKo system [6], which involves solar-powered “eKo node” with zigbee radio and “eKo view” for real-time data rendering. It uses Xmesh proto- col to make the eKo system easily setup. 2.2. Large-Scale Longevious Sensor Network Studies of Large-scale longevious sensor network can be categorized into two classes: 1) application-oriented and 2) theoretical-oriented. In the first class, an early study of WSNs for habitat monitoring is reported in [7]. In [8], Werner-Allen et al deployed a WSN at Ecuador to moni- toring the activity of an active volcano. But the system scale is only 16 nodes. GreenOrbs [9] is reported as a large-scale system for canopy closure estimates, which had 120 sensors in 2009. However they used only the built in low power listening mode to conserve energy, which is not very energy efficient. In theoretical aspect, many results can be found in the literature. Li et al. [1] studied the message, energy and time complexities for data collection, query and aggrega- tion in large scale network. Yick et al. [10] provided an extensive survey for the main results of this area. How- ever, up to now, few results are found to thoroughly in- vestigate and solve the scalability, longevity and envi- ronment dynamics of agricultural wireless sensor net- work. 3. L3SN System: Architecture and Interfaces We designed and developed L3SN. The system architec- ture and interfaces are introduced in this section. 3.1 System Architecture L3SN is designed with the aim of open architecture and standardized interfaces. Figure 1 shows the system ar- chitecture and the standardized interfaces. Particularly, the architecture of L3SN includes a Two- tiered Sensor Network for data collection and an Infor- mation Service Platform for data rendering and processing. 1) Two-tiered Sensor Network. The sensor network in L3SN is composed by many low-tier energy-limited nodes (LNs), and some high-tier gateways. The LNs in low-tier capture environmental data and report the raw data to the gateway. The gate- ways organize the neighboring LNs into clusters and work as the cluster head. It collects information in its cluster, aggregates the information, and reports the re- sults to the Internet. Through the Internet, the data cap- tured by the wireless sensors are finally reported to the service platform and utilized by end users. 2) Information Service Platform. The information service platform contains data log- ging daemon, database, and web server. It provides data storage, data processing, data querying and other agri- cultural information services to users. Copyright © 2010 SciRes. WSN 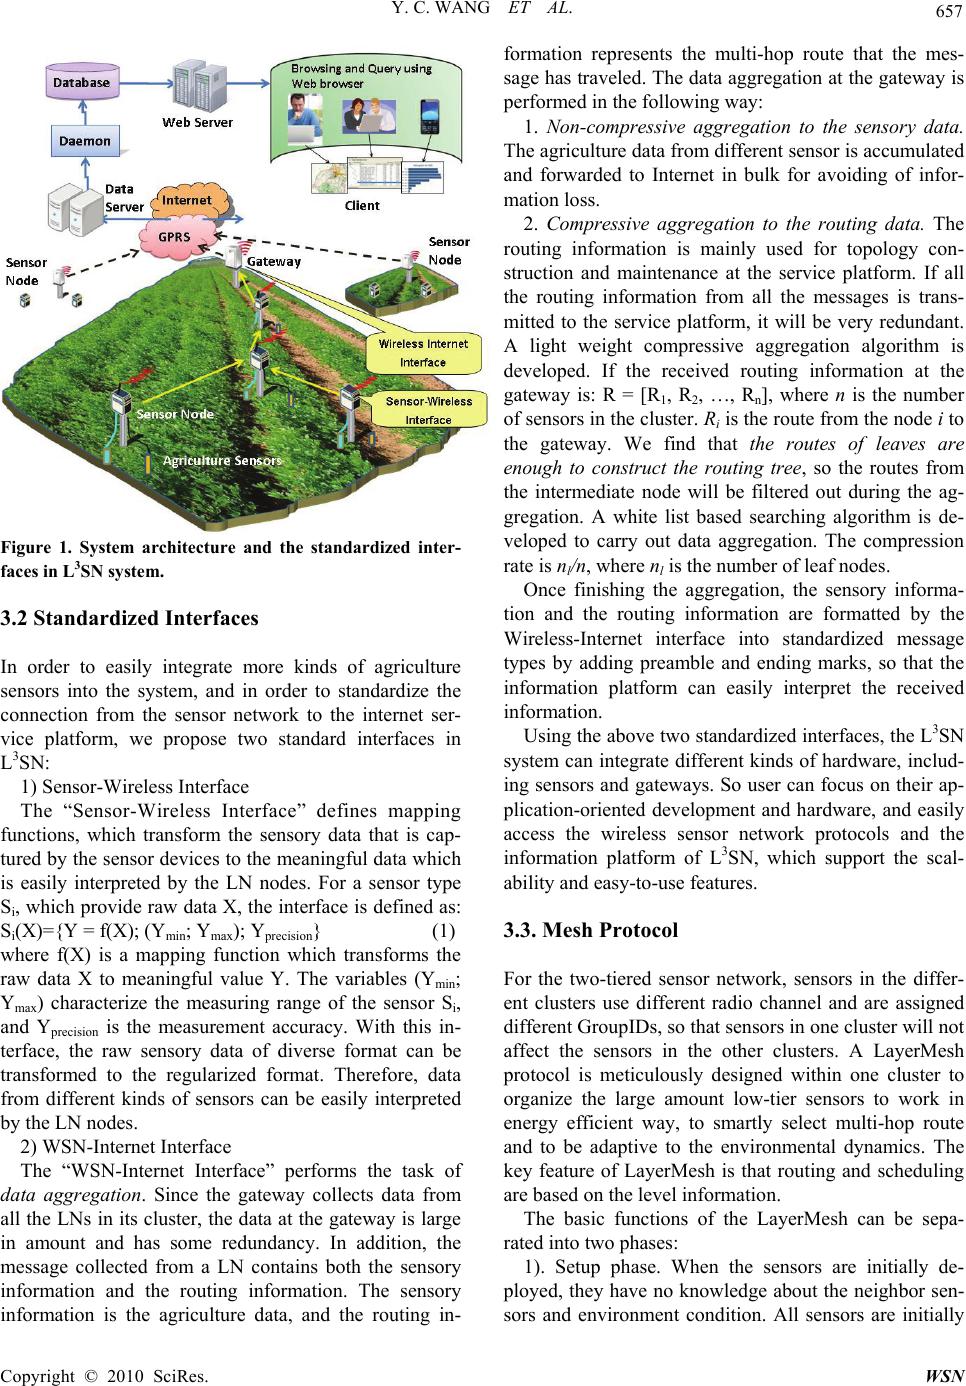 Y. C. WANG ET AL. 657 Figure 1. System architecture and the standardized inter- faces in L3SN system. 3.2 Standardized Interfaces In order to easily integrate more kinds of agriculture sensors into the system, and in order to standardize the connection from the sensor network to the internet ser- vice platform, we propose two standard interfaces in L3SN: 1) Sensor-Wireless Interface The “Sensor-Wireless Interface” defines mapping functions, which transform the sensory data that is cap- tured by the sensor devices to the meaningful data which is easily interpreted by the LN nodes. For a sensor type Si, which provide raw data X, the interface is defined as: Si(X)={Y = f(X); (Ymin; Ymax); Yprecision} (1) where f(X) is a mapping function which transforms the raw data X to meaningful value Y. The variables (Ymin; Ymax) characterize the measuring range of the sensor Si, and Yprecision is the measurement accuracy. With this in- terface, the raw sensory data of diverse format can be transformed to the regularized format. Therefore, data from different kinds of sensors can be easily interpreted by the LN nodes. 2) WSN-Internet Interface The “WSN-Internet Interface” performs the task of data aggregation. Since the gateway collects data from all the LNs in its cluster, the data at the gateway is large in amount and has some redundancy. In addition, the message collected from a LN contains both the sensory information and the routing information. The sensory information is the agriculture data, and the routing in- formation represents the multi-hop route that the mes- sage has traveled. The data aggregation at the gateway is performed in the following way: 1. Non-compressive aggregation to the sensory data. The agriculture data from different sensor is accumulated and forwarded to Internet in bulk for avoiding of infor- mation loss. 2. Compressive aggregation to the routing data. The routing information is mainly used for topology con- struction and maintenance at the service platform. If all the routing information from all the messages is trans- mitted to the service platform, it will be very redundant. A light weight compressive aggregation algorithm is developed. If the received routing information at the gateway is: R = [R1, R2, …, Rn], where n is the number of sensors in the cluster. Ri is the route from the node i to the gateway. We find that the routes of leaves are enough to construct the routing tree, so the routes from the intermediate node will be filtered out during the ag- gregation. A white list based searching algorithm is de- veloped to carry out data aggregation. The compression rate is nl/n, where nl is the number of leaf nodes. Once finishing the aggregation, the sensory informa- tion and the routing information are formatted by the Wireless-Internet interface into standardized message types by adding preamble and ending marks, so that the information platform can easily interpret the received information. Using the above two standardized interfaces, the L3SN system can integrate different kinds of hardware, includ- ing sensors and gateways. So user can focus on their ap- plication-oriented development and hardware, and easily access the wireless sensor network protocols and the information platform of L3SN, which support the scal- ability and easy-to-use features. 3.3. Mesh Protocol For the two-tiered sensor network, sensors in the differ- ent clusters use different radio channel and are assigned different GroupIDs, so that sensors in one cluster will not affect the sensors in the other clusters. A LayerMesh protocol is meticulously designed within one cluster to organize the large amount low-tier sensors to work in energy efficient way, to smartly select multi-hop route and to be adaptive to the environmental dynamics. The key feature of LayerMesh is that routing and scheduling are based on the level information. The basic functions of the LayerMesh can be sepa- rated into two phases: 1). Setup phase. When the sensors are initially de- ployed, they have no knowledge about the neighbor sen- sors and environment condition. All sensors are initially Copyright © 2010 SciRes. WSN 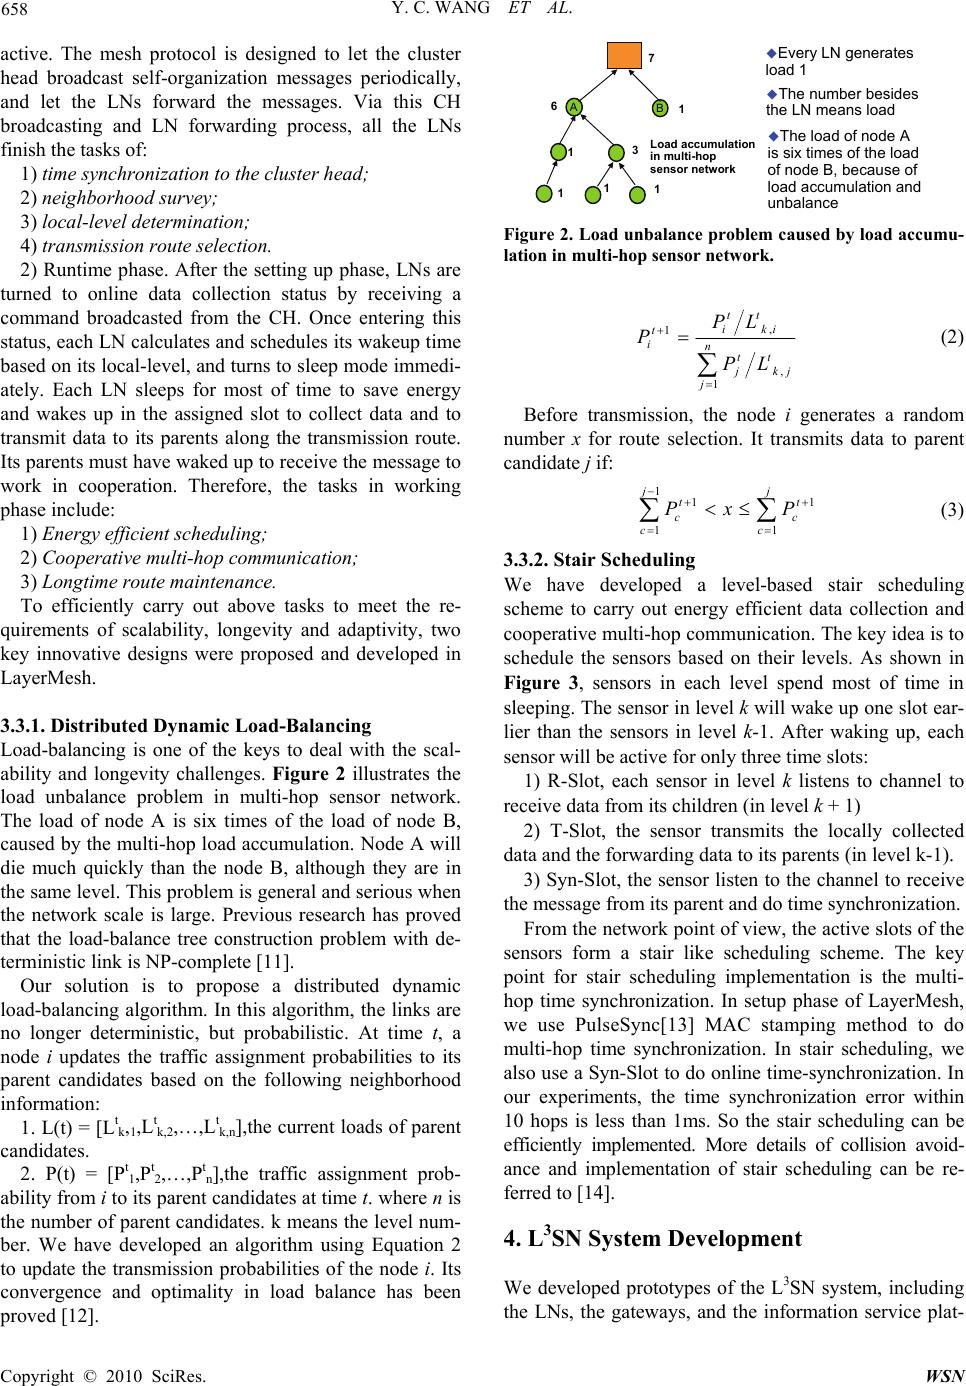 658 Y. C. WANG ET AL. active. The mesh protocol is designed to let the cluster head broadcast self-organization messages periodically, and let the LNs forward the messages. Via this CH broadcasting and LN forwarding process, all the LNs finish the tasks of: 1) time synchronization to the cluster head; 2) neighborhood survey; 3) local-level determination; 4) transmission route selection. 2) Runtime phase. After the setting up phase, LNs are turned to online data collection status by receiving a command broadcasted from the CH. Once entering this status, each LN calculates and schedules its wakeup time based on its local-level, and turns to sleep mode immedi- ately. Each LN sleeps for most of time to save energy and wakes up in the assigned slot to collect data and to transmit data to its parents along the transmission route. Its parents must have waked up to receive the message to work in cooperation. Therefore, the tasks in working phase include: 1) Energy efficient scheduling; 2) Cooperative multi-hop communication; 3) Longtime route maintenance. To efficiently carry out above tasks to meet the re- quirements of scalability, longevity and adaptivity, two key innovative designs were proposed and developed in LayerMesh. 3.3.1. Distributed Dynamic Load-Balancing Load-balancing is one of the keys to deal with the scal- ability and longevity challenges. Figure 2 illustrates the load unbalance problem in multi-hop sensor network. The load of node A is six times of the load of node B, caused by the multi-hop load accumulation. Node A will die much quickly than the node B, although they are in the same level. This problem is general and serious when the network scale is large. Previous research has proved that the load-balance tree construction problem with de- terministic link is NP-complete [11]. Our solution is to propose a distributed dynamic load-balancing algorithm. In this algorithm, the links are no longer deterministic, but probabilistic. At time t, a node i updates the traffic assignment probabilities to its parent candidates based on the following neighborhood information: 1. L(t) = [Lt k,1,Lt k,2,…,Lt k,n],the current loads of parent candidates. 2. P(t) = [Pt 1,Pt 2,…,Pt n],the traffic assignment prob- ability from i to its parent candidates at time t. where n is the number of parent candidates. k means the level num- ber. We have developed an algorithm using Equation 2 to update the transmission probabilities of the node i. Its convergence and optimality in load balance has been proved [12]. AB 1 1 3 1 6 7 1Load accumulation in multi-hop sensor network Every LN generates load 1 The load of node A is six times of the load of node B, because of load accumulation and unbalance 1 The number besides the LN means load Figure 2. Load unbalance problem caused by load accumu- lation in multi-hop sensor network. , 1 , 1 tt iki t intt j kj j PL P PL (2) Before transmission, the node i generates a random number x for route selection. It transmits data to parent candidate j if: 1 1 11 jj t c cc 1t c P xP (3) 3.3.2. Stair Scheduling We have developed a level-based stair scheduling scheme to carry out energy efficient data collection and cooperative multi-hop communication. The key idea is to schedule the sensors based on their levels. As shown in Figure 3, sensors in each level spend most of time in sleeping. The sensor in level k will wake up one slot ear- lier than the sensors in level k-1. After waking up, each sensor will be active for only three time slots: 1) R-Slot, each sensor in level k listens to channel to receive data from its children (in level k + 1) 2) T-Slot, the sensor transmits the locally collected data and the forwarding data to its parents (in level k-1). 3) Syn-Slot, the sensor listen to the channel to receive the message from its parent and do time synchronization. From the network point of view, the active slots of the sensors form a stair like scheduling scheme. The key point for stair scheduling implementation is the multi- hop time synchronization. In setup phase of LayerMesh, we use PulseSync[13] MAC stamping method to do multi-hop time synchronization. In stair scheduling, we also use a Syn-Slot to do online time-synchronization. In our experiments, the time synchronization error within 10 hops is less than 1ms. So the stair scheduling can be efficiently implemented. More details of collision avoid- ance and implementation of stair scheduling can be re- ferred to [14]. 4. L3SN System Development We developed prototypes of the L3SN system, including the LNs, the gateways, and the information service plat- Copyright © 2010 SciRes. WSN 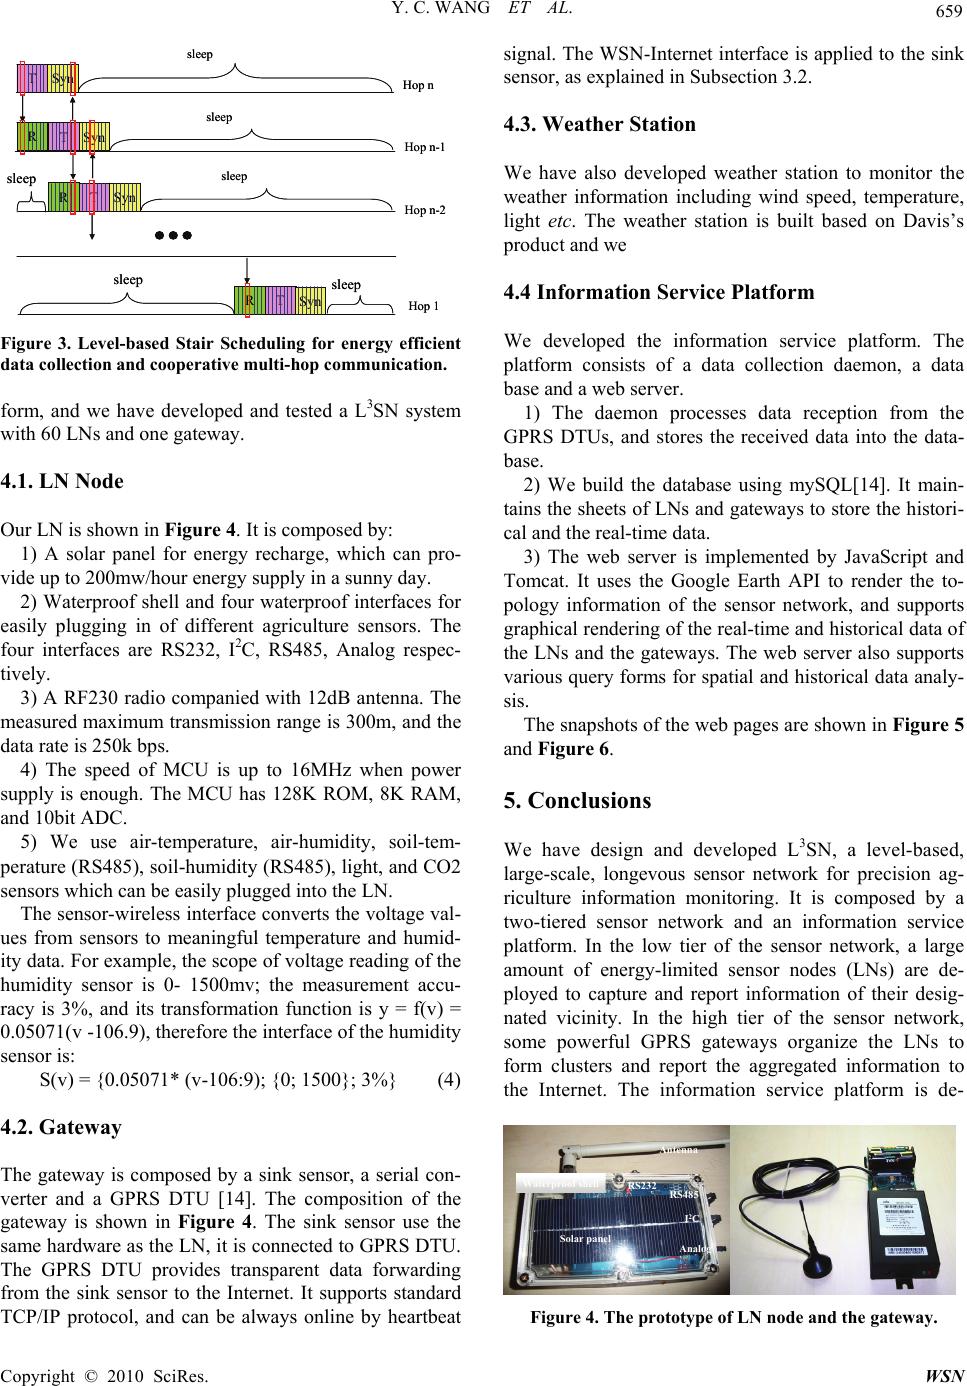 Y. C. WANG ET AL. 659 TSyn RTSyn RTSyn RT Syn Hop n Hop n-1 Hop n-2 Hop 1 sleep sleep sleep sleep sleep sleep TSyn RTSyn RTSyn RT Syn Hop n Hop n-1 Hop n-2 Hop 1 sleep sleep sleep sleep sleep sleep Figure 3. Level-based Stair Scheduling for energy efficient data collection and cooperative multi-hop communication. form, and we have developed and tested a L3SN system with 60 LNs and one gateway. 4.1. LN Node Our LN is shown in Figure 4. It is composed by: 1) A solar panel for energy recharge, which can pro- vide up to 200mw/hour energy supply in a sunny day. 2) Waterproof shell and four waterproof interfaces for easily plugging in of different agriculture sensors. The four interfaces are RS232, I2C, RS485, Analog respec- tively. 3) A RF230 radio companied with 12dB antenna. The measured maximum transmission range is 300m, and the data rate is 250k bps. 4) The speed of MCU is up to 16MHz when power supply is enough. The MCU has 128K ROM, 8K RAM, and 10bit ADC. 5) We use air-temperature, air-humidity, soil-tem- perature (RS485), soil-humidity (RS485), light, and CO2 sensors which can be easily plugged into the LN. The sensor-wireless interface converts the voltage val- ues from sensors to meaningful temperature and humid- ity data. For example, the scope of voltage reading of the humidity sensor is 0- 1500mv; the measurement accu- racy is 3%, and its transformation function is y = f(v) = 0.05071(v -106.9), therefore the interface of the humidity sensor is: S(v) = {0.05071* (v-106:9); {0; 1500}; 3%} (4) 4.2. Gateway The gateway is composed by a sink sensor, a serial con- verter and a GPRS DTU [14]. The composition of the gateway is shown in Figure 4. The sink sensor use the same hardware as the LN, it is connected to GPRS DTU. The GPRS DTU provides transparent data forwarding from the sink sensor to the Internet. It supports standard TCP/IP protocol, and can be always online by heartbeat signal. The WSN-Internet interface is applied to the sink sensor, as explained in Subsection 3.2. 4.3. Weather Station We have also developed weather station to monitor the weather information including wind speed, temperature, light etc. The weather station is built based on Davis’s product and we 4.4 Information Service Platform We developed the information service platform. The platform consists of a data collection daemon, a data base and a web server. 1) The daemon processes data reception from the GPRS DTUs, and stores the received data into the data- base. 2) We build the database using mySQL[14]. It main- tains the sheets of LNs and gateways to store the histori- cal and the real-time data. 3) The web server is implemented by JavaScript and Tomcat. It uses the Google Earth API to render the to- pology information of the sensor network, and supports graphical rendering of the real-time and historical data of the LNs and the gateways. The web server also supports various query forms for spatial and historical data analy- sis. The snapshots of the web pages are shown in Figure 5 and Figure 6. 5. Conclusions We have design and developed L3SN, a level-based, large-scale, longevous sensor network for precision ag- riculture information monitoring. It is composed by a two-tiered sensor network and an information service platform. In the low tier of the sensor network, a large amount of energy-limited sensor nodes (LNs) are de- ployed to capture and report information of their desig- nated vicinity. In the high tier of the sensor network, some powerful GPRS gateways organize the LNs to form clusters and report the aggregated information to the Internet. The information service platform is de- Solar panel Antenna Waterproof shell RS485 I 2 C Analog RS232 Figure 4. The prototype of LN node and the gateway. Copyright © 2010 SciRes. WSN 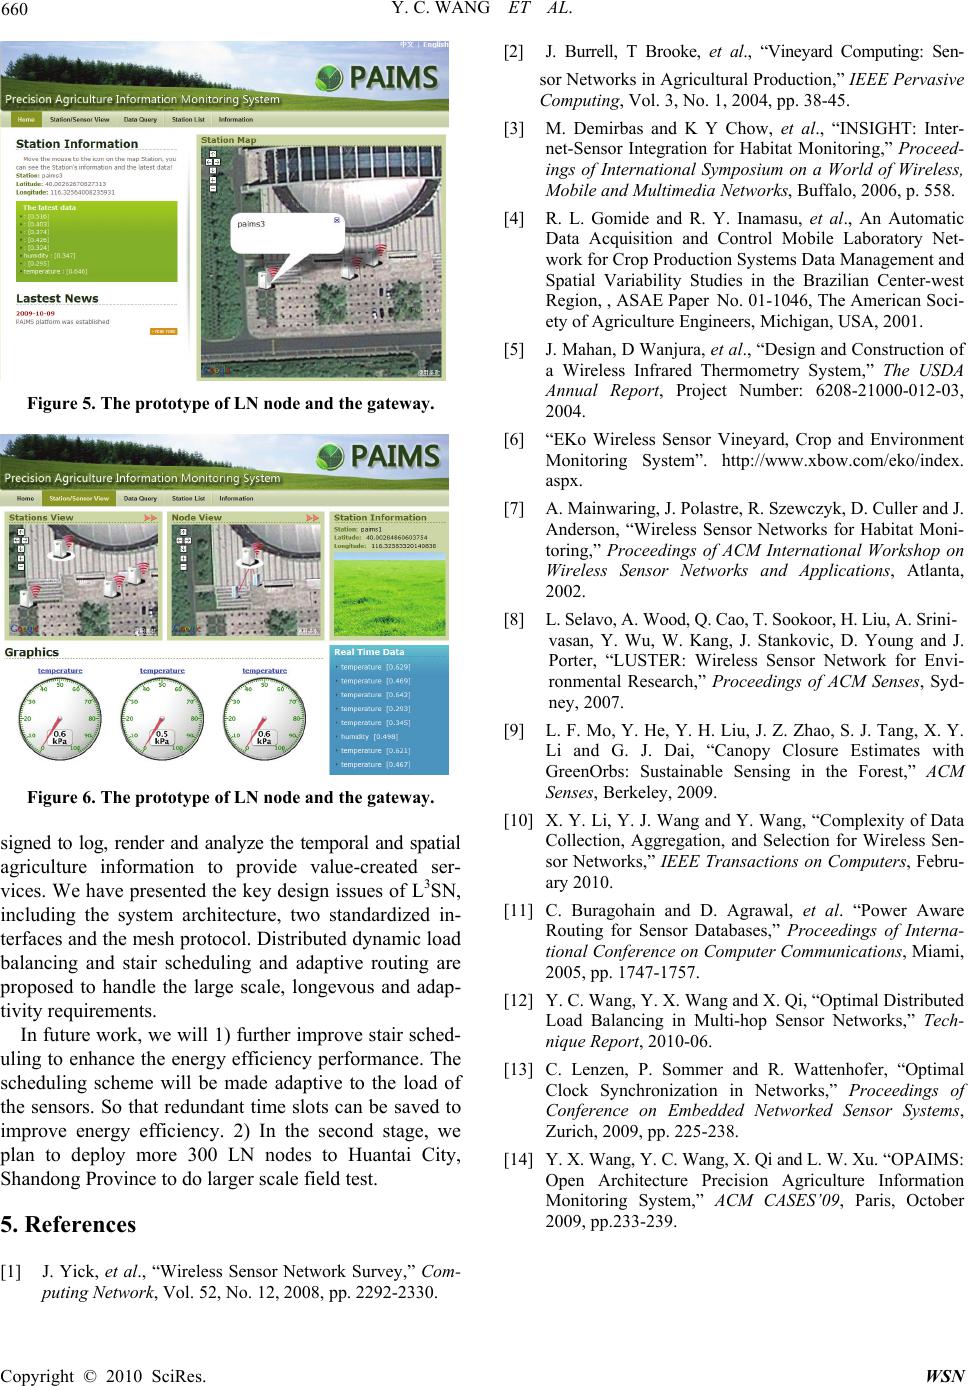 Y. C. WANG ET AL. Copyright © 2010 SciRes. WSN 660 [2] J. Burrell, T Brooke, et al., “Vineyard Computing: Sen- sor Networks in Agricultural Production,” IEEE Pervasive Computing, Vol. 3, No. 1, 2004, pp. 38-45. [3] M. Demirbas and K Y Chow, et al., “INSIGHT: Inter- net-Sensor Integration for Habitat Monitoring,” Proceed- ings of International Symposium on a World of Wireless, Mobile and Multimedia Networks, Buffalo, 2006, p. 558. [4] R. L. Gomide and R. Y. Inamasu, et al., An Automatic Data Acquisition and Control Mobile Laboratory Net- work for Crop Production Systems Data Management and Spatial Variability Studies in the Brazilian Center-west Region, , ASAE Paper No. 01-1046, The American Soci- ety of Agriculture Engineers, Michigan, USA, 2001. [5] J. Mahan, D Wanjura, et al., “Design and Construction of a Wireless Infrared Thermometry System,” The USDA Annual Report, Project Number: 6208-21000-012-03, 2004. Figure 5. The prototype of LN node and the gateway. [6] “EKo Wireless Sensor Vineyard, Crop and Environment Monitoring System”. http://www.xbow.com/eko/index. aspx. [7] A. Mainwaring, J. Polastre, R. Szewczyk, D. Culler and J. Anderson, “Wireless Sensor Networks for Habitat Moni- toring,” Proceedings of ACM International Workshop on Wireless Sensor Networks and Applications, Atlanta, 2002. [8] L. Selavo, A. Wood, Q. Cao, T. Sookoor, H. Liu, A. Srini- vasan, Y. Wu, W. Kang, J. Stankovic, D. Young and J. Porter, “LUSTER: Wireless Sensor Network for Envi- ronmental Research,” Proceedings of ACM Senses, Syd- ney, 2007. [9] L. F. Mo, Y. He, Y. H. Liu, J. Z. Zhao, S. J. Tang, X. Y. Li and G. J. Dai, “Canopy Closure Estimates with GreenOrbs: Sustainable Sensing in the Forest,” ACM Senses, Berkeley, 2009. Figure 6. The prototype of LN node and the gateway. [10] X. Y. Li, Y. J. Wang and Y. Wang, “Complexity of Data Collection, Aggregation, and Selection for Wireless Sen- sor Networks,” IEEE Transactions on Computers, Febru- ary 2010. signed to log, render and analyze the temporal and spatial agriculture information to provide value-created ser- vices. We have presented the key design issues of L3SN, including the system architecture, two standardized in- terfaces and the mesh protocol. Distributed dynamic load balancing and stair scheduling and adaptive routing are proposed to handle the large scale, longevous and adap- tivity requirements. [11] C. Buragohain and D. Agrawal, et al. “Power Aware Routing for Sensor Databases,” Proceedings of Interna- tional Conference on Computer Communications, Miami, 2005, pp. 1747-1757. [12] Y. C. Wang, Y. X. Wang and X. Qi, “Optimal Distributed Load Balancing in Multi-hop Sensor Networks,” Tech- nique Report, 2010-06. In future work, we will 1) further improve stair sched- uling to enhance the energy efficiency performance. The scheduling scheme will be made adaptive to the load of the sensors. So that redundant time slots can be saved to improve energy efficiency. 2) In the second stage, we plan to deploy more 300 LN nodes to Huantai City, Shandong Province to do larger scale field test. [13] C. Lenzen, P. Sommer and R. Wattenhofer, “Optimal Clock Synchronization in Networks,” Proceedings of Conference on Embedded Networked Sensor Systems, Zurich, 2009, pp. 225-238. [14] Y. X. Wang, Y. C. Wang, X. Qi and L. W. Xu. “OPAIMS: Open Architecture Precision Agriculture Information Monitoring System,” ACM CASES’09, Paris, October 2009, pp.233-239. 5. References [1] J. Yick, et al., “Wireless Sensor Network Survey,” Com- puting Network, Vol. 52, No. 12, 2008, pp. 2292-2330. |