Paper Menu >>
Journal Menu >>
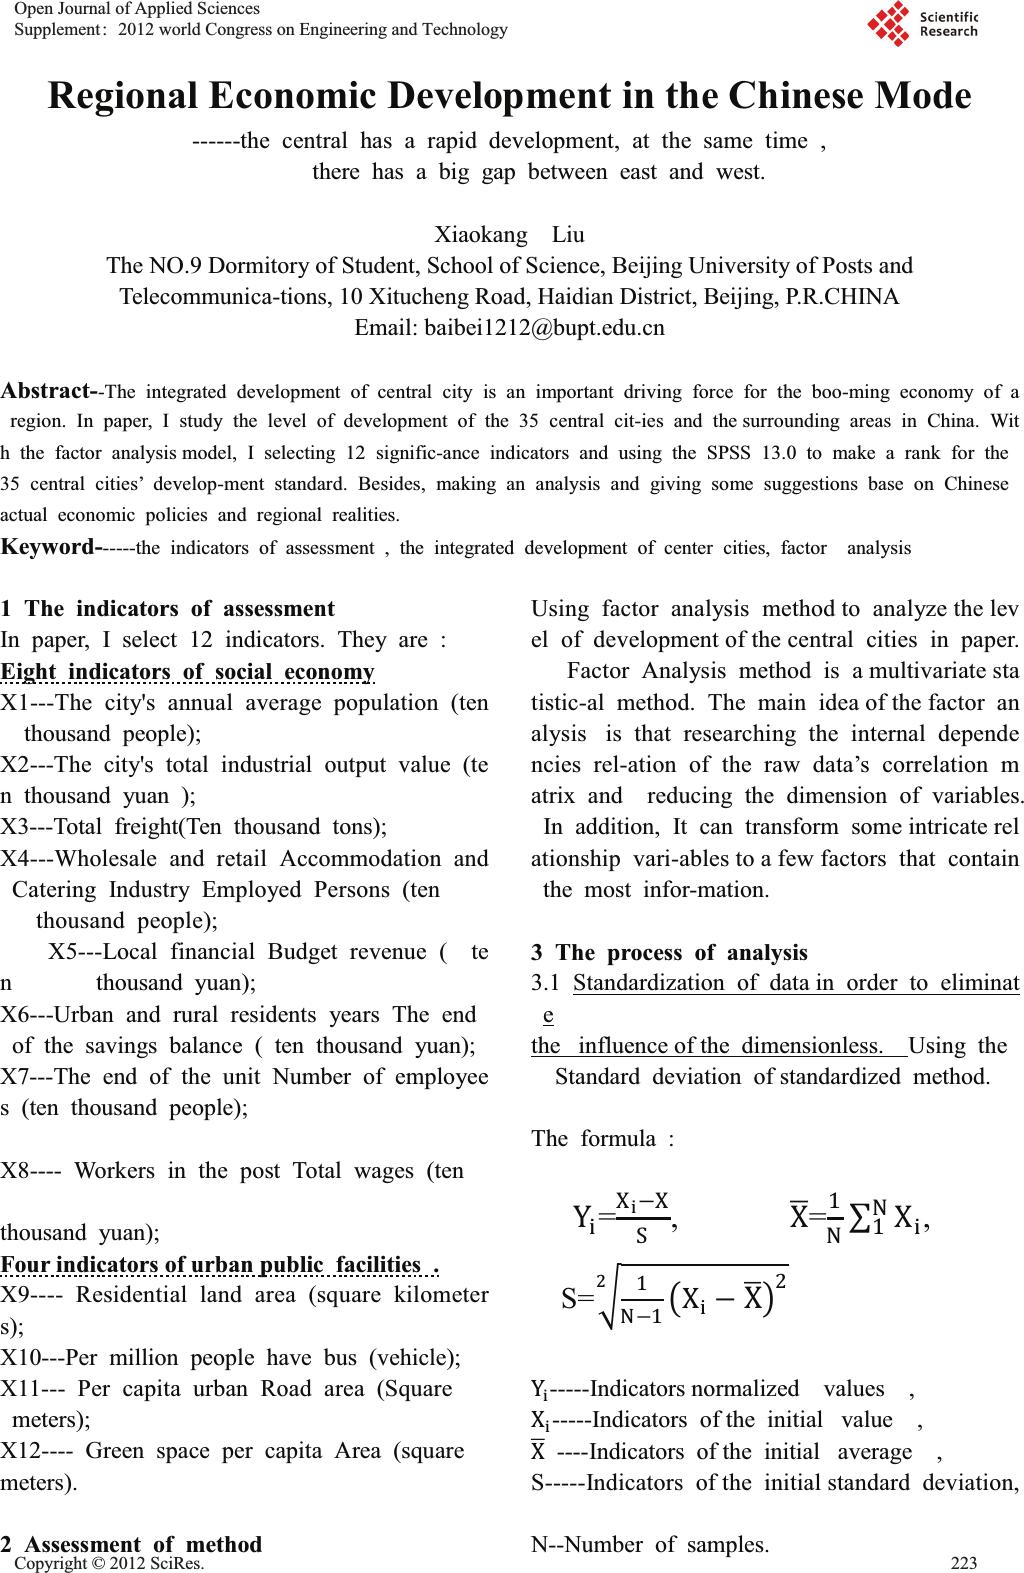 Regional Economic Development in the Chinese Mode ------the central has a rapid development, at the same time , there has a big gap between east and west. Xiaokang Liu The NO.9 Dormitory of Student, School of Science, Beijing University of Posts and Telecommunica-tions, 10 Xitucheng Road, Haidian District, Beijing, P.R.CHINA Email: baibei1212@bupt.edu.cn Abstract--The integrated development of central city is an important driving force for the boo-ming economy of a region. In paper, I study the level of development of the 35 central cit-ies and the surrounding areas in China. Wit h the factor analysis model, I selecting 12 signific-ance indicators and using the SPSS 13.0 to make a rank for the 35 central cities’ develop-ment standard. Besides, making an analysis and giving some suggestions base on Chinese actual economic policies and regional realities. Keyword------the indicators of assessment , the integrated development of center cities, factor analysis 1 The indicators of assessment In paper, I select 12 indicators. They are : Eight indicators of social economy X1---The city's annual average population (ten thousand people); X2---The city's total industrial output value (te n thousand yuan ); X3---Total freight(Ten thousand tons); X4---Wholesale and retail Accommodation and Catering Industry Employed Persons (ten thousand people); X5---Local financial Budget revenue ( te n thousand yuan); X6---Urban and rural residents years The end of the savings balance ( ten thousand yuan); X7---The end of the unit Number of employee s (ten thousand people); X8---- Workers in the post Total wages (ten thousand yuan); Fourindicators of urbanpublic facilities . X9---- Residential land area (square kilometer s); X10---Per million people have bus (vehicle); X11--- Per capita urban Road area (Square meters); X12---- Green space per capita Area (square meters). 2 Assessment of method Using factor analysis method to analyze the lev el of development of the central cities in paper. Factor Analysis method is a multivariate sta tistic-al method. The main idea of the factor an alysis is that researching the internal depende ncies rel-ation of the raw data’s correlation m atrix and reducing the dimension of variables. In addition, It can transform some intricate rel ationship vari-ables to a few factors that contain the most infor-mation. 3 The process of analysis 3.1 Standardization of data in order to eliminat e the influence of the dimensionless. Using the Standard deviation of standardized method. The formula : Yi=XiെX S, X ഥ=1 NσXi N 1, S=ට1 Nെ1൫XiെX ഥ൯2 2 Yi-----Indicators normalized values , Xi-----Indicators of the initial value , X ഥ ----Indicators of the initial average , S-----Indicators of the initial standard deviation, N--Number of samples. Open Journal of Applied Sciences Supplement:2012 world Congress on Engineering and Technology Cop y ri g ht © 2012 SciRes.223 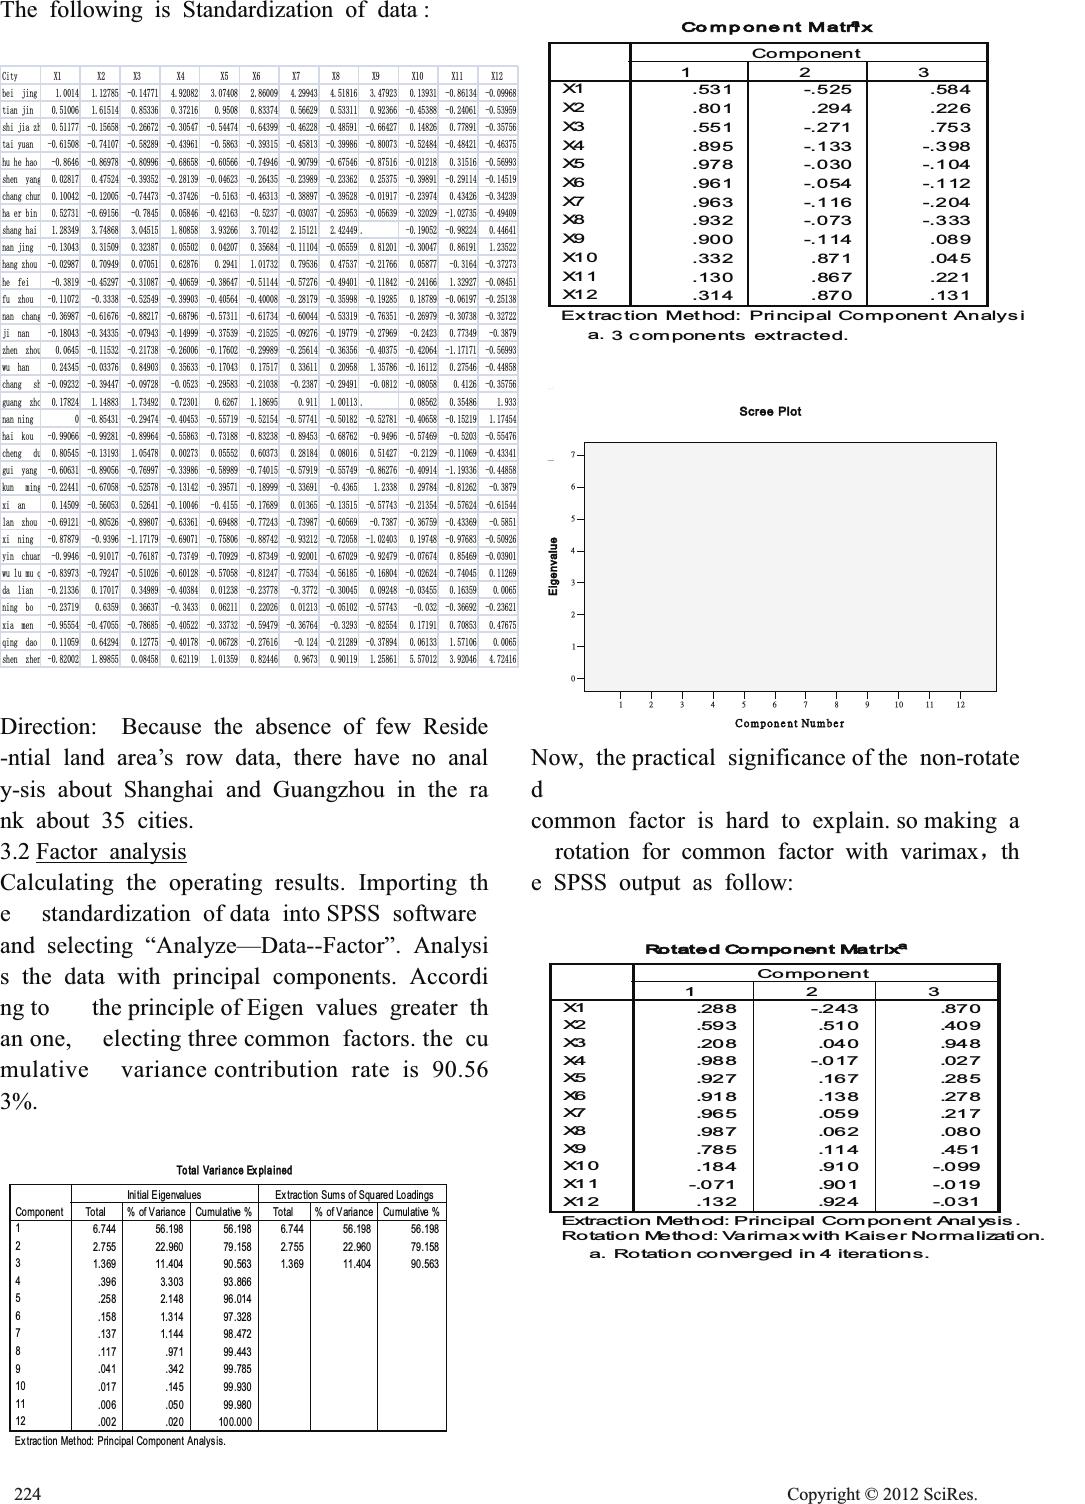 The following is Standardization of data : &LW\; ;;;;; ; ; ; ;;; EHLMLQJ WLDQMLQ VKLMLD] K WDL\XDQ KXKHKDR VKHQ\DQ J FKDQJFKX Q KDHUELQ VKDQJKDL QDQMLQJ KDQJ]KRX KHIHL IX]KRX QDQFKDQ J MLQDQ ]KHQ]KR X ZXKDQ FKDQJV K JXDQJ]K R QDQQLQJ KDLNRX FKHQJG X JXL\DQJ NXQPLQ J [LDQ ODQ]KRX [LQLQJ \LQFKXD Q ZXOXPX T GDOLDQ QLQJER [LDPHQ TLQJGDR VKHQ]KH Q Direction: Because the absence of few Reside -ntial land area’s row data, there have no anal y-sis about Shanghai and Guangzhou in the ra nk about 35 cities. 3.2 Calculating the operating results. Importing th e standardization of data into SPSS software and selecting “Analyze—Data--Factor”. Analysi s the data with principal components. Accordi ng to the principle of Eigen values greater th an one, electing three common factors. the cu mulative variance contribution rate is 90.56 3%. Factor analysis Now, the practical significance of the non-rotate d common factor is hard to explain. so making a rotation for common factor with varimaxˈth e SPSS output as follow: Total Variance Explained 6.74456.19856.198 6.74456.19856.198 2.75522.96079.158 2.75522.96079.158 1.36911.40490.563 1.36911.40490.563 .396 3.303 93.866 .258 2.148 96.014 .158 1.314 97.328 .137 1.144 98.472 .117.971 99.443 .041.342 99.785 .017 .145 99.930 .006.050 99.980 .002.020 100.000 Component 1 2 3 4 5 6 7 8 9 10 11 12 To t al% of VarianceCumulative %To t al% of VarianceCumulative % Initial EigenvaluesExtraction Sums of Squared Loadings Extraction Method: Principal Component Analysis. Component Matrix a .531 -.525 .584 .801 .294 .226 .551 -.271 .753 .895 -.133 -.398 .978 -.030 -.104 .961 -.054 -.112 .963 -.116 -.204 .932 -.073 -.333 .900 -.114 .089 .332 .871 .045 .130 .867 .221 .314 .870 .131 X1 X2 X3 X4 X5 X6 X7 X8 X9 X1 0 X1 1 X1 2 1 2 3 Componen t Extraction Method: Principal Component Analysi s 3 components extracted. a. IJijIJIJIJıĺĹĸķĶĵĴijIJ ń Ű Ů ű Ű ů Ŧů ŵġŏ Ŷ Ů ţ Ŧų ĸ ķ Ķ ĵ Ĵ ij IJ ı Eigenvalue Scree Plot Rotated Component Matrix a .288 -.243 .870 .593 .510 .409 .208 .040 .948 .988 -.017 .027 .927 .167 .285 .918 .138 .278 .965 .059 .217 .987 .062 .080 .785 .114 .451 .184.910 -.0 9 9 -.071 .901 -.019 .132.924 -.0 3 1 X1 X2 X3 X4 X5 X6 X7 X8 X9 X1 0 X1 1 X1 2 123 Component Extraction Method: Principal Component Analysis. Rotation Method: Varimax with Kaiser Normalization. Rotation converged in 4 iterations. a. 224 Cop y ri g ht © 2012 SciRes. 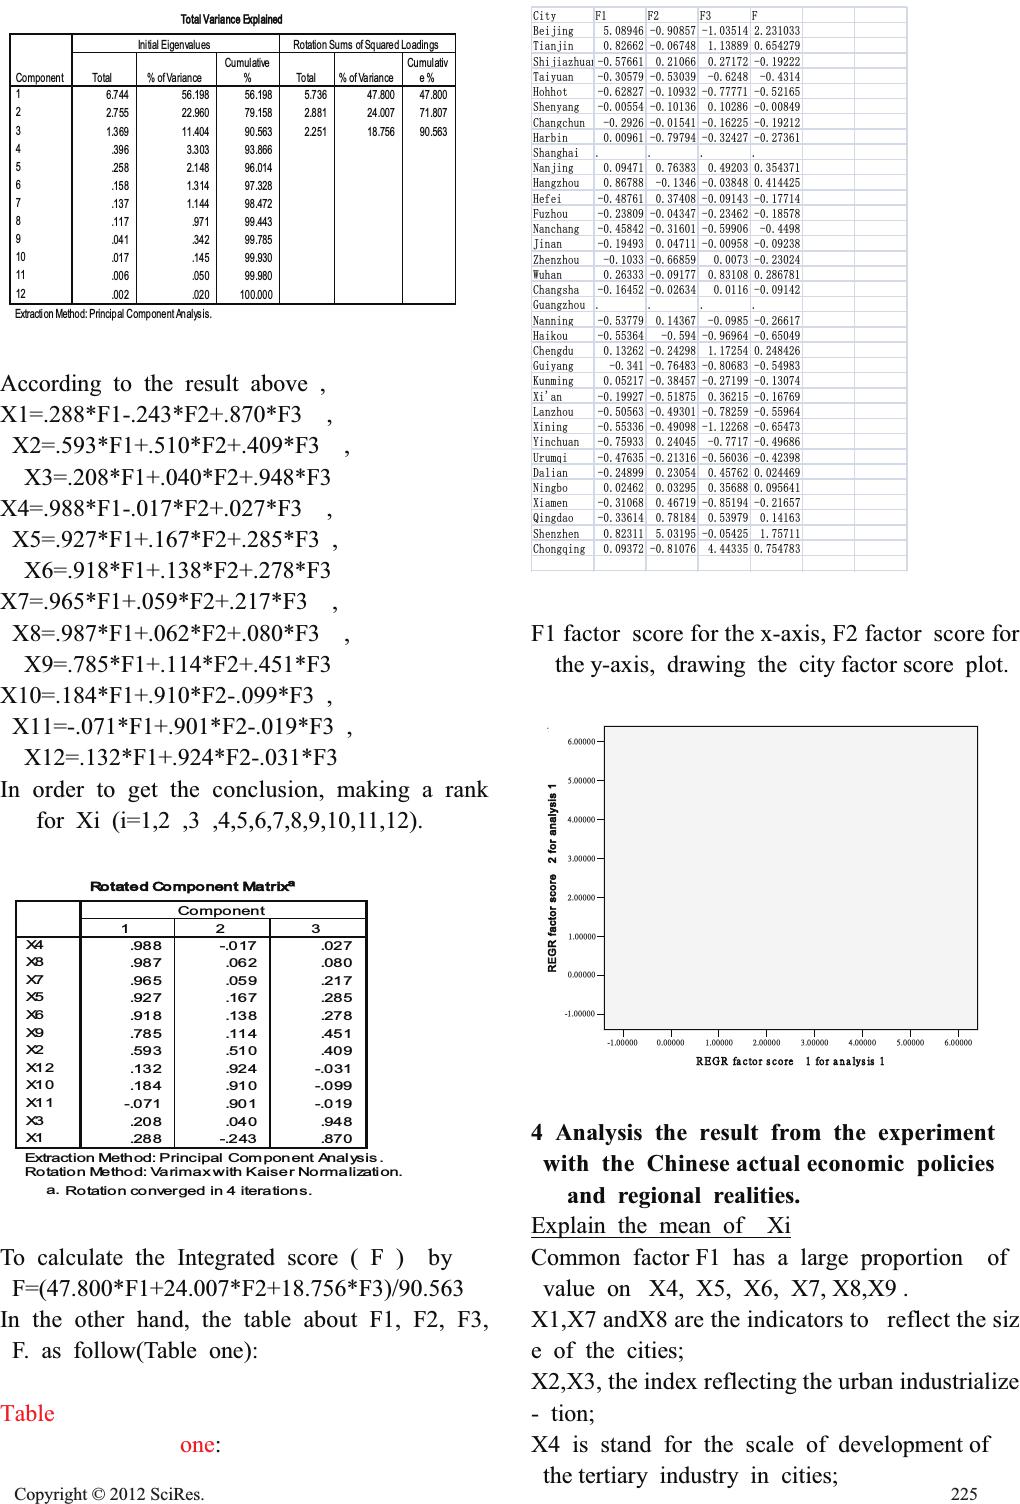 According to the result above , X1=.288*F1-.243*F2+.870*F3 , X2=.593*F1+.510*F2+.409*F3 , X3=.208*F1+.040*F2+.948*F3 X4=.988*F1-.017*F2+.027*F3 , X5=.927*F1+.167*F2+.285*F3 , X6=.918*F1+.138*F2+.278*F3 X7=.965*F1+.059*F2+.217*F3 , X8=.987*F1+.062*F2+.080*F3 , X9=.785*F1+.114*F2+.451*F3 X10=.184*F1+.910*F2-.099*F3 , X11=-.071*F1+.901*F2-.019*F3 , X12=.132*F1+.924*F2-.031*F3 In order to get the conclusion, making a rank for Xi (i=1,2 ,3 ,4,5,6,7,8,9,10,11,12). To calculate the Integrated score ( F ) by F=(47.800*F1+24.007*F2+18.756*F3)/90.563 In the other hand, the table about F1, F2, F3, F. as follow(Table one): Table one: &LW\) ) ) ) %HLMLQJ 7LDQMLQ 6KLMLD]KXD Q 7DL\XDQ +RKKRW 6KHQ\DQJ &KDQJFKXQ +DUELQ 6KDQJKDL 1DQMLQJ +DQJ]KRX +HIHL )X]KRX 1DQFKDQJ -LQDQ =KHQ]KRX :XKDQ &KDQJVKD *XDQJ]KRX 1DQQLQJ +DLNRX &KHQJGX *XL\DQJ .XQPLQJ ;LDQ /DQ]KRX ;LQLQJ <LQFKXDQ 8UXPTL 'DOLDQ 1LQJER ;LDPHQ 4LQJGDR 6KHQ]KHQ &KRQJTLQJ F1 factor score for the x-axis, F2 factor score for the y-axis, drawing the city factor score plot. 4 Analysis the result from the experiment with the Chineseactualeconomic policies and regional realities. Total Variance Explained 6.74456.19856.1985.73647.800 47.800 2.75522.96079.1582.88124.007 71.807 1.36911.40490.5632.25118.756 90.563 .396 3.303 93.866 .258 2.148 96.014 .158 1.314 97.328 .137 1.144 98.472 .117.971 99.443 .041.342 99.785 .017.145 99.930 .006 .050 99.980 .002.020 100.000 Component 1 2 3 4 5 6 7 8 9 10 11 12 To tal% of Variance Cumulative %To tal% of Variance Cumulativ e % Initial EigenvaluesRotation Sums of Squared Loadings Extraction Method: Principal Component Analysis. Explain the mean of Xi Common factor F1 has a large proportion of value on X4, X5, X6, X7, X8,X9 . X1,X7 andX8 are the indicators to reflect the siz e of the cities; X2,X3, the index reflecting the urban industrialize - tion; X4 is stand for the scale of development of the tertiary industry in cities; Rotated Component Matrix a .988 -.017 .027 .987 .062 .080 .965 .059 .217 .927 .167 .285 .918 .138 .278 .785 .114 .451 .593 .510 .409 .132.924 -.031 .184.910 -.099 -.071 .901 -.01 9 .208 .040 .948 .288 -.243 .870 X4 X8 X7 X5 X6 X9 X2 X1 2 X1 0 X1 1 X3 X1 1 2 3 Component Extraction Method: Principal Component Analysis. Rotation Method: Varimax with Kaiser Normalization. Rotation converged in 4 iterations. a. ķįıııııĶįıııııĵįıııııĴįıııııijįıııııIJįııııııįıııııĮIJįııııı œ ņňœġŧŢŤŵŰ ųġŴŤŰųŦ ġġġIJ ġŧŰ ųġŢ ů Ţ ŭźŴ ŪŴ ġIJ ķįııııı Ķįııııı ĵįııııı Ĵįııııı ijįııııı IJįııııı ıįııııı ĮIJįııııı REGR factor score 2 for analysis 1 Cop y ri g ht © 2012 SciRes.225 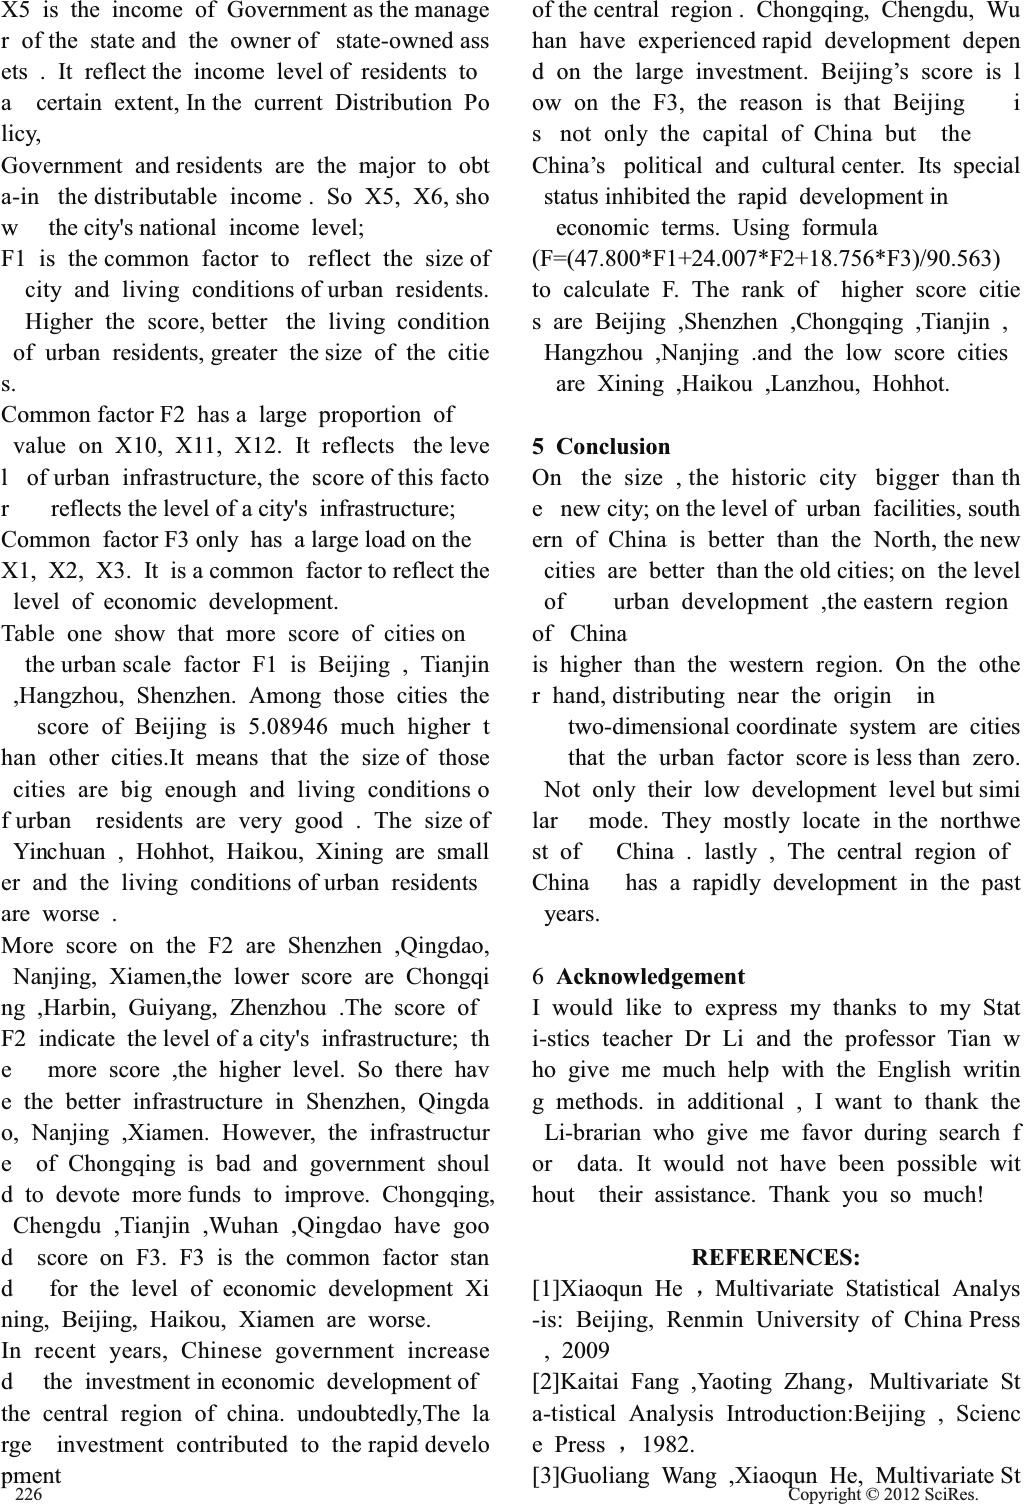 X5 is the income of Government as the manage r of the state and the owner of state-owned ass ets . It reflect the income level of residents to a certain extent, In the current Distribution Po licy, Government and residents are the major to obt a-in the distributable income . So X5, X6, sho w the city's national income level; F1 is the common factor to reflect the size of city and living conditions of urban residents. Higher the score, better the living condition of urban residents, greater the size of the citie s. Common factor F2 has a large proportion of value on X10, X11, X12. It reflects the leve l of urban infrastructure, the score of this facto r reflects the level of a city's infrastructure; Common factor F3 only has a large load on the X1, X2, X3. It is a common factor to reflect the level of economic development. Table one show that more score of cities on the urban scale factor F1 is Beijing , Tianjin ,Hangzhou, Shenzhen. Among those cities the score of Beijing is 5.08946 much higher t han other cities.It means that the size of those cities are big enough and living conditions o f urban residents are very good . The size of Yinchuan , Hohhot, Haikou, Xining are small er and the living conditions of urban residents are worse . More score on the F2 are Shenzhen ,Qingdao, Nanjing, Xiamen,the lower score are Chongqi ng ,Harbin, Guiyang, Zhenzhou .The score of F2 indicate the level of a city's infrastructure; th e more score ,the higher level. So there hav e the better infrastructure in Shenzhen, Qingda o, Nanjing ,Xiamen. However, the infrastructur e of Chongqing is bad and government shoul d to devote more funds to improve. Chongqing, Chengdu ,Tianjin ,Wuhan ,Qingdao have goo d score on F3. F3 is the common factor stan d for the level of economic development Xi ning, Beijing, Haikou, Xiamen are worse. In recent years, Chinese government increase d the investment in economic development of the central region of china. undoubtedly,The la rge investment contributed to the rapid develo pment of the central region . Chongqing, Chengdu, Wu han have experienced rapid development depen d on the large investment. Beijing’s score is l ow on the F3, the reason is that Beijing i s not only the capital of China but the China’s political and cultural center. Its special status inhibited the rapid development in economic terms. Using formula (F=(47.800*F1+24.007*F2+18.756*F3)/90.563) to calculate F. The rank of higher score citie s are Beijing ,Shenzhen ,Chongqing ,Tianjin , Hangzhou ,Nanjing .and the low score cities are Xining ,Haikou ,Lanzhou, Hohhot. 5 Conclusion On the size , the historic city bigger than th e new city; on the level of urban facilities, south ern of China is better than the North, the new cities are better than the old cities; on the level of urban development ,the eastern region of China is higher than the western region. On the othe r hand, distributing near the origin in two-dimensional coordinate system are cities that the urban factor score is less than zero. Not only their low development level but simi lar mode. They mostly locate in the northwe st of China . lastly , The central region of China has a rapidly development in the past years. 6 Acknowledgement I would like to express my thanks to my Stat i-stics teacher Dr Li and the professor Tian w ho give me much help with the English writin g methods. in additional , I want to thank the Li-brarian who give me favor during search f or data. It would not have been possible wit hout their assistance. Thank you so much! REFERENCES: [1]Xiaoqun He ˈMultivariate Statistical Analys -is: Beijing, Renmin University of China Press , 2009 [2]Kaitai Fang ,Yaoting ZhangˈMultivariate St a-tistical Analysis Introduction:Beijing , Scienc e Press ˈ1982. [3]Guoliang Wang ,Xiaoqun He, Multivariate St 226 Cop y ri g ht © 2012 SciRes.  -atistical Analysis of Economic Data: Xi’an , Shaanxi Science Press ,1993 [4]Kaitai Fang, Practical Multivariate Statistical Analysis:Shanghai, East China Normal Uni versity Press ,1989. [5][English] M. Kendall.Multivariate Analysis: Beijing, Science Press, 1999. [6]Bryan F.J.Manly, Multivariate Statistical Met hods: A Primer, Chapman and Hall, 1986. [7]Xiaoqun He, Modern Statistical Analysis Me thods and Application˖Beijing Renmin Univer sity of China Press, 2007. [8]Huiwen Wang, Partial least Squares Regress - ion Method and Its Application:Beijing,Nation al Defence Industry Press ,1999 [9]I.T.Jolliffe, Principal Component Analysis, S pringer-Verlag NewYork, Inc., 1986. [10] NPC Economic Forum, 1 April 2012, < h ttp://bbs.pinggu.org>.Statistical Yearbook of Chin a'surban (2011). [11]Kaitai Fang ,Enpei Pan, Cluster Analysis , Beijing: Geological Publishing Houseˈ1982. [12]Gordon, A.D.,Classification, Chapman and Hall, London,1975. [13]Hartigan,J.A.,Clustering Algorithms, John Wiley & Sons ,Inc. ,New York,1975. [14]Xueren Wang, Guisong Wang. Practical Mu l-tivariate Statistical Analysis, shanghai, Shangha i Science and Technology Press, 1990 [15]Honghong Zhou ,Ruodong Yang ,Advance English Writing ,Beijing , Tsinghua Universit y Press House, Beijing Jiaotong University Pres s ,2009. [16]Ryzin,J.Van[ed],Classification and clustering Acaolemic Press, New York,1977 [17]Arthanvai.T.S. and Yadolah Dodge, Mathe m-atical Programming in Statistics, John Wily & Sons,INC., New York,1981 [18]Xuewei, Statistical analysis and application of SPSS, Beijing, Renmin University of China Press, 2001 [19] Xuewei, Statistical Analysis Methods and Applications, Publishing House of Electronics Industry, 2007 [20] Xizhi Wu, Non-parametric Estimates, Beiji ng, China Statistics Press, 1999 [21]Minglong wu, Spss Statistical Applications o f Practice, Beijing, China Railway Publishing House, 2000 [22]Zhigang Guo, Social Statistical Analysis: SPSS Software Applications, Beijing, Publishi ng House of Electronics Industry, 2003 Cop y ri g ht © 2012 SciRes.227 |