Paper Menu >>
Journal Menu >>
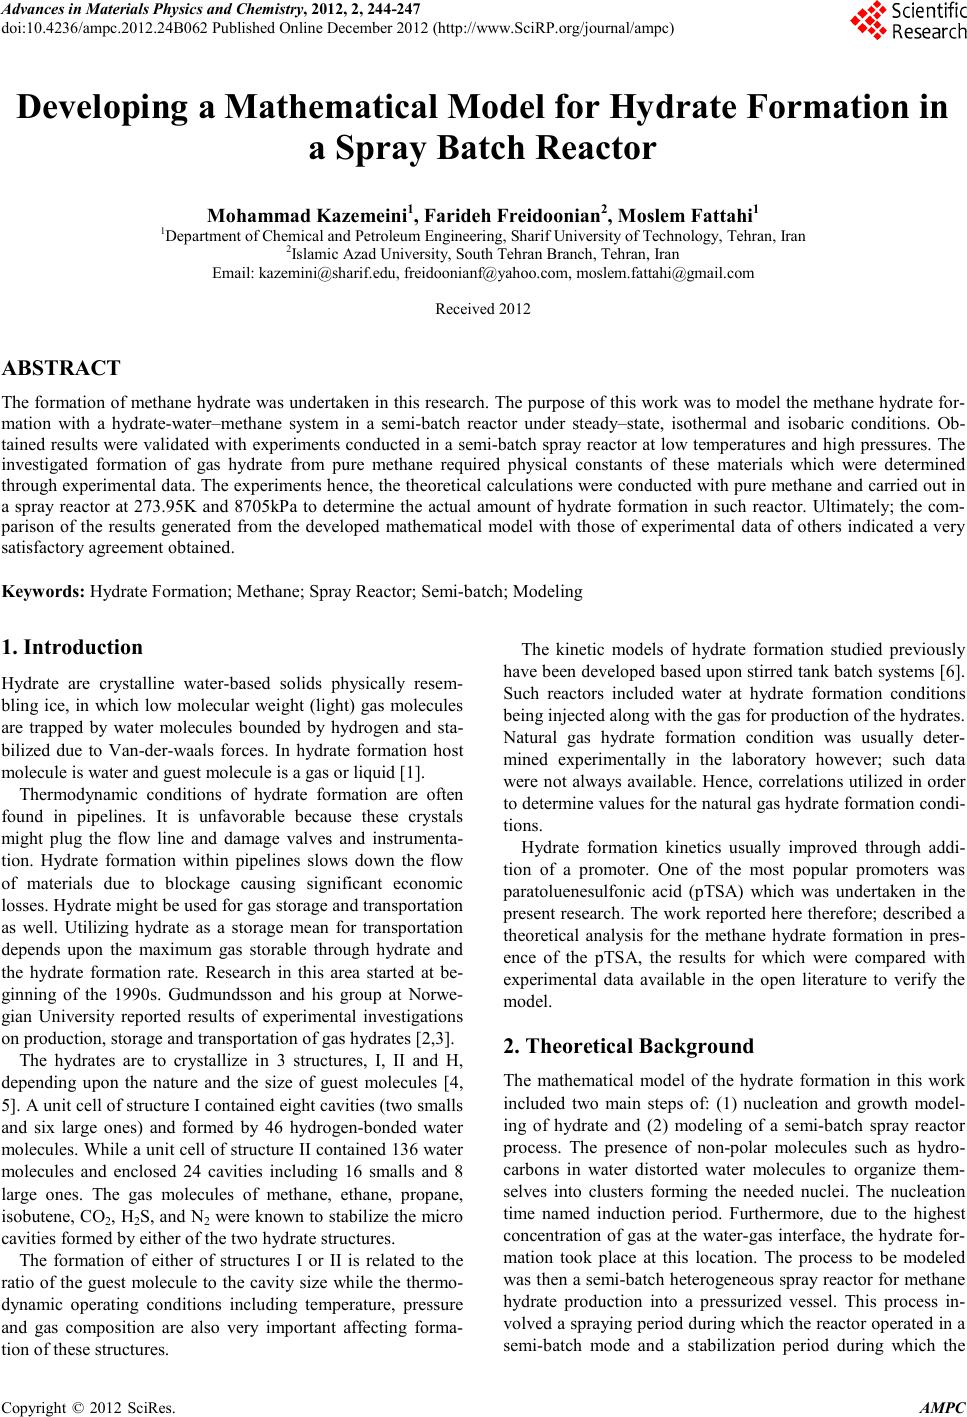 Advances in Ma terials Physics and Che mist ry, 2012, 2, 244-247 doi:10.4236/ampc.2012.24B062 Published Online December 2012 (htt p://www.SciRP.org/journal/ampc) Copyright © 2012 SciRes. AMPC Developing a Mathematical Model for Hydrate Formation in a Spray Batch Reactor Mohammad Ka zemeini1, Far ideh Freidoonian2, M oslem Fattahi1 1Department of Chemical and Petroleum Engineering, Sharif University of Technology, Tehran, Iran 2Islamic Azad University, South Tehran Branch, Tehran, Iran Email: kazemini@sharif.edu, freidoonianf@yahoo.com, moslem.fattahi@gmail.com Received 2012 ABSTRACT The formation of methane hydrate was undertaken in this research. The purpose of this work was to model the methane hydrate for- mation with a hydrate-water–methane system in a semi-batch reactor under steady–state, isothermal and isobaric conditions. Ob- tained results were validated wit h experiments con ducted in a semi-batch spray reactor at low temperatures and high pressures. The investigated formation of gas hydrate from pure methane required physical constants of these materials which were determined throu gh experimen tal d ata. The e xperiment s hence, the th eoret ical calcul ation s were con du cted with pu re methane an d carried out in a spray reactor at 273.95K and 8705kPa to determine the actual amount of hydrate formation in such reactor. Ultimately; the com- parison of the results generated from the developed mathematical model with those of experimental data of others indicated a very satisfactory agreement obtain ed. Keywords: Hydrate Formation ; Methane; Spray Reacto r ; Semi-batch; Modeling 1. Introduction Hydrate are crystalline water-based solids physically resem- bling ice, in which low molecular weight (light) gas molecules are trapped by water molecules bounded by hydrogen and sta- bilized due to Van-der-waals forces. In hydrate formation host molecule is water and guest molecule i s a gas or liqu id [1]. Thermodynamic conditions of hydrate formation are often found in pipelines. It is unfavorable because these crystals might plug the flow line and damage valves and instrumenta- tion. Hydrate formation within pipelines slows down the flow of materials due to blockage causing significant economic losses. Hydrate might be used for gas storage and transportation as well. Utilizing hydrate as a storage mean for transportation depends upon the maximum gas storable through hydrate and the hydrate formation rate. Research in this area started at be- ginning of the 1990s. Gudmundsson and his group at Norwe- gian University reported results of experimental investigations on production, storage and transportation of gas hydrates [2,3]. The hydrates are to crystallize in 3 structures, I, II and H, depending upon the nature and the size of guest molecules [4, 5]. A unit cell of structure I contained eight cavities (two smalls and six large ones) and formed by 46 hydrogen-bonded water molecules. While a uni t cell of structure I I contained 136 water molecules and enclosed 24 cavities including 16 smalls and 8 large ones. The gas molecules of methane, ethane, propane, isobutene, CO2, H2S, and N2 were known to stabilize t he micro cavities formed b y either of th e two hydrate structu res. The formation of either of structures I or II is related to the ratio o f th e guest molecule to t he cavity size whi le the ther mo- dynamic operating conditions including temperature, pressure and gas composition are also very important affecting forma- tion of these structures. The kinetic models of hydrate formation studied previously have been developed based upon stirred tank batch systems [6]. Such reactors included water at hydrate formation conditions being injected along with the gas for production of the hydrates. Natural gas hydrate formation condition was usually deter- mined experimentally in the laboratory however; such data were not always available. Hence, correlations utilized in ord er to determine values for the natural gas hydrate formation condi- tions. Hydrate formation kinetics usually improved through addi- tion of a promoter. One of the most popular promoters was paratoluenesulfonic acid (pTSA) which was undertaken in the presen t research. The work repo rted her e therefore; d escribed a theoretical analysis for the methane hydrate formation in pres- ence of the pTSA, the results for which were compared with experimental data available in the open literature to verify the model. 2. Theore tical Ba ckgrou n d The mathematical model of the hydrate formation in this work included two main steps of: (1) nucleation and growth model- ing of hydrate and (2) modeling of a semi-batch spray reactor process. The presence of non-polar molecules such as hydro- carbons in water distorted water molecules to organize them- selves into clusters forming the needed nuclei. The nucleation time named induction period. Furthermore, due to the highest concen tration of gas at th e water-gas interface, th e hydrate for- mation took place at this location. The process to be modeled was then a semi-bat ch hetero geneous spray reactor for methane hydrate production into a pressurized vessel. This process in- volved a spraying period during which the reactor operated in a semi-batch mode and a stabilization period during which the 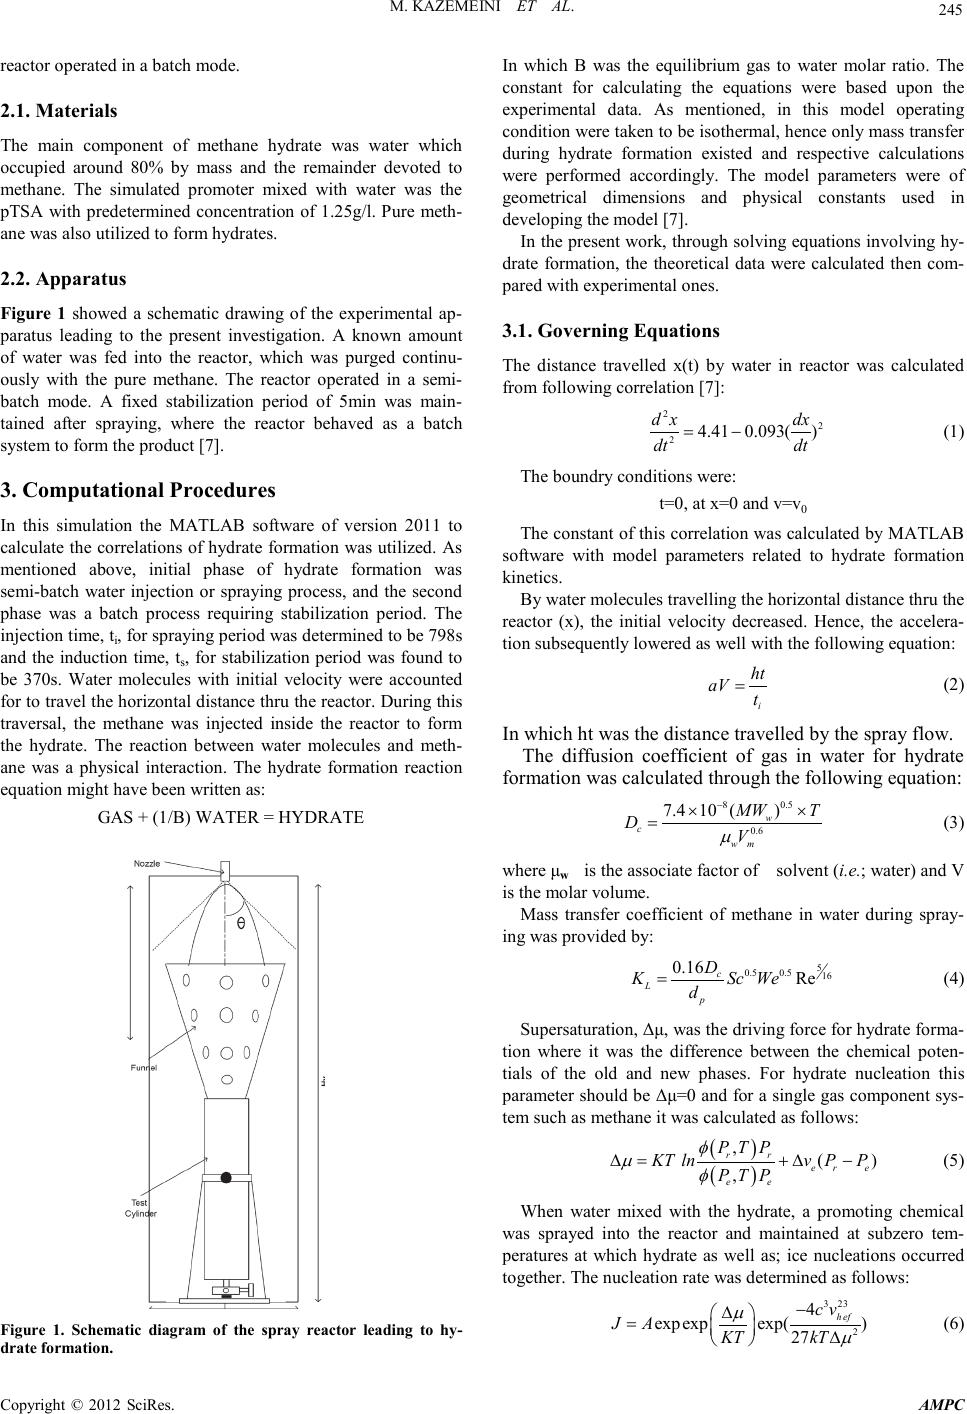 M. KAZ EMEINI ET AL. Co pyr i g ht © 2012 SciRes. AMPC 245 reactor operat ed in a bat ch mode. 2.1. Materials The main component of methane hydrate was water which occupied around 80% by mass and the remainder devoted to methane. The simulated promoter mixed with water was the pTSA with predetermined concentration of 1.25g/l. Pure meth- ane was also uti lized to form hydrates. 2.2. Apparatus Figure 1 showed a schematic drawing of the experimental ap- paratus leading to the present investigation. A known amount of water was fed into the reactor, which was purged continu- ously with the pure methane. The reactor operated in a semi- batch mode. A fixed stabilization period of 5min was main- tained after spraying, where the reactor behaved as a batch system to form the product [7]. 3. Computational Proced u res In this simulation the MATLAB software of version 2011 to calculate the correlatio ns of hydrate formation was utilized. As mentioned above, initial phase of hydrate formation was semi-batch water injection or spraying process, and the second phase was a batch process requiring stabilization period. The injection time, ti, for spraying period was determined to be 798s and the induction time, ts, for stabilization period was found to be 370s. Water molecules with initial velocity were accounted for to travel the horizontal distance thru the reactor. During this traversal, the methane was injected inside the reactor to form the hydrate. The reaction between water molecules and meth- ane was a physical interaction. The hydrate formation reaction equat ion might have been writt en as: GAS + (1/B) WATER = HYDRATE Figure 1. Schematic diagram of the spray reactor leading to hy- drate formation. In which B was the equilibrium gas to water molar ratio. The constant for calculating the equations were based upon the experimental data. As mentioned, in this model operating cond ition were taken to be i so th ermal, h en ce on ly mass t ran s fer during hydrate formation existed and respective calculations were performed accordingly. The model parameters were of geometrical dimensions and physical constants used in developing the model [7]. In the present work, through solving equations involving hy- drate formation, the theoretical data were calculated then com- pared with experiment al ones . 3.1. Governing Equa tions The distance travelled x(t) by water in reactor was calculated from following correlation [7]: 22 24.41 0.093() d xdx dt dt = − (1) The boundry conditions were: t=0, at x=0 and v=v0 The constant of this correlation was calculated by MATLAB software with model parameters related to hydrate formation kinetics. By water molecules travelling the horizontal distance thru the reactor (x), the initial velocity decreased. Hence, the accelera- tion subsequently lowered as well with the following equation: i ht aV t = (2) In which ht was the distance tra velled by the spr ay flow. The diffusion coefficient of gas in water for hydrate formation was calculated through the following eq uatio n: 8 0.5 0.6 7.410 () w c wm MW T DV µ − ×× = (3) where μw is t he associ ate factor of solvent (i .e.; water) and V is the molar volume. Mass transfer coefficient of methane in water during spray- ing was provided by: 5 0.5 0.516 0.16 Re c L p D KSc We d = (4) Supersaturation, Δμ, was the driving force for hydrate forma- tion where it was the difference between the chemical poten- tials of the old and new phases. For hydrate nucleation this parameter should be Δμ=0 and for a single gas component sys- tem such as methane it wa s calculat ed as follows: ( ) ( ) , () , rr er e ee PTP KT lnvPP PT P φ µφ ∆ =+∆− (5) When water mixed with the hydrate, a promoting chemical was sprayed into the reactor and maintained at subzero tem- peratures at which hydrate as well as; ice nucleations occurred together. The n ucleation rate was determin ed as follows: 3 23 2 4 expexp exp() 27 h ef cv JA KT kT µ µ − ∆ = ∆ (6) 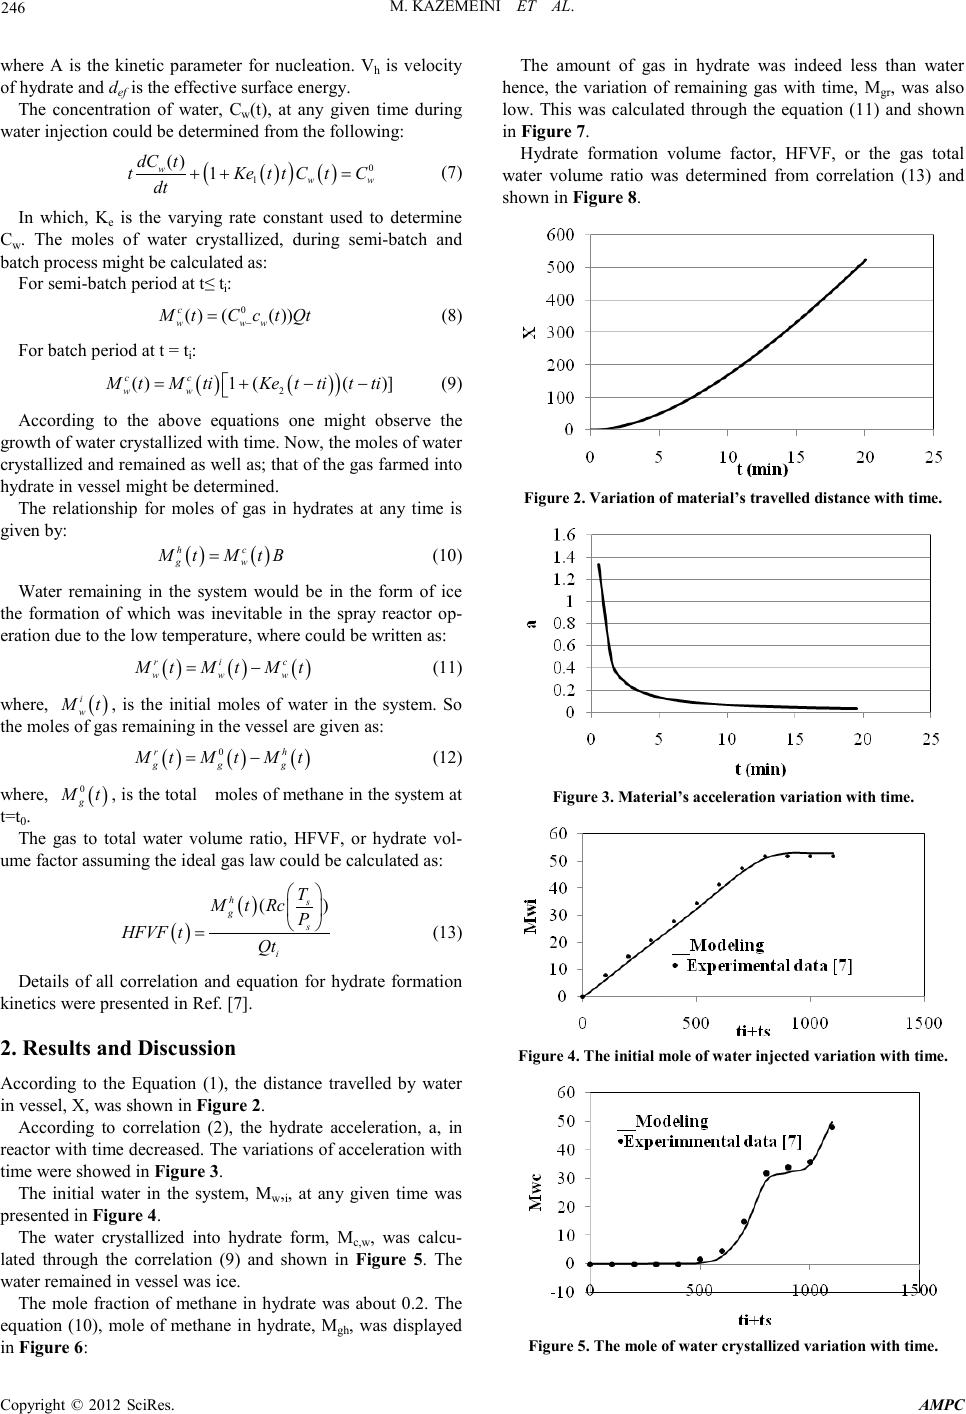 M. KAZ EMEINI ET AL. Copyright © 2012 SciRes. AMPC 246 where A is the kinetic parameter for nucleation. Vh is velocity of hydrate and def is the effective surface ener gy. The concentration of water, Cw(t), at any given time during water injection could be determined from the following: ( ) ( ) ( ) 0 1 () 1 www dC t tKe ttCtC dt ++ = (7) In which, Ke is the varying rate constant used to determine Cw. The moles of water crystallized, during semi-batch and batch process might be calculated as: For semi -batch period at t≤ ti: 0 () (()) c w ww M tCctQt − = (8) For batch period at t = ti: ( )() ) 2 ( )1(()] cc ww MtMtiKet tit ti=+− − (9) According to the above equations one might observe the growth of water crystallized with time. Now, the moles of water crystalli zed an d r emain ed as well as; t hat of th e gas far med in to hydrate in vessel might be determined. The relationship for moles of gas in hydrates at any time is given by: ( )( ) hc gw Mt MtB= (10) Water remaining in the system would be in the form of ice the formation of which was inevitable in the spray reactor op- eration due to the low temperature, where could be written as: ( )( )( ) ric www MtMt Mt= − (11) where, ( ) i w Mt , is the initial moles of water in the system. So the moles of gas remaining in the vessel are gi ven as: ( )()( ) 0rh ggg MtMt Mt= − (12) where, ( ) 0 g Mt , is the tot al moles of meth ane in the system at t=t0. The gas to total water volume ratio, HFVF, or hydrate vol- ume factor assuming the ideal gas law could be calculated as: ( )( ) () hs g s i T MtRc P HFVF tQt = (13) Details of all correlation and equation for hydrate formation kinetics were presen ted in Ref. [7]. 2. Results and Discussion According to the Equation (1), the distance travelled by water in vessel, X, was shown in Figure 2. According to correlation (2), the hydrate acceleration, a, in reactor with time decrea sed. The var iation s of accelerat ion with time were showed in Figure 3. The initial water in the system, Mw,i, at any given time was presented in Figure 4. The water crystallized into hydrate form, Mc,w, was calcu- lated through the correlation (9) and shown in Figure 5. The water re main ed in vessel was ice. The mole fraction of methane in hydrate was about 0.2. The equation (10), mole of methane in hydrate, Mgh, was displayed in Figure 6: The amount of gas in hydrate was indeed less than water hence, the variation of remaining gas with time, Mgr, was also low. This was calculated through the equation (11) and shown in Figure 7. Hydrate formation volume factor, HFVF, or the gas total water volume ratio was determined from correlation (13) and shown in Figure 8. Figure 2. Variation of material’s travelled distance with time. Figure 3. Materia l’s acc el er at i on va ri ation with time. Figure 4. The initial mole of water injected variation with time. Figure 5. The mole of water crystallized variation with time. 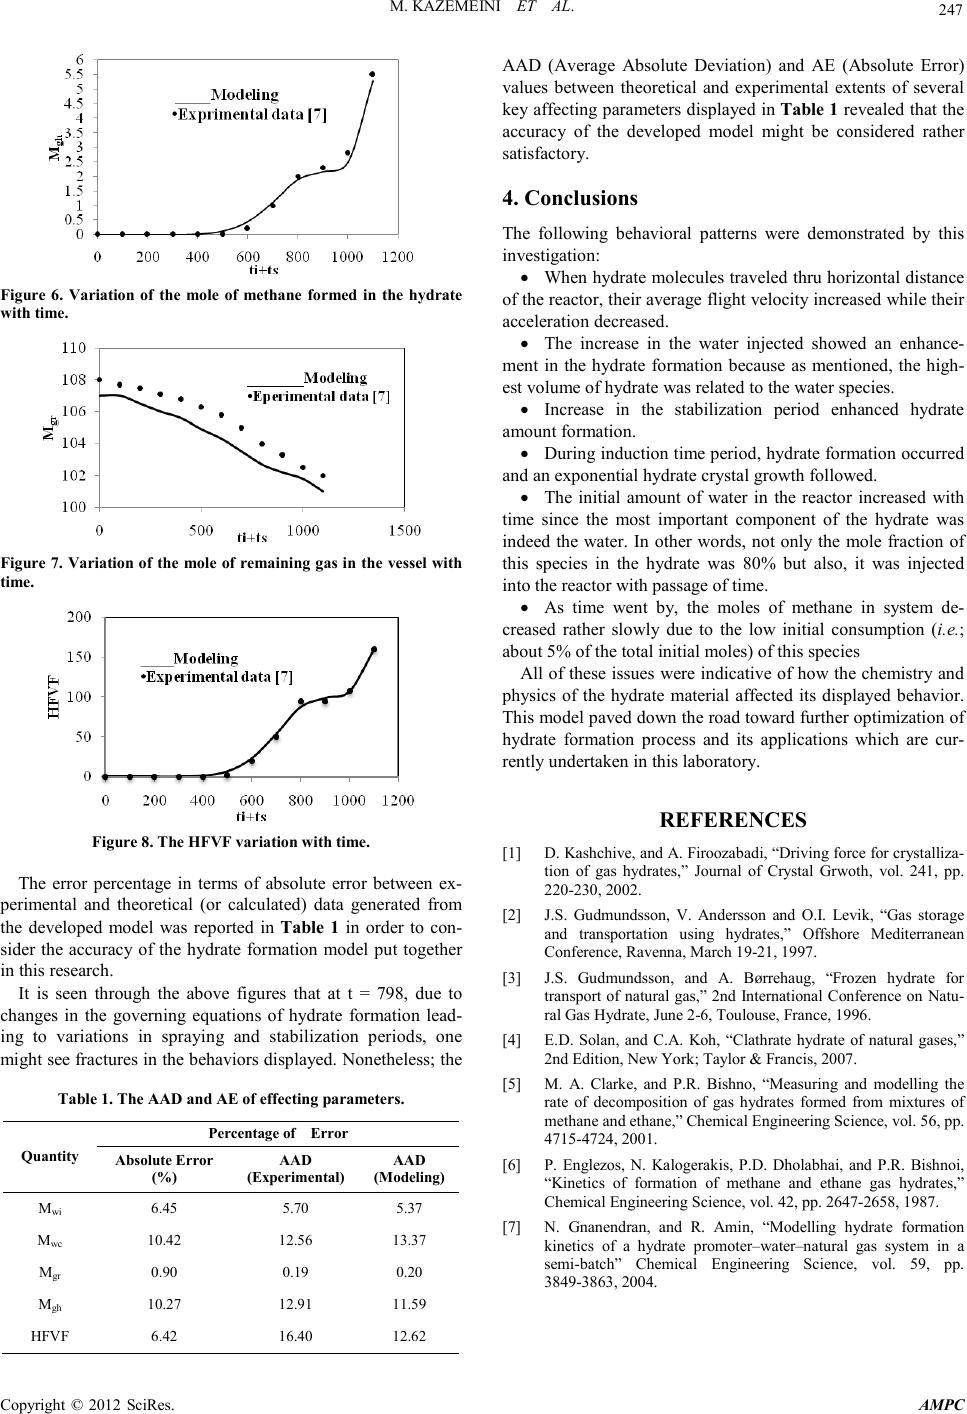 M. KAZ EMEINI ET AL. Co pyr i g ht © 2012 SciRes. AMPC 247 Figure 6. Variation of the mole of methane formed in the hydrate with time. Figure 7. Variation of the mole of remaining gas in the vessel with time. Figure 8. The HFVF variation with time. The error percentage in terms of absolute error between ex- perimental and theoretical (or calculated) data generated from the developed model was reported in Table 1 in order to con- sider the accuracy of the hydrate formation model put together in this r es ear ch. It is seen through the above figures that at t = 798, due to changes in the governing equations of hydrate formation lead- ing to variations in spraying and stabilization periods, one might see fractures in the behaviors displayed. Nonetheless; the Table 1. The AAD and AE of effecting parameters. Quantity Percentage of Error Absolute Erro r (%) AAD (Experimental) AAD (Modeling) Mwi 6.45 5.70 5 .37 Mwc 10.42 12.56 13.37 Mgr 0.9 0 0.19 0.20 Mgh 10.27 12.91 11.59 HFVF 6 .42 16.40 12.62 AAD (Average Absolute Deviation) and AE (Absolute Error) values between theoretical and experimental extents of several key affecting parameters displayed in Tabl e 1 revealed that the accuracy of the developed model might be considered rather satisfactory. 4. Conclusions The following behavioral patterns were demonstrated by this investigation: • When hydrate molecules traveled thru horizontal distance of the react or, th eir aver age flight velocity increased while their accelerat ion decreased. • The increase in the water injected showed an enhance- ment in the hydrate formation because as mentioned, the high- est volume of hydrate was related to th e water s pecies. • Increase in the stabilization period enhanced hydrate amount formation. • During induction time period, hydrate formation occurred and an exponential hydrate crystal growth followed. • The initial amount of water in the reactor increased with time since the most important component of the hydrate was indeed the water. In other words, not only the mole fraction of this species in the hydrate was 80% but also, it was injected into the reacto r wit h passage of time. • As time went by, the moles of methane in system de- creased rather slowly due to the low initial consumption (i.e.; about 5% of the total initial moles) of this species All of these issues were indicative o f ho w the ch emistry and physics of the hydrate material affected its displayed behavior. This model paved down the road toward further optimization of hydrate formation process and its applications which are cur- rently undertaken in this laboratory. REFERENCES [1] D. Kashchive, and A. Firoozabadi, “Driving force for crystalliza- tion of gas hydrates,” Journal of Crystal Grwoth, vol. 241, pp. 220-230, 2002. [2] J.S. Gudmundsson, V. Andersson and O.I. Levik, “Gas storage and transportation using hydrates,” Offshore Mediterranean Conference, Ravenna, March 19-21, 1997. [3] J.S. Gudmundsson, and A. Børrehaug, “Frozen hydrate for transport of natural gas,” 2nd International Conference on Natu- ral Gas Hydrate, June 2-6, Toulouse, France, 1996. [4] E.D. Solan, and C.A. Koh, “Clathrate hydrate of natural gases,” 2nd Edition, New York; Taylor & Francis, 2007. [5] M. A. Clarke, and P.R. Bishno, “Measuring and modelling the rate of decomposition of gas hydrates formed from mixtures of methane and et han e,” Ch emical Engineer in g Science, vol. 56, p p . 4715-4724, 2001. [6] P. Englezos, N. Kalogerakis, P.D. Dholabhai, and P.R. Bishnoi, “Kinetics of formation of methane and ethane gas hydrates,” Chemical Engineering Sc ience, vol. 42, pp. 2647-2658, 1987. [7] N. Gnanendran, and R. Amin, “Modelling hydrate formation kinetics of a hydrate promoter–water–natural gas system in a semi-batch” Chemical Engineering Science, vol. 59, pp. 3849-3863, 2004. |