Paper Menu >>
Journal Menu >>
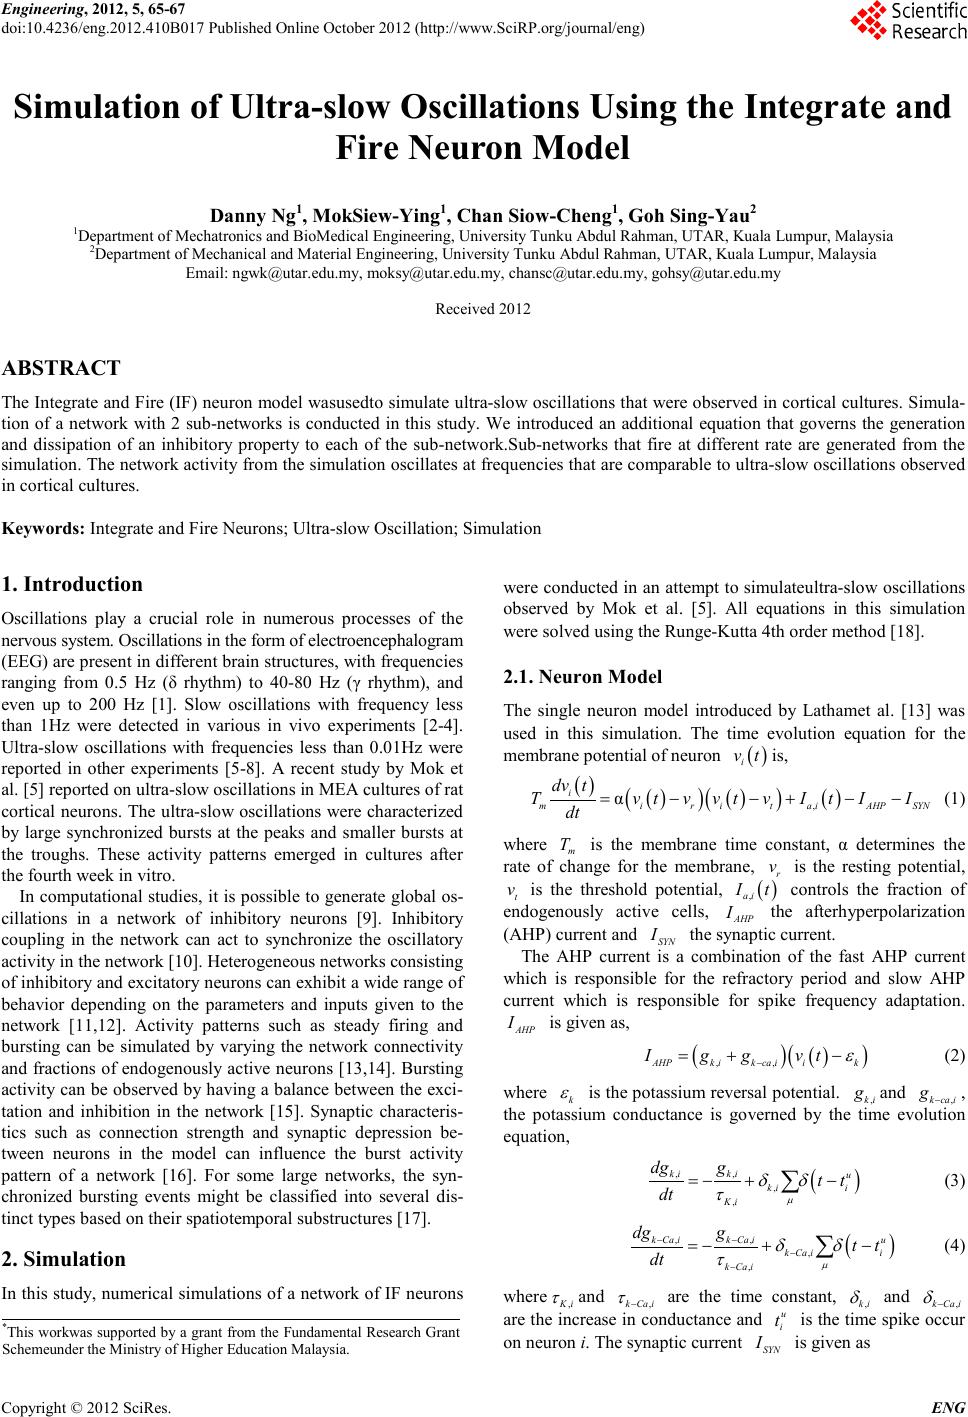 Engineering, 2012, 5, 65-67 doi:10.4236/eng.2012.410B017 Published Online October 2012 (http://www.SciRP.org/journal/eng) Copyright © 2012 SciRes. ENG Simulation of Ultra-slow Oscillations Using the Integrate and Fire Neuron Model Danny Ng1, MokSiew-Ying1, C han Siow-Cheng1, Goh Sing-Yau2 1Department of Mechatronics and BioMedical Engineering, University Tunku Abdul Rahman, UTAR, Kuala Lumpur, Malaysia 2Department of Mechanical and Material Engineering, University Tunku Abdul Rahman, UTAR, Kuala Lumpur, Malaysia Email: ngwk@utar.edu.my, moksy@utar.edu.my, chansc@utar.edu.my, gohsy@utar.edu.my Received 2012 ABSTRACT The Integrate and Fire (IF) neuron model wasusedto simulate ultra-slow oscillations that were observed in cortical cultures. Simula- tion of a network with 2 sub-networks is conducted in this study. We introduced an additional equation that governs the generation and dissipation of an inhibitory property to each of the sub-network.Sub-networks that fire at different rate are generated from the simulation. The network activity from the simulation oscillates at frequencies that are comparable to ultra-slow oscillations observed in cortical cultures. Keywords: Integrate and Fire Neurons; Ultra-slow Oscillation; Simulation 1. Introduction Oscillations play a crucial role in numerous processes of the nervous system. Oscillations in the form of electroencephalogram (EEG) are present in different brain structu res, wit h freq uen cies ranging from 0.5 Hz (δ rhythm) to 40-80 Hz (γ rhythm), and even up to 200 Hz [1]. Slow oscillations with frequency less than 1Hz were detected in various in vivo experiments [2-4]. Ultra-slow oscillations with frequencies less than 0.01Hz were reported in other experiments [5-8]. A recent study by Mok et al. [5] reported on ultra-slow oscillations in MEA cultures of rat cortical neurons. The ultra-slow oscillations were charact erized by large synchronized bursts at the peaks and smaller bursts at the troughs. These activity patterns emerged in cultures after the fourth week in vitro. In computational studies, it is possible to generate global os- cillations in a network of inhibitory neurons [9]. Inhibitory coupling in the network can act to synchronize the oscillatory activity in the network [10]. Heterogeneous networks consisting of inhibitory and excitatory neurons can exhibit a wide range of behavior depending on the parameters and inputs given to the network [11,12]. Activity patterns such as steady firing and bursting can be simulated by varying the network connectivity and fractions of endogenously active neurons [13,14]. Bursting activit y can be ob served by havin g a balance b etween th e exci- tation and inhibition in the network [15]. Synaptic characteris- tics such as connection strength and synaptic depression be- tween neurons in the model can influence the burst activity pattern of a network [16]. For some large networks, the syn- chronized bursting events might be classified into several dis- tinct types based on their spatiotemporal substructures [17]. 2. Simulation In this study, numerical simulations of a network of IF neurons were conducted in an attempt to simulateultra-slow oscillations observed by Mok et al. [5]. All equations in this simulation were solved using the Runge-Kutta 4th order method [18]. 2.1. Neuron Model The single neuron model introduced by Lathamet al. [13] was used in this simulation. The time evolution equation for the membrane potential of neuron ( ) i vt is, ( ) ( ) ( ) ( ) ( ) ( ) , α i mirita iAHPSYN dv t Tvt vvt vItII dt =−−+−− (1) whe re m T is the membrane time constant, α determines the rate of change for the membrane, r v is the resting potential, t v is the threshold potential, ( ) ,ai It controls the fraction of endogenously active cells, AHP I the afterhyperpolarization (AHP) current and SYN I the synaptic current. The AHP current is a combination of the fast AHP current which is responsible for the refractory period and slow AHP current which is responsible for spike frequency adaptation. AHP I is given as, ( ) ( ) ( ) ,,AHPkikca iik Ig gvt ε − =+− (2) whe re k ε is the potassium reversal potential. ,ki gand ,kca i g−, the potassium conductance is governed by the time evolution equation, ( ) ,, , , ki kiu ki i Ki dg gtt dt µ δδ τ =−+ − ∑ (3) ( ) ,, , , kCa ikCa iu kCa ii kCa i dg gtt dt µ δδ τ −− − − =−+ − ∑ (4) where ,Ki τ and ,kCa i τ − are the time constant, ,ki δ and ,kCa i δ − are the in crease in co nductance and u i t is the time spike occur on neuro n i. The synaptic current SYN I is given as * This workwas supported by a grant from the Fundamental Research Grant Schemeunder the Ministry of Higher Education Malaysia. 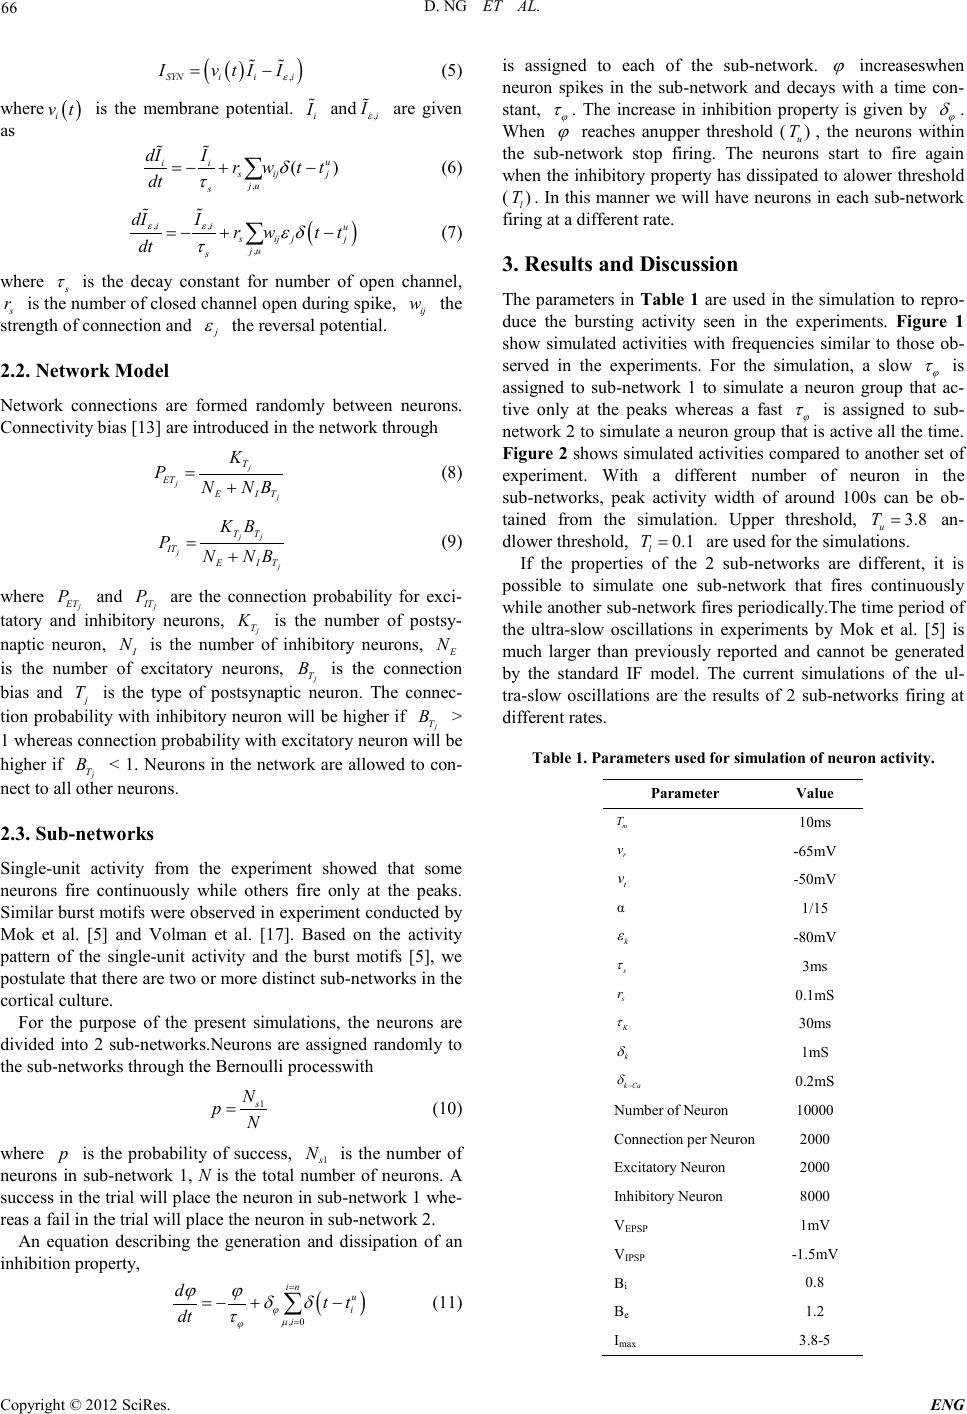 D. NG ET AL. Copyright © 2012 SciRes. ENG 66 ( ) ( ) ,SYNiii IvtI I ε = − (5) whe re ( ) i vt is the membrane potential. i I and ,i I ε are given as , () u ii s ijj ju s dII rw tt dt δ τ =−+ − ∑ (6) ( ) ,, , ii u sijjj ju s dII r wtt dt εε εδ τ =−+ − ∑ (7) where s τ is the decay constant for number of open channel, s r is the number of closed channel open during spike, ij w the strength of connection and j ε the reversal potential. 2.2. Network Model Network connections are formed randomly between neurons. Connectivity bias [13] are introduced in the network through j j j T ET E IT K PN NB =+ (8) j j j j TT IT E IT K PNN B B =+ (9) where j ET P and j IT P are the connection probability for exci- tatory and inhibitory neurons, j T K is the number of postsy- naptic neuron, I N is the number of inhibitory neurons, E N is the number of excitatory neurons, j T B is the connection bias and j T is the type of postsynaptic neuron. The connec- tion probability with inhibitory neuron will be higher if j T B > 1 whereas connection probability with excitatory neuron will be higher if j T B < 1. Neuron s in the network are allowed to con- nect to all other neurons. 2.3. Sub-networks Single-unit activity from the experiment showed that some neurons fire continuously while others fire only at the peaks. Similar burst motifs were observed in experiment conducted by Mok et al. [5] and Volman et al. [17]. Based on the activity pattern of the single-unit activity and the burst motifs [5], we post ulate t hat th ere are t wo or more di sti nct sub-networks in the cortical culture. For the purpose of the present simulations, the neurons are divided into 2 sub-networks.Neurons are assigned randomly to the sub-networks through the Bernoulli processwith 1s N pN = (10) whe re p is the probability of success, 1s N is the number of neurons in sub-network 1, N is the total number of neurons. A success in the trial will place the neuron in sub-network 1 whe- reas a fail i n the trial will place the neuron in sub-network 2. An equation describing the generation and dissipation of an inhibition property, ( ) ,0 in u i i dtt dt ϕ µ ϕ ϕϕ δδ τ = = =−+ − ∑ (11) is assigned to each of the sub-network. ϕ increaseswhen neuron spikes in the sub-network and decays with a time con- stant, ϕ τ . The increase in inhibition property is given by ϕ δ . When ϕ reaches anupper threshold ( ) u T , the neurons within the sub-network stop firing. The neurons start to fire again when the inhibitory property has dissipated to alower threshold ( ) l T . In this manner we will have neurons in each sub-network firing at a different r ate. 3. Results and Discussion The parameters in Ta ble 1 are used in the simulation to repro- duce the bursting activity seen in the experiments. Figure 1 show simulated activities with frequencies similar to those ob- served in the experiments. For the simulation, a slow ϕ τ is assigned to sub-network 1 to simulate a neuron group that ac- tive only at the peaks whereas a fast ϕ τ is assigned to sub- network 2 to simulate a neuron group that is active all the time. Figure 2 s hows simulat ed activit ies compared to anot her set of experiment. With a different number of neuron in the sub-networks, peak activity width of around 100s can be ob- tained from the simulation. Upper threshold, 3.8 u T= an- dlower threshold, 0.1 l T= are used for the simulations. If the properties of the 2 sub-networks are different, it is possible to simulate one sub-network that fires continuously while another sub-network fires periodically.The time period of the ultra-slow oscillations in experiments by Mok et al. [5] is much larger than previously reported and cannot be generated by the standard IF model. The current simulations of the ul- tra-slow oscillations are the results of 2 sub-networks firing at different rates. Tabl e 1. Par amet e rs use d f or s imu lation of neu ron activity. Parameter Value m T 10ms r v -65mV t v -50mV α 1/15 k ε -80mV s τ 3ms s r 0.1mS K τ 30ms k δ 1mS k Ca δ − 0.2mS Number of Neuron 10000 Con ne ctio n pe r Neur o n 2000 Excitatory Neuron 2000 Inhibitory Neuron 8000 VEPSP 1mV VIPSP -1.5mV Bi 0.8 Be 1.2 Imax 3.8-5  D. NG ET AL. Copyright © 2012 SciRes. E NG 67 Fig ure 1. Simulation of activity generated with parameters: ϕ δ = 0.07, upper threshold, u T = 3.8, lower threshold, l T = 0.1, sub- network 1: number of neuron = 2000, φ τ = 30000, s ub-network 2: number of neurons = 8000, φ τ = 1000 compared with experimen- tal results. The time bin for spikes is 10ms. Fig ure 2. Simulation of activity generated with parameters: ϕ δ = 0.07, upper threshold, u T = 3.8, lower threshold, l T = 0.1, sub- network 1: number of neuron = 3000, φ τ = 30000, sub-network 2: number of neurons = 7000, φ τ = 1000 compared with experimen- tal results. The time bin for spikes is 10ms. It is likely that these ultra-slow oscillations are controlled by biochemical processes and/or network structures in the cortical culture. Fu rther experi ments are n eed ed t o bett er unders tan d the underlying biochemical processes that cause theseultra-slow oscillations. REFERENCES [1] A. Husain, W.O. Tatum and P.W. Kaplan.Handbook of EEG interpretation.Demos M ed ical, 2008. [2] M. Steriade, A. Nuñez and F. Amzica. “A novel slow (< 1 hz) oscillation of neocortical neurons in vivo: depolarizing and hyperpolarizing components” J. Neu ro s ci enc e, vol 13, issu e 8 pp. 3252–32 65, Aug 1993 . [3] F. Amzica and M. Steriade. “Short- and long-range neuronal synchronization of the slow (< 1 hz) cortical oscillation”, J. of Neurophysiology, vol. 73, issue 1, pp. 20–38, Jan 1995. [4] D. Contreras ,I. Timofeev and M.Steriade.“Mechanisms of long-lasting hyperpolarizations underlying slowsleep oscillations in cat corticothalamicnetworks”J. of Physiology, vol. 494, pp 251-264, Jul 1996. [5] S. Y. Mok, Z. Nadasdy, Y.M. Lim, S.Y. Goh. “Ultra-slow oscil- lations in cortical networks in vitro”, Neuroscience, vol. 206, pp 17-24, Mar 2012. [6] M . Pent ton en, N. Nurmin en, R. Miettinen, J. Sirviö, D. A. Henze, J. Csicsvári, and G. Buzsáki. “Ultra-slow oscillation (0.025 hz) triggers hippocampal afterdischarges in wistar rats” Ne u ro s- cience, vol 94, issue 3, pp. 735–743, Oct 1999. [7] S. Vanhatalo, J. M. Palva, M. D. Holmes, J. W. Miller JW, J. VoipioandK. Kaila. “Infraslow oscillations modulate excitability and interi cta l epil ept ic act ivit y in th e human cortex du rin g sleep ” Proc.of the National Academy of Sciences, vol. 101, pp. 5053-5057, Apr 2004 [8] P. J. Drew, J. H. Duyn,E.Golanov and D.Kleinfeld“Finding coherence in spontaneous oscillations”Nature Neuroscience vol. 11, pp 991–993, 2008. [9] N. B runel and V.Hakim. “Fast global osc illati ons in networks of integrate-and-fire neurons with low firing rates”, Neural Com- putation, vol. 11, issue 7, pp. 1621 –1671, Oct 1999. [10] X. J. Wang and G. Buzsáki.“Gamma oscillation by synaptic inhibition in a hippocampal interneuronal network model”, J. Neuroscience, vol. 16, issue 20, pp. 6402–6413, Oct 1996. [11] N. Brunel. “Dynamics of sparsely connected networks of e xcita- tory and inhibitory spiking neurons”, J Computational Neuros- cience, vol. 8, issue 3, pp. 183–20 8, Jun 2000. [12] D. Hansel and G. Mato. “Asynchronous states and the emergence of synchrony in large networks of interacting excitatory and in- hib itory neurons”, Neural Computation, vol. 15, issue 1, pp. 1–56, Jan 2003. [13] P. E. Latham, B. J. Richmond, P. G. Nelson, and S. Niren- berg.“Intrinsic dynamics in neuronal networks.I.Theory.”J. of Neurophysiology, vol 83 , issue 2, pp. 808–827, Feb 200 0. [14] P.E. Latham, B.J. Richmond, S. Nirenberg, and P.G. Nel- son.“Intrinsic dynamics in neuronal networks. II. Experiment” J. of Neurophysi ology, vol. 83, issue 2, pp. 828–835, Feb 2000. [15] P. Kudela, P.J. Franaszczuk, and G.K. Bergey.“Changing excita- tion and inhibition in simulated neural networks: effects on in- duced bursting behaviour”, Biological Cybernetic, vol. 88, issue 4, pp. 2 76–285, Apr 2003. [16] M. Tsodyks, A. Uziel, and H. Markram.“Synchrony generation in recurrent networks with frequency-depen dent synapses”, J. o f Neuroscience, vol. 20, RC50, pp 1-5, Ja n 2 000. [17] V. Volman, I. Baruchi, and E. Ben-Jacob.“Manifestation of function-follow-form in cultured neuronal networks”, Physical Biology, vol.2, issue 2, pp. 98–110, Ju n 20 05. [18] L.R Petzold and U.M. Ascher.Computer methods for ordinary differential equations and differential-algebraic equations.SIAM, 1998. |