Paper Menu >>
Journal Menu >>
 Engineering, 2012, 5, 57-60 doi:10.4236/eng.2012.410B015 Published Online October 2012 (http://www.SciRP.org/journal/eng) Copyright © 2012 SciRes. ENG Evaluation of Hepatic Cystic Echinococcosis’ CT image in Xinjiang Uygur Autonomous Region based on Kolmogorov Complexity Model* Jingjing Zhou1, Murat Hamit1, Abdugheni Kutluk1, Chuanbo Yan1, Li Li1, Jianjun Chen1, Yanting Hu1, Dewei Kong2, Weikang Yuan1 1College of Medical Engineeri ng Technology, Xinji ang Medical Universi ty, Urumqi, China 2Department of Radiology, The First Affiliated Hospital, Xinjiang Medical University, Urumqi, China Email: Murat.hamit@xjmu.edu.cn, murat.h@163.com Received 2012 ABSTRACT Designing and developing computer-assisted image processing techniques to help doctors improve their diagnosis has received con- siderable interests over the past years. In this paper, we used the kolmogorov complexity model to analyze the CT images of the health y liver and multip le dau ghter hydatid cysts. Before t he co mplexit y characteri stic cal culati ng, th e image prep rocessin g methods had been used for image stand ard izati on . Fro m the ko lmogoro v complexit y mod el, co mplexit y char act erist ic were cal cul ated in order to quantify the complexity, between healthy liver and multiple daughter hydatid cysts. Then we use statistical method to analyze the complexity characteristic of those two types of images. Our preliminary results show that the complexity characteristic has statisti- cally significant (p<0.05) to analyze these two types CT images, between the healthy liver and the multiple daughter hydatid cysts. Furthermore, the result leads us to the conclusion that the kolmogorov complexity model could use for analyze the hydatid disease and will also extend the analysis the other lesions of liver. Keywords: Hepatic Cystic Echinococcosis; CT image; Kolmogorov Complexity 1. Introduction Cystic echinococcosis (CE), also known as hydatid disease, is an infection of larval stage animal tapeworm, Echinococcus, has a wide geographical distribution [1]. The liver is the most common site of the echinococcal cyst of the pastoral strains (> 65%) [2]. The greatest prevalence of cystic echinococcosis in human and animal hosts is found in countries of the temperate zones, including southern South America, the entire Medi- terranean littoral, southern and central parts of the former So- viet Union, central Asia, China, Australia, and parts of Afri- ca[3]. In China, human CE has been recorded in 22 Provinces and Administrative Regions, with a particularly high endemic level over large areas of north-western provinces [4]. The Xin- jiang Uygur Autonomous Region, multi-ethnic province in northwestern China, is one of the most important foci of human CE in the world [5]. The definitive diagnosis for most cases of CE in man is by physical imaging methods, such as radiology, ultrasonography, computed axial tomography, and magnetic resonance imaging. The ability of CT to reveal hepatic lesions in experiment al and clinical set tings has been well documented and has high accuracy in the diagnosis of complications in CE of the liver [6]. Designing and developing computer-assisted image processing techniques to help doctors improve their di- agnosis has received considerable inter es ts in recent years. Medical imaging is clearly very important to extract the maximum possible information from any image obtained. Mul- tivesicular cysts manifest as well-defined fluid collections in a honeycomb pattern, with multiple septa representing the walls of the d aughter cysts. When dau ghter cysts are sep arated b y the hydatid matrix (a materi al with mixed echogen icity), th ey show a “wheel spoke” pattern [7]. The CT image of multiple daugh- ter hydatid cysts showed a multiloculated appearance with the density of fluid in the daughter cysts lower than the density of fluid in the mother cyst. Fig. 1 shows typical a large cystic le- sion, which included many small round shaped cystic lesions. We propose to focuse on using Kolmogorov Complexity model for calculate the complexity of the CT image, both the healthy liver and the multiple daughter hydatid cysts. The evalu ation of the complexity of an observed object is an old but outstanding problem. The notion of Kolmogorov com- plexity was defined independently by G. Chaitin, R. Solomono, and A. Kolmogorov [8]. Kolmogorov proposed a complexity measure of a specified bi nary sequence, in which the complex- ity is given by the length of the shortest algorighm which can produce this sequence [10]. This definition of complexity is usually called Kolmogorov Complexity (KC). Kasper and Schuster [11] proposed a computationally simple measure of the algo rit hmic co mplexi t y which was anal yzed mathemat ically by Lempel and Ziv [12]. The complexity of a finite string from the Kaspar-Schuster’s method can be considered as a realiza- tion of the Kolmogorov Complexity. Kolmogorov Complexity and other complexity measures have been applied in many fields, such as time series analysis [13], [14], handwritten cha- racters recognition [15], image compression [9] and statistic complexity [16]. These applications have shown that the com- *This work was supported by the National Natural Science Founda tion of China, Xinjiang, 30960097 and 81160182.  J. J. ZHOU ET AL. Copyright © 2012 SciRes. ENG 58 plexity measu re is a u seful tool for signal and image processing. To author's knowledge, the present study of kolmogorov com- plexity has not been applied in the hepatic cystic echinococco- sis. Based on the above observations, we proposed use the kol- mogorov complexity model to analyze the CT image of h ealth y liver and multiple daughter hydatid cysts (presented in Figure 1). For the purpose of complexity analysis, the original image needs to be preprocessed. Our approach first preprocessed the image, including color transformation, normalize the scale, remove noise and enhance the contrast, shown in Figure 1. Then, followed by calculate of the complexity characteristic. From the kolmogorov complexity model, complexity characte- ristic were calculated in order to quantify the complexity, be- tween healthy liver and multiple daughter hydatid cysts, and the complexity was analyzed by SPSS, the statistical analysis soft- ware. Furthermore, we discussed the usefulness of the proposed complexity model for analyzing a series of healthy liver and multiple daughter hydatid cysts. 2. Methodology 2.1. Image Acquisition Abdominal CT images, from both patients and healthy controls, were acquired at First Affiliated Hospital, Xinjiang Medical University of China, using a CT scanner. Digitized CT images of the abdomen, used as input for this study, were grouped into two classes: (a) healthy liver and (b) multiple daughter hydatid cysts. Furthermore, a number of 200 images provided for the experiment, 100 images of healthy liver and 100 images of multiple daug ht e r hydat id cysts . 2.2. Image Preprocessing A captured image contains not only the information of useful but also some noise and the variation caused by the rotation and translation. So, the image cannot be used directly. In order to keep the useful information of the CT images under different conditions, image preprocessing approaches were used to pre- process images before the analysis algorithm was applied. For the purpose of complexity analysis, the original image needs to be preprocessed to color transformation, normalize the scale, remove no ise and enhance the contrast, red uce the influence of the factors mentioned above. The result of image preprocessing was shown in Figure 2 and Figure 3. Step 1 Color transformation: Convert RGB image to the grayscale intensity image, by eliminating the hue and saturation informa- tion while retaining the luminance. The original image is in RGB color space. That is, the color image is formed by the combination of three digital images of the same region shot through red, green, and blue filters. This color space is fine for digitization, but transformation to another color space may be advantageous for subsequent steps in the analysis [17]. Figure 1. Description of the proposed model for complexity analysis of CT image for both healthy liver and multiple daughter hydati d cy s ts. Figure 2. C T imag e of healthy liver. (a) A n ori g i nal image. (b) The image af ter color transformation. (c) The image a f ter normalized the scale. (d)The image after applied me d i a n filter. (e) The image after application the CLAHE enhancing. Figure 3. CT image of multiple daughter hyda tid cyst. (a) An original image. (b) The imag e after color transformation. (c) The imag e after normalized the scale. (d)The image after applied me dian filter. (e) The image a ft er applic ation the CLAHE enhancing. 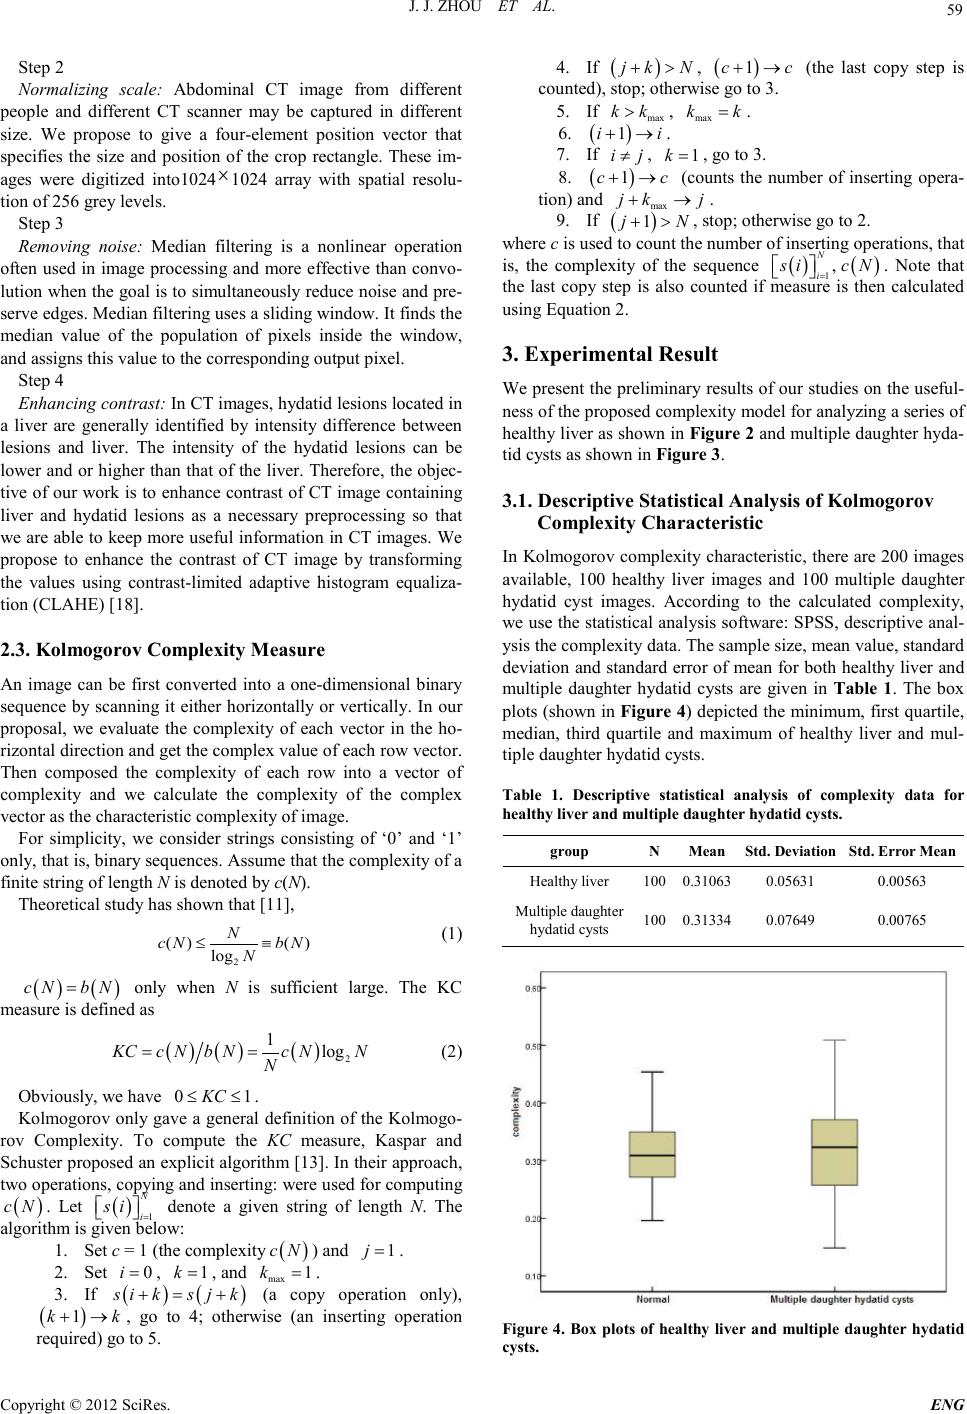 J. J. ZHOU ET AL. Copyright © 2012 SciRes. E NG 59 Step 2 Normalizing scale: Abdominal CT image from different people and different CT scanner may be captured in different size. We propose to give a four-element position vector that specifies the size and position of the crop rectangle. These im- ages were digitized into1024 × 1024 array with spatial resolu- tion of 256 grey levels. Step 3 Removing noise: Median filtering is a nonlinear operation often used in image processing and more effective than convo- lution when the goal is to simultaneously reduce noise and pre- serve edges. Median filtering uses a sliding window. It finds the median value of the population of pixels inside the window, and assigns this value to the corresponding output pixel. Step 4 Enhancing contrast: In CT images, hydatid lesions located in a liver are generally identified by intensity difference between lesions and liver. The intensity of the hydatid lesions can be lower and or higher than that of the liver. Therefore, the objec- tive of our work is to enhance contrast of CT image containing liver and hydatid lesions as a necessary preprocessing so that we are able t o keep more use ful informati on in CT images. We propose to enhance the contrast of CT image by transforming the values using contrast-limited adaptive histogram equaliza- tion (CLAHE) [18]. 2.3. Kolmogorov Complex i ty Measu re An image can be first converted into a one-dimensional binary sequence by scanning it either horizontally or vertically. In our proposal, we evaluate the complexity of each vector in the ho- rizon tal di recti on and get th e complex valu e of each r ow vector . Then composed the complexity of each row into a vector of complexity and we calculate the complexity of the complex vector as the charact er istic co mplexity of image. For simplicity, we consider strings consisting of ‘0’ and ‘1’ only, that is, binary sequences. Assume that the complexity of a finite string of length N is de noted by c(N). Theoretical study has shown that [11], )( log )( 2 Nb N N Nc ≡≤ (1) ( )( ) cN bN= only when N is sufficient large. The KC measure is defined as ( )( )( ) 2 1logKCcN bNcNN N = = (2) Obviously, we have 01KC≤≤ . Kolmogorov only gave a general definition of the Kolmogo- rov Complexity. To compute the KC measure, Kaspar and Schuster proposed an explicit algorithm [13]. In their approach, two operations, copying and inserting: were used for computing ( ) cN . Let ( ) 1 N i si = denote a given string of length N. The algorithm is given below: 1. Set c = 1 (the compl exi ty ( ) cN ) and 1j= . 2. Set 0i= , 1 k =, and max 1k= . 3. If () () siks jk+= + (a copy operation only), ( ) 1kk+→ , go to 4; otherwise (an inserting operation required) go to 5. 4. If ( ) jk N+> , ( ) 1cc+→ (the last copy step is counted), stop; otherwise go to 3. 5. If max kk> , max kk= . 6. ( ) 1ii+→ . 7. If ij≠ , 1k=, go to 3. 8. ( ) 1cc+→ (counts the number of inserting opera- tion) and max jk j+→ . 9. If ( ) 1 jN +>, stop; otherwise go to 2. where c is used to count the number of inserting operations, that is, the complexity of the sequence ( )() 1 , N i si cN = . Note that the last copy step is also counted if measure is then calculated using Equation 2. 3. Experimental Result We present the preliminary results of our studies on the useful- ness of the proposed complexity model for analyzing a series of healthy liver as shown in Figure 2 and multiple daughter hyda- tid cysts as shown in Figure 3. 3.1. Descriptive Statistical Analysis of Kolmogorov Complexity Characteristic In Kolmogorov complexit y chara cteristic, ther e are 200 images available, 100 healthy liver images and 100 multiple daughter hydatid cyst images. According to the calculated complexity, we use the statistical analysis software: SP SS, descri ptive anal- ysis the complexity dat a. The sample size, mean value, standard deviation and standard error of mean for both healthy liver and multiple daughter hydatid cysts are given in Table 1. The box plots (shown in Figure 4) depicted th e minimum, first quartile, median, third quartile and maximum of healthy liver and mul- tiple daughter hydatid cysts. Table 1. Descriptive statistical analysis of complexity data for healthy liver and multiple daughter hydatid cysts. group N Mean Std. Deviation Std. Error Mea n Healthy liver 100 0.31063 0.05631 0.00563 Multiple daughter hydatid cysts 100 0.31334 0.07649 0.00765 Figure 4. Box plots of healthy liver and multiple daughter hydatid cysts. 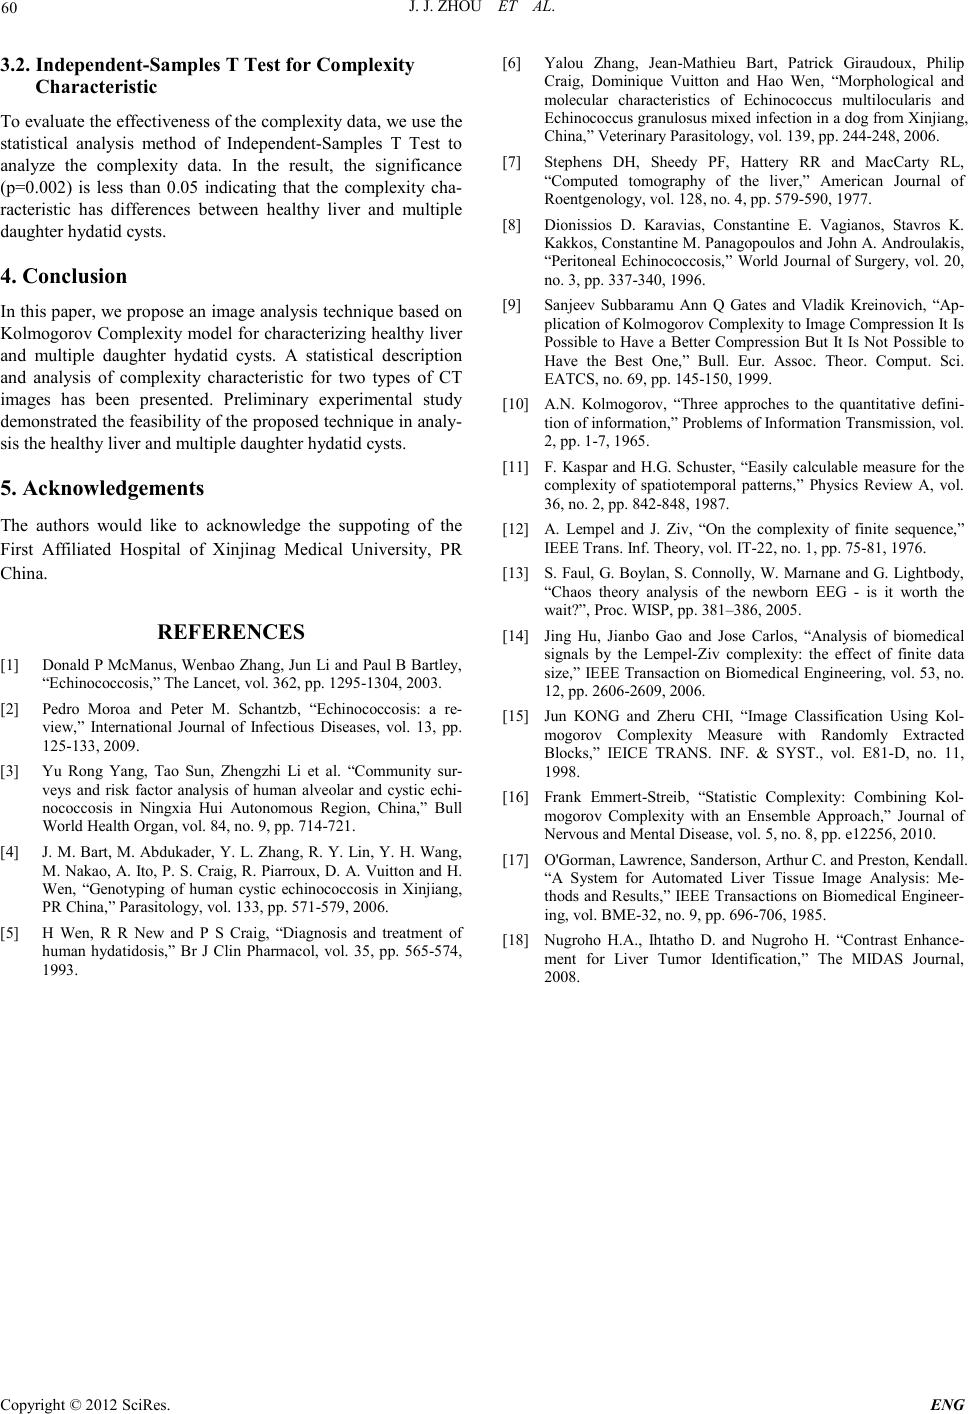 J. J. ZHOU ET AL. Copyright © 2012 SciRes. ENG 60 3.2. Independent-Samples T Test f or Complexity Characteristic To evaluate t he effecti venes s o f the co mplexit y data, we use th e statistical analysis method of Independent-Samples T Test to analyze the complexity data. In the result, the significance (p=0.002) is less than 0.05 indicating that the complexity cha- racteristic has differences between healthy liver and multiple daughter hydatid cysts. 4. Conclusion In this paper, we propose an image analysis technique based on Kolmogorov Complexity model for characterizing healthy liver and multiple daughter hydatid cysts. A statistical description and analysis of complexity characteristic for two types of CT images has been presented. Preliminary experimental study demonstrated the feasibility of the proposed technique in analy- sis the healthy liver and multiple daughter hydatid cysts. 5. Acknowledgements The authors would like to acknowledge the suppoting of the First Affiliated Hospital of Xinjinag Medical University, PR China. REFERENCES [1] Donald P McManus, Wenbao Zhang, Jun Li and Paul B Bartley, “Echinococcosis,” The Lancet, vol. 362, pp. 1295-1304, 2003. [2] Pedro Moroa and Peter M. Schantzb, “Echinococcosis: a re- view,” International Journal of Infectious Diseases, vol. 13, pp. 125-133, 2009. [3] Yu Rong Yang, Tao Sun, Zhengzhi Li et al. “Community sur- veys and risk factor analysis of human alveolar and cystic echi- nococcosis in Ningxia Hui Autonomous Region, China,” Bull World Health Organ, vol. 84, no. 9, pp. 714-721. [4] J. M. Bart, M. Abdukader, Y. L. Zhang, R. Y. Lin, Y. H. Wang, M. Nakao, A. Ito, P. S. Craig, R. Piarroux, D. A. Vuitton and H. Wen, “Genotyping of human cystic echinococcosis in Xinjiang, PR China ,” Para si tology, vol. 133, pp. 571-579, 200 6. [5] H Wen, R R New and P S Craig, “Diagnosis and treatment of human hydatidosis,” Br J Clin Pharmacol, vol. 35, pp. 565-574, 1993. [6] Yalou Zhang, Jean-Mathieu Bart, Patrick Giraudoux, Philip Craig, Dominique Vuitton and Hao Wen, “Morphological and molecular characteristics of Echinococcus multilocularis and Echin ococ cus gra nu losu s mixed infect ion in a dog fr om Xinj i ang, China,” Veterinary Para sitology, vol. 139, pp. 244-248, 2006. [7] Stephens DH, Sheedy PF, Hattery RR and MacCarty RL, “Computed tomography of the liver,” American Journal of Roentgenology, vol. 128, no. 4, pp. 579-590, 1977. [8] Dionissios D. Karavias, Constantine E. Vagianos, Stavros K. Kakkos, Constantine M. Panagopoulos and John A. Androulakis, “Peritoneal Echinococcosis,” World Journal of Surgery, vol. 20, no. 3, p p . 3 37-340, 1996. [9] Sanjeev Subbaramu Ann Q Gates and Vladik Kreinovich, “Ap- plic ation of Kolmogorov C omplexit y to Image Comp ression It Is Possible to Have a Better Compression But It Is Not Possible to Have the Best One,” Bull. Eur. Assoc. Theor. Comput. Sci. EATCS, no. 69, pp. 145-150, 1999. [10] A.N. Kolmogorov, “Three approches to the quantitative defini- tion of in forma tion ,” Pr oblems of Inf ormat i on Transmi ssi on, vol. 2, pp. 1-7, 1965. [11] F. Kaspar and H.G. Schuster, “Easily calculable measure for the complexity of spatiotemporal patterns,” Physics Review A, vol. 36, no . 2, p p. 8 42-848, 1987. [12] A. Lempel and J. Ziv, “On the complexity of finite sequence,” IEEE Trans. Inf. Theory, vol. IT-22, no. 1, pp. 75-81, 1976. [13] S. Faul, G. Boylan, S. Connolly, W. Marnane and G. Lightbody, “Chaos theory analysis of the newborn EEG - is it worth the wait?”, Proc. WISP, pp. 381–386, 2005. [14] Jing Hu, Jianbo Gao and Jose Carlos, “Analysis of biomedical signals by the Lempel-Ziv complexity: the effect of finite data size,” IEEE Tran saction on Biomed ical Engin eering, vol. 53, no. 12, pp. 2606-2609 , 2006. [15] Jun KONG and Zheru CHI, “Image Classification Using Kol- mogorov Complexity Measure with Randomly Extracted Blocks,” IEICE TRANS. INF. & SYST., vol. E81-D, no. 11, 1998. [16] Frank Emmert-Streib, “Statistic Complexity: Combining Kol- mogorov Complexity with an Ensemble Approach,” Journal of Nervo us and Ment al Disea s e, vol. 5, no. 8 , pp. e12256, 2010. [17] O'Gorman, Lawrence, Sanderson, Arthur C. and Preston, Kendall. “A System for Automated Liver Tissue Image Analysis: Me- thods and Resu lts,” IEEE Transa ctions on Biomed ical Engineer- ing, vol. BME-32, no. 9, pp. 696-706, 1985. [18] Nugroho H.A., Ihtatho D. and Nugroho H. “Contrast Enhance- ment for Liver Tumor Identification,” The MIDAS Journal, 2008. |