Paper Menu >>
Journal Menu >>
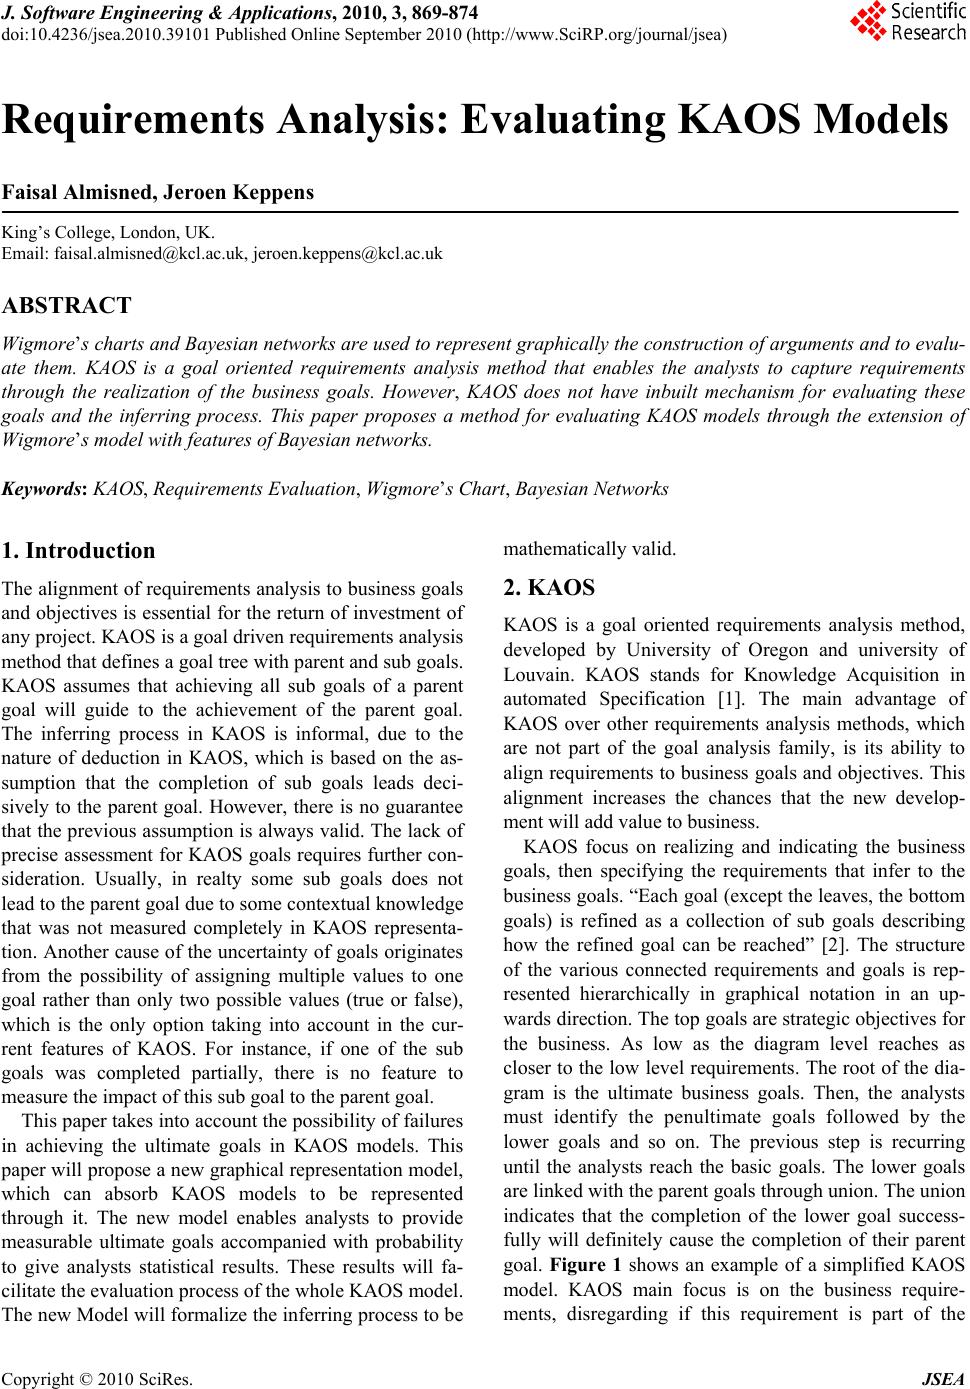 J. Software Engineering & Applications, 2010, 3, 869-874 doi:10.4236/jsea.2010.39101 Published Online September 2010 (http://www.SciRP.org/journal/jsea) Copyright © 2010 SciRes. JSEA 869 Requirements Analysis: Evaluating KAOS Models Faisal Almisned, Jeroen Keppens King’s College, London, UK. Email: faisal.almisned@kcl.ac.uk, jeroen.keppens@kcl.ac.uk ABSTRACT Wigmore’s charts and Bayesian networks are used to represent graphically the construction of arguments and to evalu- ate them. KAOS is a goal oriented requirements analysis method that enables the analysts to capture requirements through the realization of the business goals. However, KAOS does not have inbuilt mechanism for evaluating these goals and the inferring process. This paper proposes a method for evaluating KAOS models through the extension of Wigmore’s model with features of Bayesian networks. Keywords: KAOS, Requirements Evaluation , Wigmore’s Chart, Bayesian Networks 1. Introduction The alignment of requirements analysis to business goals and objectives is essential for th e return of investment of any project. KAOS is a goal driven requirements analysis method that defines a goal tree with parent and sub goals. KAOS assumes that achieving all sub goals of a parent goal will guide to the achievement of the parent goal. The inferring process in KAOS is informal, due to the nature of deduction in KAOS, which is based on the as- sumption that the completion of sub goals leads deci- sively to the parent goal. However, there is no guarantee that the previous assumption is always valid. The lack of precise assessment for KAOS goals requires further con- sideration. Usually, in realty some sub goals does not lead to the parent goal due to some contextual knowledge that was not measured completely in KAOS representa- tion. Another cause of the uncertainty of goals originates from the possibility of assigning multiple values to one goal rather than only two possible values (true or false), which is the only option taking into account in the cur- rent features of KAOS. For instance, if one of the sub goals was completed partially, there is no feature to measure the impact of this sub goal to the parent goal. This paper takes into account the possibility of failures in achieving the ultimate goals in KAOS models. This paper will propose a new graphical representatio n model, which can absorb KAOS models to be represented through it. The new model enables analysts to provide measurable ultimate goals accompanied with probability to give analysts statistical results. These results will fa- cilitate the evaluation process of the whole KAOS model. The new Model will formalize the inferring process to be mathematically valid. 2. KAOS KAOS is a goal oriented requirements analysis method, developed by University of Oregon and university of Louvain. KAOS stands for Knowledge Acquisition in automated Specification [1]. The main advantage of KAOS over other requirements analysis methods, which are not part of the goal analysis family, is its ability to align requirements to business goals and objectives. This alignment increases the chances that the new develop- ment will add value to business. KAOS focus on realizing and indicating the business goals, then specifying the requirements that infer to the business goals. “Each goal (except the leaves, the bottom goals) is refined as a collection of sub goals describing how the refined goal can be reached” [2]. The structure of the various connected requirements and goals is rep- resented hierarchically in graphical notation in an up- wards direction. The top go als are strategic objectives for the business. As low as the diagram level reaches as closer to the low level requirements. The root of the dia- gram is the ultimate business goals. Then, the analysts must identify the penultimate goals followed by the lower goals and so on. The previous step is recurring until the analysts reach the basic goals. The lower goals are linked with the parent goals through union. The union indicates that the completion of the lower goal success- fully will definitely cause the completion of their parent goal. Figure 1 shows an example of a simplified KAOS model. KAOS main focus is on the business require- ments, disregarding if this requirement is part of the  Requirements Analysis: Evaluating KAOS Models Copyright © 2010 SciRes. JSEA 870 Figure 1. An example of KAOS. computer system requirements or not. Each goal is ac- companied with obstacles and the stakeholders involving in this goal. A limitation of KAOS is the lack of any in- ference evaluation capabilities. The achievement of sub goals does not imply the achievement of their parent goals in all cases. The next section presents a review of two candidate approaches to solve this issue. 3. Related Work In this section, two graphical representation models will be studied as possible methods to evaluate KOAS models. The features of these approaches will be examined to check the suitability of th em to enclose KAOS models. 3.1. Bayesian Networks Bayesian Network (BNs) is a general statistical tool that can be applied to various applications. BNs are helpful to assess the weight or the influences of premises, to deter- mine the strong inference links. [3] Bayesian Network is a graphical representation tool using symbols, numbers and arrows to enable analysts to reason logically far from doubt. It is an appropriate tool to gather and analyze evi- dences, in order to produce strong arguments. There are two components to construct BNs. First, nodes are rep- resenting the noticed evidential facts, propositions and variables. Second, arrow that connects between various nodes in the diagram. These arrows indicate the depend- ency probabilities. The value or the weight of each node is affected by the value of the nodes influencing this node and linked with it. The final conclusion of the net- work is affected by the probabilities of each proposition and inference. (See Figure 2 ) Bayesian Network is a method to reason logically and rationally using probabilities. Th e simplest way to under- stand the goals of BNs is to think of a circumstance you need to “model a situation in which causality plays a role but where our understanding of what is actually going on is incomplete, so we need to describe things probab ilisti- cally” [4]. There, BNs allow analysts to compute the overall probability of the final conclusion . By, computing the probability of propositions connected directly, then the higher connections, then the higher and so on. The benefits from BNs are obvious in the prediction of out- comes in doubtful cases. Also, the benefits are apparent in the detection of the causes of certain results. The in- fluencing relations are not decisive but probabilistic; the precise probability is assigned for each node and relation. BNs are a Directed Acyclic Graph. BNs are constructed from nodes and directed links. Arrows that connect vari- ous propositions are accompanied with the probabilistic information required to define the prob ability d istribu tion all over the network. To achieve that, initial probability value should be assigned to the nodes with no earlier nodes. Then, calculate the provisional probability for the Figure 2. Simple bayesian network. 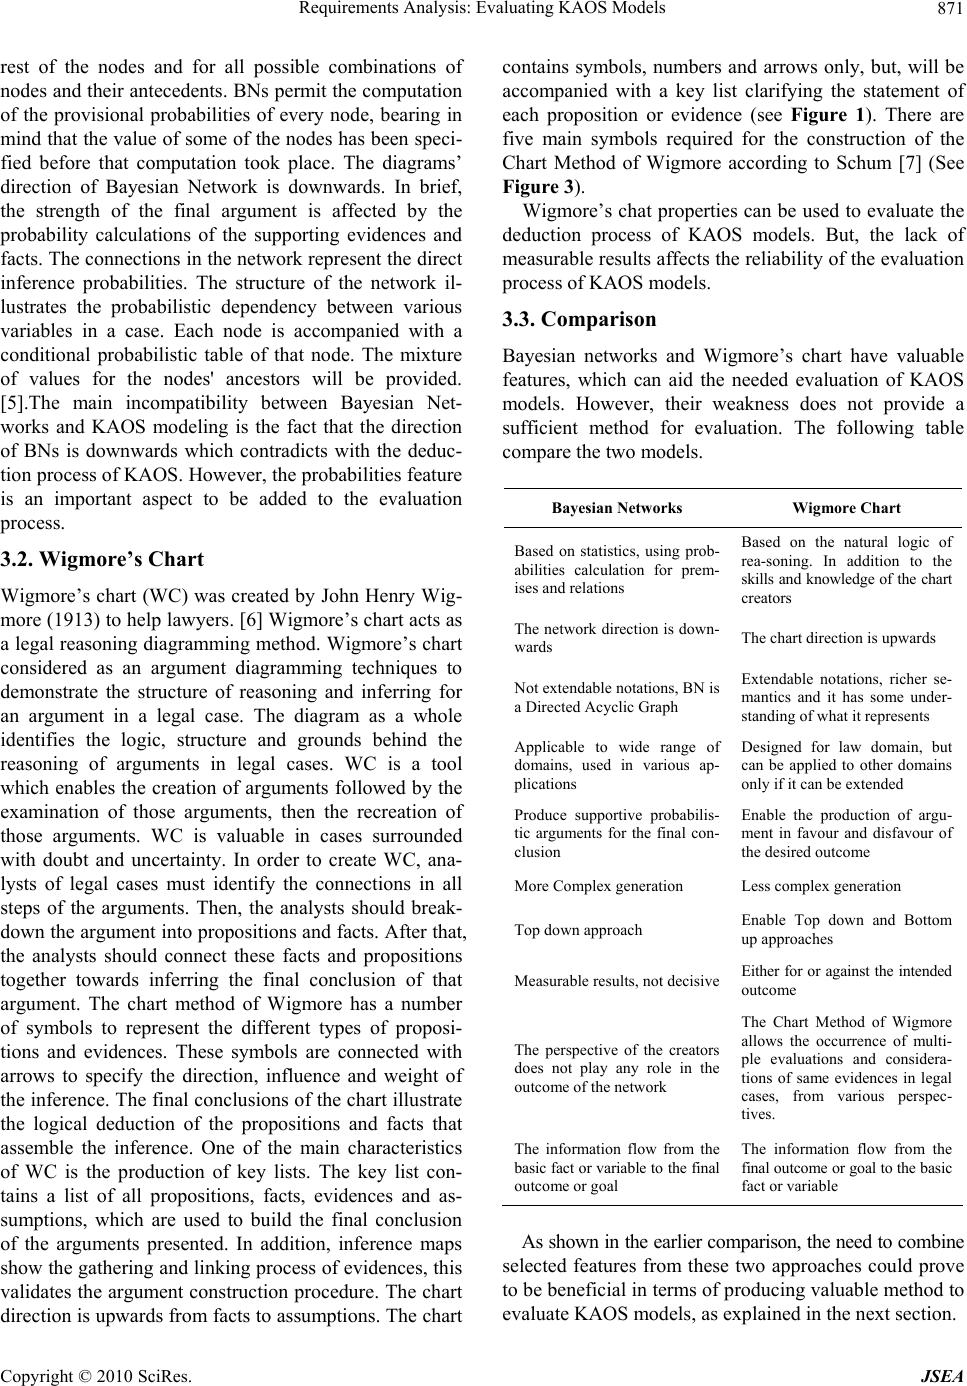 Requirements Analysis: Evaluating KAOS Models Copyright © 2010 SciRes. JSEA 871 rest of the nodes and for all possible combinations of nodes and their antecedents. BNs permit the computation of the provisional probabilities of every node, bearing in mind that the value of some of the nodes has been speci- fied before that computation took place. The diagrams’ direction of Bayesian Network is downwards. In brief, the strength of the final argument is affected by the probability calculations of the supporting evidences and facts. The connections in the network represent the direct inference probabilities. The structure of the network il- lustrates the probabilistic dependency between various variables in a case. Each node is accompanied with a conditional probabilistic table of that node. The mixture of values for the nodes' ancestors will be provided. [5].The main incompatibility between Bayesian Net- works and KAOS modeling is the fact that the direction of BNs is downwards which contradicts with the deduc- tion process of KAOS. However, the probabilities feature is an important aspect to be added to the evaluation process. 3.2. Wigmore’s Chart Wigmore’s chart (WC) was created by John H enry Wig- more (1913) to help lawyers. [6] Wigmore’s chart acts as a legal reasoning diagramming method. Wigmore’s chart considered as an argument diagramming techniques to demonstrate the structure of reasoning and inferring for an argument in a legal case. The diagram as a whole identifies the logic, structure and grounds behind the reasoning of arguments in legal cases. WC is a tool which enables the creation of arguments followed by the examination of those arguments, then the recreation of those arguments. WC is valuable in cases surrounded with doubt and uncertainty. In order to create WC, ana- lysts of legal cases must identify the connections in all steps of the arguments. Then, the analysts should break- down the argument in to propositions an d facts. After that, the analysts should connect these facts and propositions together towards inferring the final conclusion of that argument. The chart method of Wigmore has a number of symbols to represent the different types of proposi- tions and evidences. These symbols are connected with arrows to specify the direction, influence and weight of the inference. The final conclusions of the chart illu strate the logical deduction of the propositions and facts that assemble the inference. One of the main characteristics of WC is the production of key lists. The key list con- tains a list of all propositions, facts, evidences and as- sumptions, which are used to build the final conclusion of the arguments presented. In addition, inference maps show the gathering and lin king process of evidences, this validates the argument construction procedure. The chart direction is upwards from facts to assumptions. The chart contains symbols, numbers and arrows only, but, will be accompanied with a key list clarifying the statement of each proposition or evidence (see Figure 1). There are five main symbols required for the construction of the Chart Method of Wigmore according to Schum [7] (See Figure 3). Wigmore’s chat properties can be used to evaluate the deduction process of KAOS models. But, the lack of measurable results affects the reliability o f the evaluation process of KAOS models. 3.3. Comparison Bayesian networks and Wigmore’s chart have valuable features, which can aid the needed evaluation of KAOS models. However, their weakness does not provide a sufficient method for evaluation. The following table compare the two models. Bayesian Networks Wigmore Chart Based on statistics, using prob- abilities calculation for prem- ises and relations Based on the natural logic of rea-soning. In addition to the skills and knowledge of the chart creators The network direction is down- wards The chart direction is upwards Not extendable notations, BN is a Directed Acyclic Graph Extendable notations, richer se- mantics and it has some under- standing of what it represents Applicable to wide range of domains, used in various ap- plications Designed for law domain, but can be applied to other domains only if it can be extended Produce supportive probabilis- tic arguments for the final con- clusion Enable the production of argu- ment in favour and disfavour of the desired outcome More Complex generation Less complex generation Top down approach Enable Top down and Bottom up approaches Measurable results, not decisiveEither for or against the intended outcome The perspective of the creators does not play any role in the outcome of the network The Chart Method of Wigmore allows the occurrence of multi- ple evaluations and considera- tions of same evidences in legal cases, from various perspec- tives. The information flow from the basic fact or v ariable to the final outcome or goal The information flow from the final outcome or g oal to the basic fact or variable As shown in the e arlier comp arison, the need to combine selected features from these two approaches could prove to be beneficial in terms of producing valuable method to evaluate KAOS models, as explained in the next section. 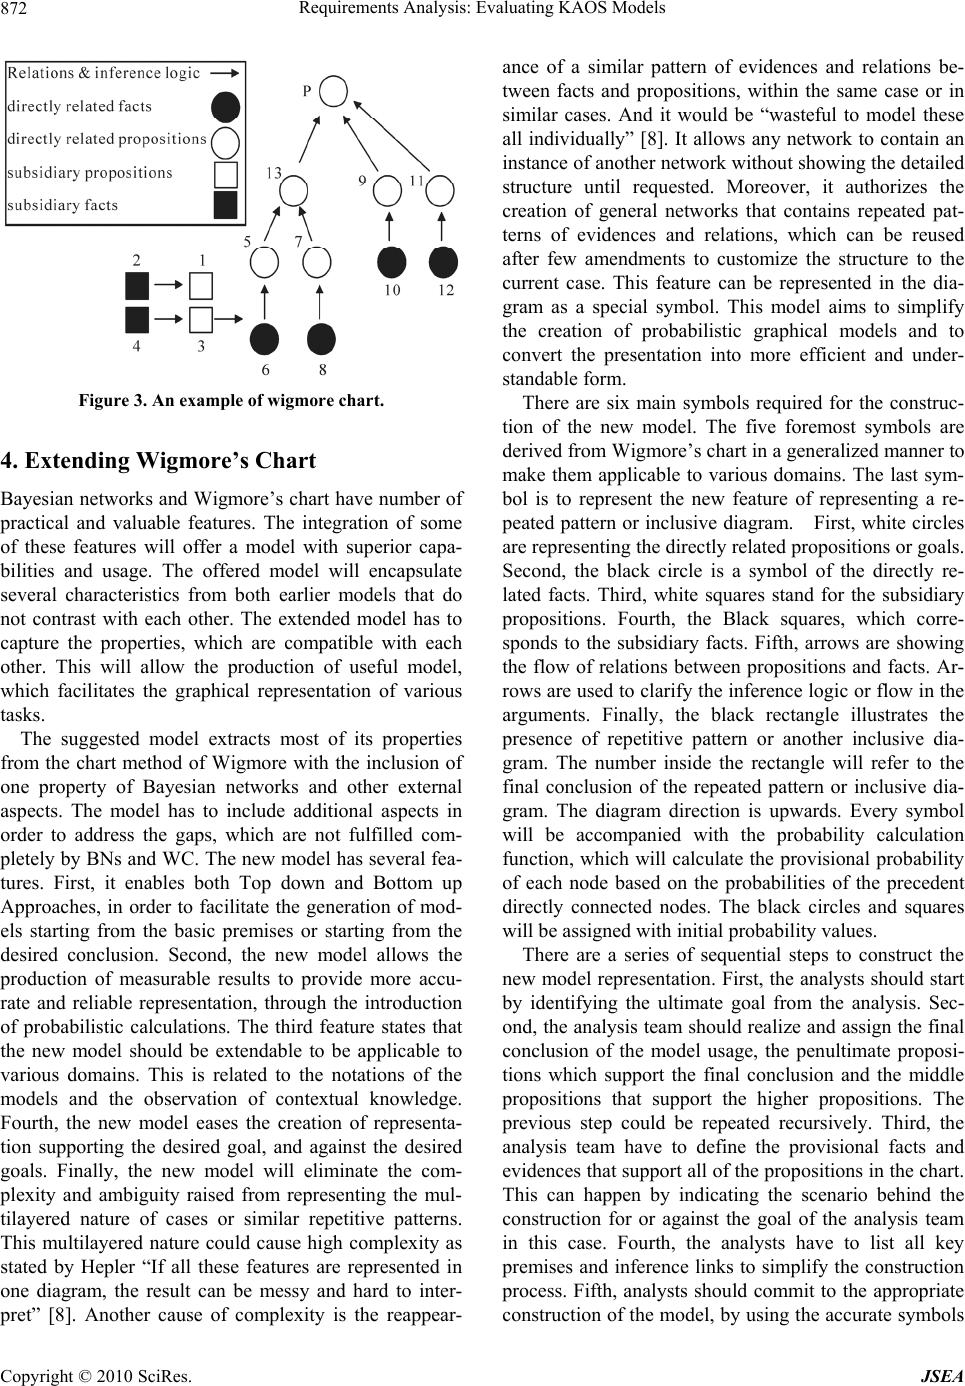 Requirements Analysis: Evaluating KAOS Models Copyright © 2010 SciRes. JSEA 872 Figure 3. An example of wigmore chart. 4. Extending Wigmore’s Chart Bayesian networks and Wigmore’s chart have number of practical and valuable features. The integration of some of these features will offer a model with superior capa- bilities and usage. The offered model will encapsulate several characteristics from both earlier models that do not contrast with each other. The extended model has to capture the properties, which are compatible with each other. This will allow the production of useful model, which facilitates the graphical representation of various tasks. The suggested model extracts most of its properties from the chart method of Wigmore with the inclusion of one property of Bayesian networks and other external aspects. The model has to include additional aspects in order to address the gaps, which are not fulfilled com- pletely by BNs and WC. The new model has several fea- tures. First, it enables both Top down and Bottom up Approaches, in order to facilitate the generation of mod- els starting from the basic premises or starting from the desired conclusion. Second, the new model allows the production of measurable results to provide more accu- rate and reliable representation, through the introduction of probabilistic calculations. The third feature states that the new model should be extendable to be applicable to various domains. This is related to the notations of the models and the observation of contextual knowledge. Fourth, the new model eases the creation of representa- tion supporting the desired goal, and against the desired goals. Finally, the new model will eliminate the com- plexity and ambiguity raised from representing the mul- tilayered nature of cases or similar repetitive patterns. This multilayered nature could cause high complexity as stated by Hepler “If all these features are represented in one diagram, the result can be messy and hard to inter- pret” [8]. Another cause of complexity is the reappear- ance of a similar pattern of evidences and relations be- tween facts and propositions, within the same case or in similar cases. And it would be “wasteful to model these all individually” [8]. It allows any network to contain an instance of another network without showing the detailed structure until requested. Moreover, it authorizes the creation of general networks that contains repeated pat- terns of evidences and relations, which can be reused after few amendments to customize the structure to the current case. This feature can be represented in the dia- gram as a special symbol. This model aims to simplify the creation of probabilistic graphical models and to convert the presentation into more efficient and under- standable form. There are six main symbols required for the construc- tion of the new model. The five foremost symbols are derived from Wigmore’s chart in a generalized manner to make them applicable to various domains. The last sym- bol is to represent the new feature of representing a re- peated pattern or inclusive diagram. First, white circles are representing the directly related proposition s or goals. Second, the black circle is a symbol of the directly re- lated facts. Third, white squares stand for the subsidiary propositions. Fourth, the Black squares, which corre- sponds to the subsidiary facts. Fifth, arrows are showing the flow of relations between propositions and facts. Ar- rows are used to clarify the inference logic or flow in the arguments. Finally, the black rectangle illustrates the presence of repetitive pattern or another inclusive dia- gram. The number inside the rectangle will refer to the final conclusion of the repeated pattern or inclusive dia- gram. The diagram direction is upwards. Every symbol will be accompanied with the probability calculation function, which will calculate the provisional probability of each node based on the probabilities of the precedent directly connected nodes. The black circles and squares will be assigned with initial probability values. There are a series of sequential steps to construct the new model representation. First, the analysts should start by identifying the ultimate goal from the analysis. Sec- ond, the analysis tea m should realize and assign the final conclusion of the model usage, the penultimate proposi- tions which support the final conclusion and the middle propositions that support the higher propositions. The previous step could be repeated recursively. Third, the analysis team have to define the provisional facts and evidences that support all of the propositions in the chart. This can happen by indicating the scenario behind the construction for or against the goal of the analysis team in this case. Fourth, the analysts have to list all key premises and inference links to simplify the construction process. Fifth, analysts should commit to the appropriate construction of the model, by using the accurate symbols 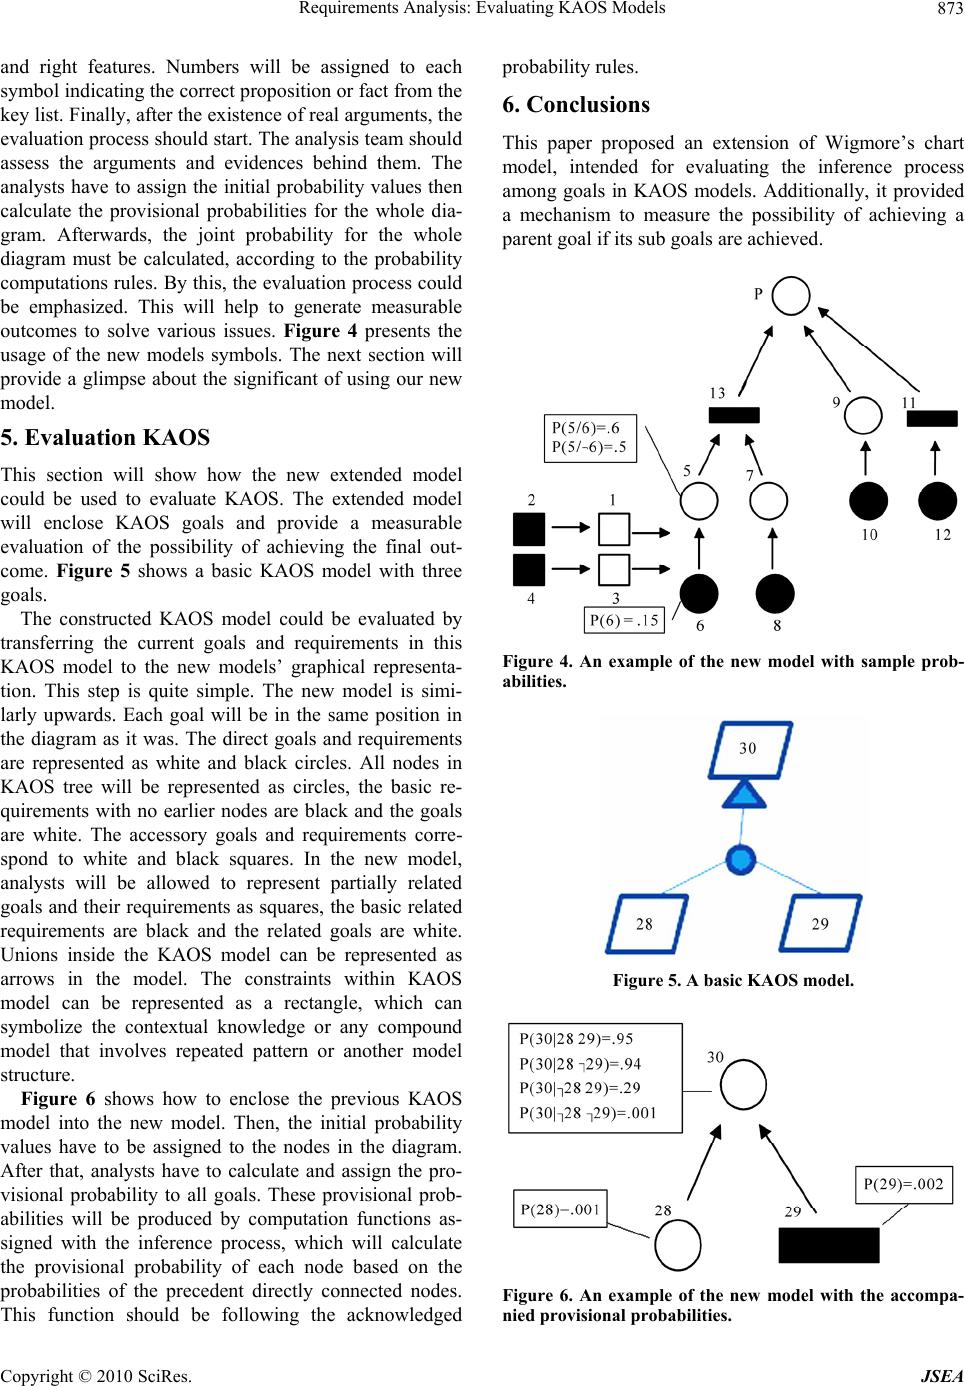 Requirements Analysis: Evaluating KAOS Models Copyright © 2010 SciRes. JSEA 873 and right features. Numbers will be assigned to each symbol indicating the correct proposition or fact from the key list. Finally, after the existence of real arguments, the evaluation process sh ould start. The analysis team should assess the arguments and evidences behind them. The analysts have to assign the initial probability values then calculate the provisional probabilities for the whole dia- gram. Afterwards, the joint probability for the whole diagram must be calculated, according to the probability computations rules. By this, the evaluation process could be emphasized. This will help to generate measurable outcomes to solve various issues. Figure 4 presents the usage of the new models symbols. The next section will provide a glimpse about the significant of using our new model. 5. Evaluation KAOS This section will show how the new extended model could be used to evaluate KAOS. The extended model will enclose KAOS goals and provide a measurable evaluation of the possibility of achieving the final out- come. Figure 5 shows a basic KAOS model with three goals. The constructed KAOS model could be evaluated by transferring the current goals and requirements in this KAOS model to the new models’ graphical representa- tion. This step is quite simple. The new model is simi- larly upwards. Each goal will be in the same position in the diagram as it was. The direct goals and requirements are represented as white and black circles. All nodes in KAOS tree will be represented as circles, the basic re- quirements with no earlier nodes are black and the goals are white. The accessory goals and requirements corre- spond to white and black squares. In the new model, analysts will be allowed to represent partially related goals and their requirements as squares, the basic related requirements are black and the related goals are white. Unions inside the KAOS model can be represented as arrows in the model. The constraints within KAOS model can be represented as a rectangle, which can symbolize the contextual knowledge or any compound model that involves repeated pattern or another model structure. Figure 6 shows how to enclose the previous KAOS model into the new model. Then, the initial probability values have to be assigned to the nodes in the diagram. After that, analysts have to calculate and assign the pro- visional probability to all goals. These provisional prob- abilities will be produced by computation functions as- signed with the inference process, which will calculate the provisional probability of each node based on the probabilities of the precedent directly connected nodes. This function should be following the acknowledged probability rules. 6. Conclusions This paper proposed an extension of Wigmore’s chart model, intended for evaluating the inference process among goals in KAOS models. Additionally, it provided a mechanism to measure the possibility of achieving a parent goal if its sub goals are achieved. Figure 4. An example of the new model with sample prob- abilities. Figure 5. A basic KAOS model. Figure 6. An example of the new model with the accompa- nied provisional probabilities.  Requirements Analysis: Evaluating KAOS Models Copyright © 2010 SciRes. JSEA 874 Both Wigmore’s chart and Bayesian networks were reviewed before an extended Wigmore’s chart could be proposed. The new model provides a mathematical eva- luation of KAOS, increasing the chances of constructing the right model. The new model presents a method for producing measurable results of the overall goals. The main obstacle of the proposed evaluation ap- proach is that it is not always feasible to know and assign the possibility of the inference from the leaves to the parent node. The proposed model suggested the use of a new separate model rather than extending KAOS model. This is to avoid adding complexity to KAOS models, in addition to the standardization grounds. This work can be extended by building on the mathe- matical properties of the extended Wigmore’s chart and by identifying advanced means for assigning the initial probability values. REFERENCES [1] A. Dardenne, A. van Lamsweerde and S. Fickas, “Goal- Directed Requirements Acquisition,” Science of Com- puter Programming, Vol. 20, No. 1-2, April 1993, pp. 3-50. [2] Respect IT, A KAOS Tutorial, Objectiver, 2007. [3] F. Taroni, C. Aitken, P. Garbolino and A. Biedermann, “Bayesian Networks and Probabilistic Inference in Fo- rensic Science,” John Wiley and Sons, Chichester, 2006. [4] E. Charniak, “Bayesian Networks without Tears,” AI Magazine, Vol. 12, No. 4, 1991, pp. 50-63. [5] R. Neapolitan, “Learning Bayesian Networks,” Prentice Hall, New Jersey, 2004. [6] C. Reed, D. Walton and F. Macagno, “Argument Dia- gramming in Logic, Law and Artificial Intelligence,” The Knowledge Engineering Revie w, Vol. 22, No. 1, 2007, pp. 87-109. [7] D. A. Schum, “A Wigmorean Interpretation of the Evaluation of a Complicated Pattern of Evidence,” Tech- nical Report, 2005. http://tinyurl.com/2a3elq [8] A. Hepler, P. Dawid and V. Leucari, “Object Oriented Graphical Representations of Complex Patterns of Evi- dence,” Law, Probability and Risk, Vol. 6, No. 1-4, 2007, pp. 275-293. |