Paper Menu >>
Journal Menu >>
 Engineering, 2012, 5, 16-19 doi:10.4236/eng.2012.410B005 Published Online October 2012 (http://www.SciRP.org/journal/eng) Copyright © 2012 SciRes. ENG A mathematical Model to Predict Transition-to-Fatigue During Isometric Exercise on Muscles of the Lower Extremities Jorge Garza-Ulloa1, Huiying Yu1, T. Sarkodie-Gyan1, Pablo Rangel1, Olatunde Adeoye1, Noe Vargas Hernandez2 1Department of Electri cal an d Computer Engineering, UTEP, El Pas o, Texas, USA 2Mechanical Engineering Department, UTEP, El Paso, Texas, USA Email: tsarkodi@utep.edu Received 2012 ABSTRACT Surface Electromyography (sEMG) activities of the four muscles were studied from twelve healthy subjects to analyze muscle fati- gue. Data were recorded while subjects performed isometric exercises for a period of time until fatigue. The signal was segmented with 5000 samples to enable the evolutionary process. Based on the mean power spectrum and Median Frequency (MDF) of each segment, we developed a methodology that is able to detect the signal into a meaningful sequence of Non-Fatigue to Transi- tion-to-Fatigue. By identifying this transitional fatigue stage, it is possible to predict when fatigue will occur, which provides the foundation of the automated system that has the potential to aid in many applications of our lives, including sports, rehabilitation and ergonomics. Keywords: Surface Electromyograph y; Transition-to-Fatigue; Signal Processing; Median Frequency and Power Spectrum; Polynomial Regr es s ion Models 1. Introduction Localized muscle fatigue occurs after a prolonged, relatively strong muscle activity. This is referred to as the process of a declin e in force du ring a su stain ed muscle activity; the inability to exert any more force or power defined as physiological fatigue [1-3]. Localized muscle fatigue cause serious injury when the level of fatigue is high [8] . Muscles that are fatigued absorb less energy before they are stretched to such a degree it causes injuries. Three parts of localized muscle fatigue are descri bed on the elec tr omyogrphi c signa l: Non-Fatigue, Transition- to-Fatigue, and Fatigue [4 -6,10,11,19-21] . Non-Fatigue is when the fresh muscle is able to exert its maximum force. Fatigue relates to the onset of fatigue during a muscle contraction. Transition-To-Fatigue is the step between them and its detection can prevent muscle injury where the measurement is inherently lost. Once the onset of Transition-to-Fatigue is detected, what follows is a progressive process until fatigue onset is achieved. By identifying this transitional fatigue stage, it is possible to predict when fatigue will occur, which provides the foundation of the automated system that has the potential to aid in many applications of our lives, including sports, rehabilitation and ergonomics [12]. Due to the variability of inter-person muscle characteristics, there is no simple function or method for muscle load and timing that defines a precise muscle fatigue threshold [2,9]. Surface electromyography (sEMG) technique records electrical activities of the muscle as a non-invasive technology where signals can be analyzed to detect muscles on Transition-to - Fatigue by examining the changes in measurements; as a highlight to predict the ons et of the fatigue class. It was recently found that the changes due to fatigue in the sEMG signal are detected as increased in amplitude and decreased on frequency [8].The electrical impulse is carried down the motor neuron to the muscle. Muscl e fatigue c auses Mot or Unit (MU) recruitment and the MU firing rate increases as a function of the elapsed time suggesting that the recruitment of MU firing rates correlates with sEMG amplitude of the motor unit action potential (MUAP) detected [7,8]. It is common to study the sEMG in both the time and frequency domains. The Fourier Transform allows representation as a function of frequency rather than time, revealing its individual frequency components. Using Fast Fourier Transform (FFT) in equation 2, as a method for calculating the discrete Fourier Transform, is suitable for use in stationary signals, stochastic process whose joint probability distribution does not change when shifted in time or space. Two of the most common frequency-dependent features in sEMG analysis are the mean frequency (MNF) and median frequency (MDF) [8,14-18]. These two features are mostly applicable in sustained contraction: the mean frequency (MNF) is the average frequency of the power spectrum and is defined as its first-order moment; and the median frequency (MDF) is the frequency at which the spectrum is divided into two parts of equal power as indicated [13]. In this study, a mathematical model was used to predict the stage of Transition-to-Fatigue during Isometric Exercise using sEMG segmented assessment for the lower extremities. The data were segmented with 5,000 samples. The MDF of each segment were calculated and modeled with a regression poly- 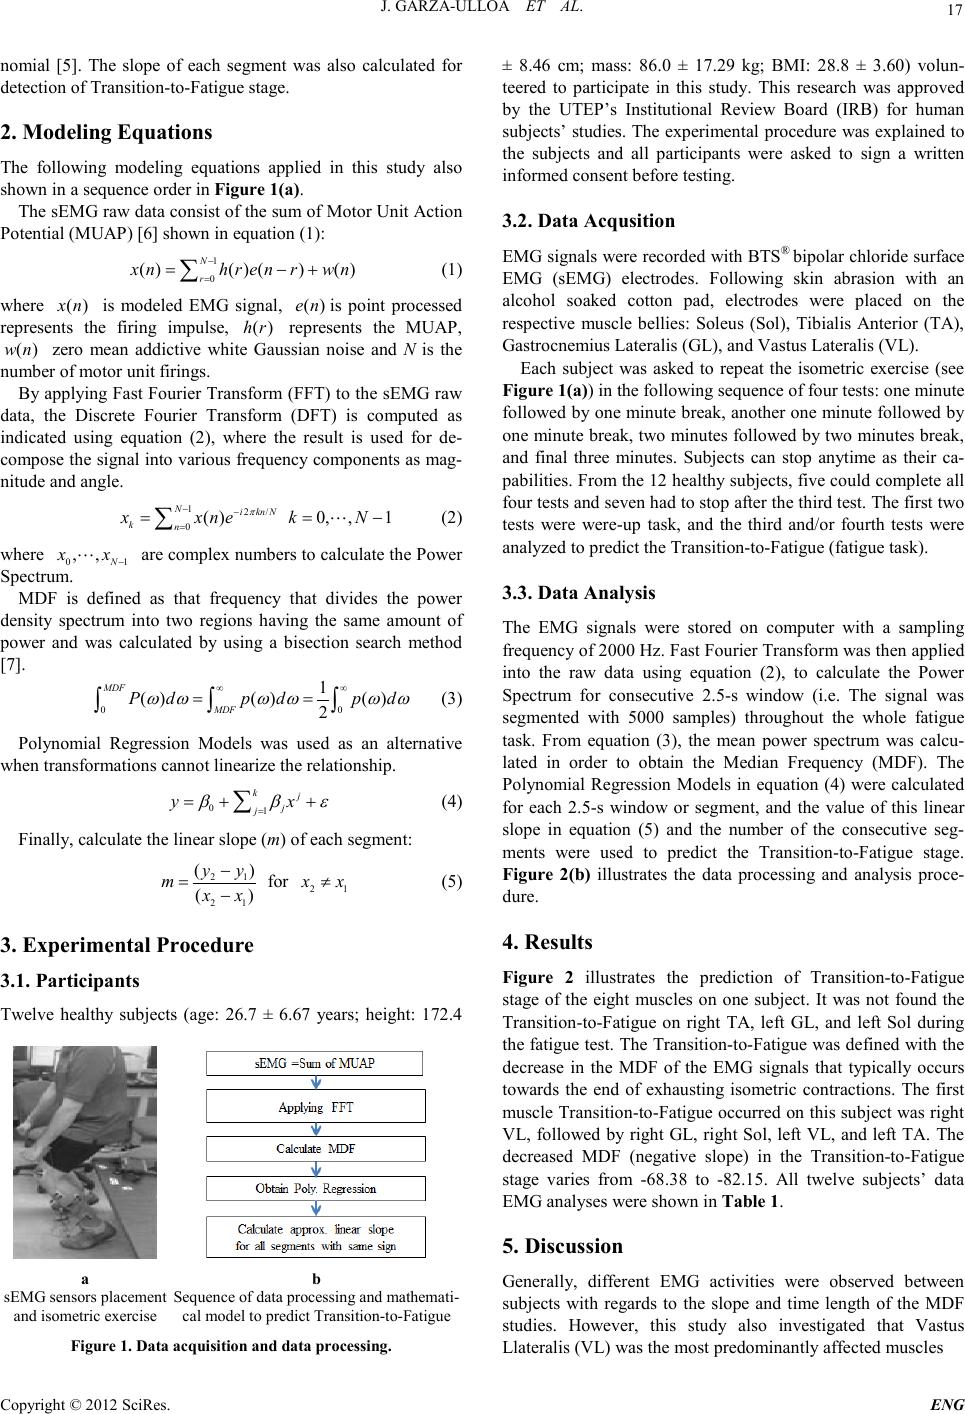 J. GARZA-ULLOA ET AL. Copyright © 2012 SciRes. E NG 17 nomial [5]. The slope of each segment was also calculated for detection of Transition-to-Fatigue stage. 2. Modeling Equations The following modeling equations applied in this study also shown in a sequence order in Figure 1(a). The sEMG raw data consist of the sum of Motor Unit Action Potential (MUAP) [6] shown in equation (1): 1 0 ()()() () N r xnhrenrwn − = = −+ ∑ (1) where ()xn is modeled EMG signal, ()en is point processed represents the firing impulse, ()hr represents the MUAP, () wn zero mean addictive white Gaussian noise and N is the number of motor unit firings. By applying Fast Fourier Transform (FFT) to the sEMG raw data, the Discrete Fourier Transform (DFT) is computed as indicated using equation (2), where the result is used for de- compose the signal into various frequency components as mag- nitude and angle. 12/ 0 () 0,,1 Nikn N kn xxne kN π −− = == − ∑ (2) where 01 ,, N xx − are complex nu mbers to calcu lat e th e P ower Spectrum. MDF is defined as that frequency that divides the power density spectrum into two regions having the same amount of power and was calculated by using a bisection search method [7] . 00 1 () ()() 2 MDF MDF Pd pdpd ωω ωω ωω ∞∞ = = ∫∫ ∫ (3) Polynomial Regression Models was used as an alternative when transformations cannot linearize the relationship. 01 kj j j yx β βε = =++ ∑ (4) Finally, calculat e the linear slop e (m) o f each s egment: 21 21 21 () for () yy m xx xx − = ≠ − (5) 3. Exp erimenta l Pro cedu r e 3.1. Participants Twelve healthy subjects (age: 26.7 ± 6.67 years; height: 172.4 a sEMG sensors placement and iso m e tr ic exer c ise b Sequence of data processing and mathemati- cal model to p redict Transition-to-Fatigue Figure 1. D ata acqu is ition and d at a p r oc e s si ng. ± 8.46 cm; mass: 86.0 ± 17.29 kg; BMI: 28.8 ± 3.60) volun- teered to participate in this study. This research was approved by the UTEP’s Institutional Review Board (IRB) for human subj ects’ studies. The experiment al procedure was explained to the subjects and all participants were asked to sign a written informed consent before testing. 3.2. Data Acqusitio n EMG signals were reco rded with BTS® bipolar chloride surface EMG (sEMG) electrodes. Following skin abrasion with an alcohol soaked cotton pad, electrodes were placed on the respective muscle bellies: Soleus (Sol), Tibialis Anterior (TA), Gastrocnemius Later alis ( G L), and Vast us Lateralis (VL). Each subject was asked to repeat the isometric exercise (see Figure 1(a)) in the following sequence of four tests: one minute followed by one minute break, another one minute followed by one minute break, two minutes followed by two minutes break, and final three minutes. Subjects can stop anytime as their ca- pabilities. From the 12 healthy subjects, five could complete all four tests and seven had to stop after the third test. The first two tests were were-up task, and the third and/or fourth tests were analyzed to pr edi ct the Tran sition-to-Fat igue (fatigue task). 3.3. Data Analysis The EMG signals were stored on computer with a sampling frequency of 2000 Hz. Fast Fourier Trans for m was th en app lied into the raw data using equation (2), to calculate the Power Spectrum for consecutive 2.5-s window (i.e. The signal was segmented with 5000 samples) throughout the whole fatigue task. From equation (3), the mean power spectrum was calcu- lated in order to obtain the Median Frequency (MDF). The Polynomial Regression Models in equation (4) were calculated for each 2.5-s window or segment, and the value of this linear slope in equation (5) and the number of the consecutive seg- ments were used to predict the Transition-to-Fatigue stage. Figure 2(b) illustrates the data processing and analysis proce- dure. 4. Results Figure 2 illustrates the prediction of Transition-to-Fatigue stage of the eight muscles on one subject. It was not found the Transition-to -Fatigue on right TA, left GL, and left Sol during the fatigue test. The Transition-to-Fatigue was defined with the decrease in the MDF of the EMG signals that typically occurs towards the end of exhausting isometric contractions. The first muscle Transition-to-Fatigue occurred on this subject was right VL, followed by right GL, right Sol, left VL, and left TA. The decreased MDF (negative slope) in the Transition-to-Fatigue stage varies from -68.38 to -82.15. All twelve subjects’ data EMG analyses were shown in Table 1. 5. Discussion Generally, different EMG activities were observed between subjects with regards to the slope and time length of the MDF studies. However, this study also investigated that Vastus Llateralis (VL) was the most predomin antly affected muscles 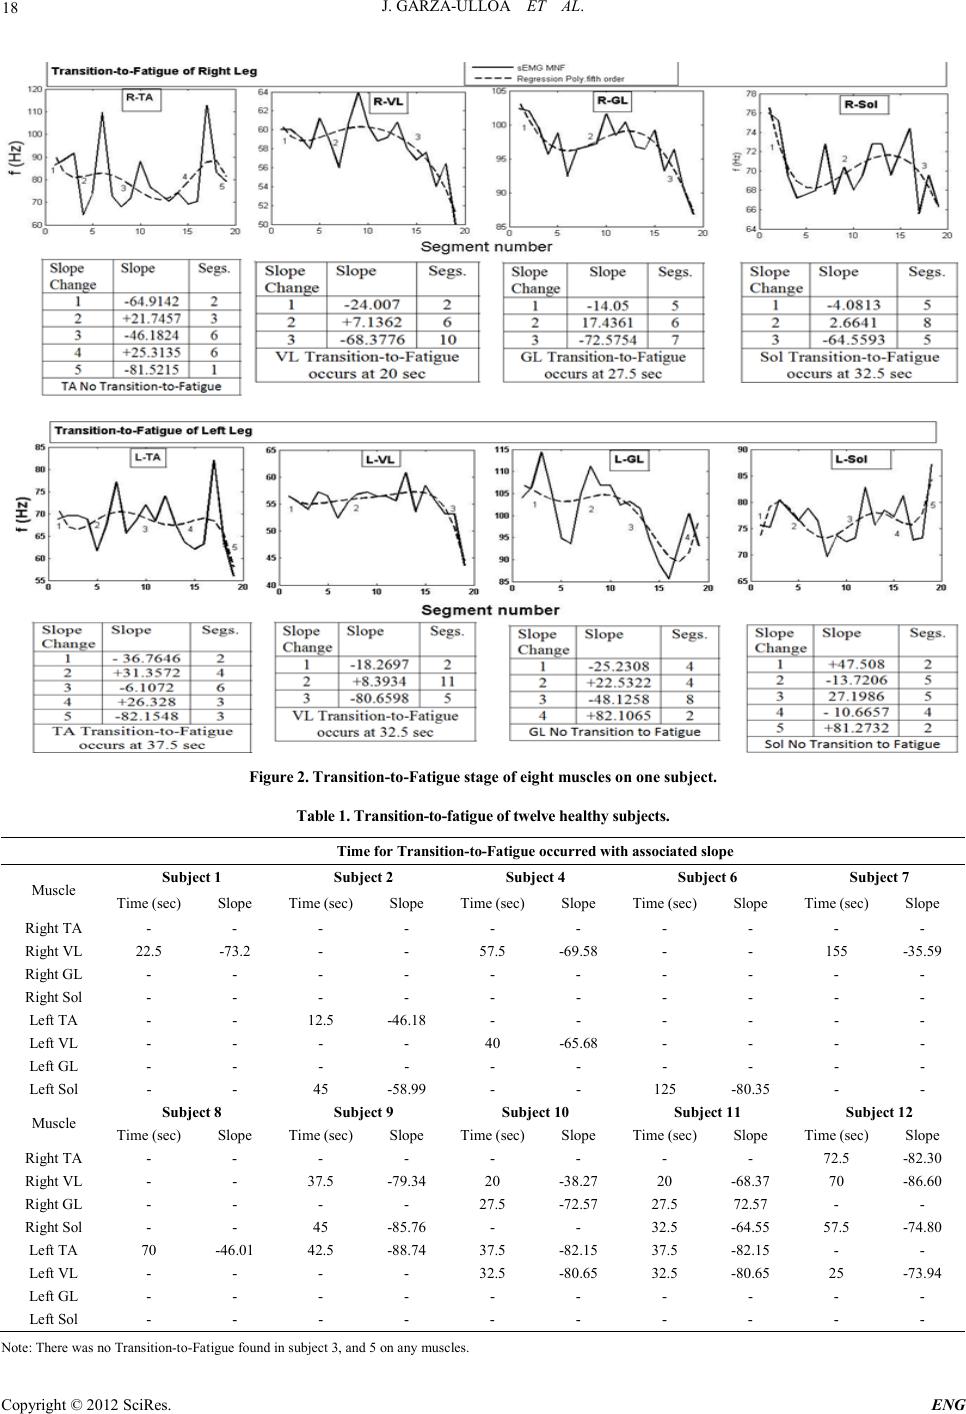 J. GARZA-ULLOA ET AL. Copyright © 2012 SciRes. ENG 18 Figure 2. Transition-to-Fatigue stage of eight muscles on one subject. Table 1. Transition-to-fatigue of twelve healthy subjects. Time for Transition-to-Fatigue occurred with associated slope Muscle Subject 1 Subject 2 Subject 4 Subjec t 6 Subjec t 7 Time (sec) Slope Time (sec) Slope Time (sec) Slope Time (sec) Slope Time (sec) Slope Right TA - - - - - - - - - - Right VL 22.5 -73.2 - - 57.5 -69.58 - - 155 -35.59 Righ t GL - - - - - - - - - - Right Sol - - - - - - - - - - Left TA - - 12.5 -46.18 - - - - - - Left VL - - - - 40 -65.68 - - - - Left GL - - - - - - - - - - Left Sol - - 45 -58.99 - - 125 -80.35 - - Muscle Subject 8 Subject 9 Subjec t 10 Subject 11 Subject 12 Time (sec) Slope Time (sec) Slope Time (sec) Slope Time (sec) Slope Time (sec) Slope Right TA - - - - - - - - 7 2 .5 -82.30 Right VL - - 37.5 -79.34 20 -38.27 20 -68.37 70 -86.60 Righ t GL - - - - 27.5 -72.57 27.5 72.57 - - Right Sol - - 45 -85.76 - - 32.5 -64.55 57.5 -74.80 Left TA 70 -46.01 42.5 -88.74 37.5 -82.15 37.5 -82.15 - - Left VL - - - - 32.5 -80.65 32.5 -80.65 25 -73.94 Left GL - - - - - - - - - - Left Sol - - - - - - - - - - Note: T here was no Transition-to-Fatigue found in subject 3, and 5 on any muscles. 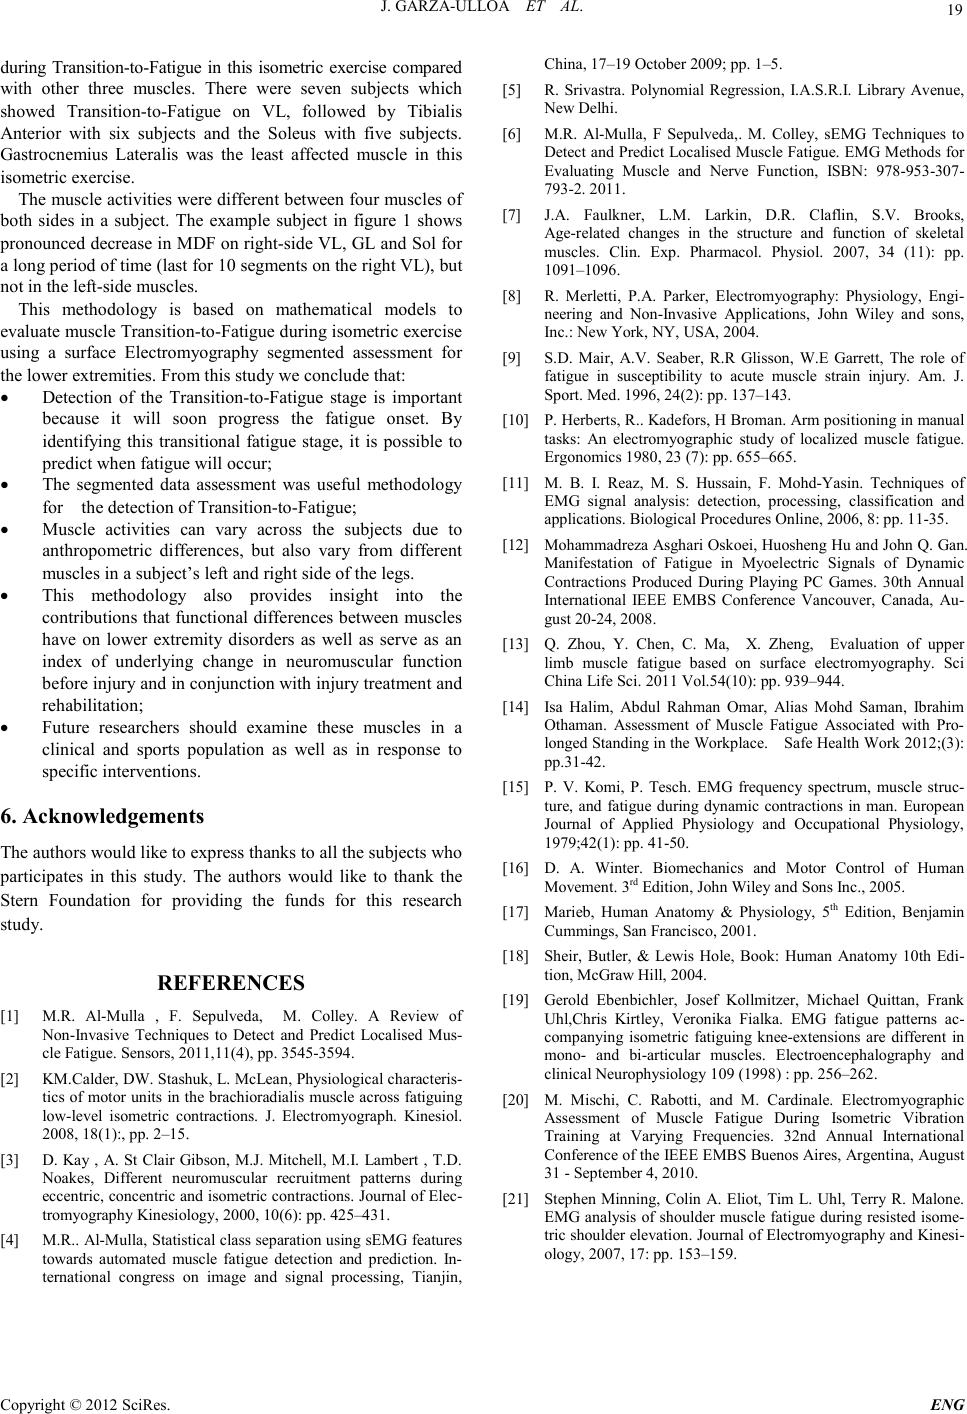 J. GARZA-ULLOA ET AL. Copyright © 2012 SciRes. E NG 19 during Transition-to-Fatigue in this isometric exercise compared with other three muscles. There were seven subjects which showed Transition-to-Fatigue on VL, followed by Tibialis Anterior with six subjects and the Soleus with five subjects. Gastrocnemius Lateralis was the least affected muscle in this isometric exercise. The muscle act iviti es were dif feren t between fo ur muscl es of both sides in a subject. The example subject in figure 1 shows pronounced decrease in MDF on right-side VL, GL and Sol for a long period of time (last for 10 segments on the right VL), but not in the left-side muscles. This methodology is based on mathematical models to evaluate muscle Tran sitio n-to-Fatigu e du ri ng i sometric exer ci se using a surface Electromyography segmented assessment for the lower extremities. From this study we conclude that: • Detection of the Transition-to-Fatigue stage is important because it will soon progress the fatigue onset. By identifying this transitional fatigue stage, it is possible to predict when fatigue will occur; • The segmented data assessment was useful methodology for the detection of Transition-to-Fatigue; • Muscle activities can vary across the subjects due to anthropometric differences, but also vary from different muscles in a subject’s left and right side of the legs. • This methodology also provides insight into the contributions that functional differences between muscles have on lower extremity disorders as well as serve as an index of underlying change in neuromuscular function before injury and in conjunction with injury treatment and rehabilitation; • Future researchers should examine these muscles in a clinical and sports population as well as in response to specific interventions. 6. Acknowledgements The authors would like to express thanks to all the subjects who participates in this study. The authors would like to thank the Stern Foundation for providing the funds for this research study. REFERENCES [1] M.R. Al-Mulla , F. Sepulveda, M. Colley. A Review of Non-Invasive Techniques to Detect and Predict Localised Mus- cle Fatigue. Sensors, 2011,11(4), pp. 3545 -3594. [2] KM.Calder, DW. Stashuk, L. McLean, Physiological characteris- tics of motor units in the brachioradialis muscle across fatiguing low-level isometric contractions. J. Electromyograph. Kinesiol. 200 8, 1 8 ( 1) :, pp. 2–15. [3] D. Kay , A. St Clair Gibson, M.J. Mitchell, M.I. Lambert , T.D. Noakes, Different neuromuscular recruitment patterns during eccentric, concentric and isometric contractions. Journal of Elec- tromyography Kinesiology, 2000, 10(6): pp. 425–431. [4] M .R.. Al-Mulla, Statistical class separation using sEMG features towards automated muscle fatigue detection and prediction. In- ternational congress on image and signal processing, Tianjin, China, 17–19 October 2009; pp. 1–5. [5] R. Srivastra. Polynomial Regression, I.A.S.R.I. Library Avenue, New Delhi. [6] M.R. Al-Mulla, F Sepulveda,. M. Colley, sEMG Techniques to Detect and Predict Localised Muscle Fatigue. EMG Methods for Evaluating Muscle and Nerve Function, ISBN: 978-953-307- 793-2. 2011. [7] J.A. Faulkner, L.M. Larkin, D.R. Claflin, S.V. Brooks, Age-related changes in the structure and function of skeletal muscles. Clin. Exp. Pharmacol. Physiol. 2007, 34 (11): pp. 1091–1096. [8] R. Merletti, P.A. Parker, Electromyography: Physiology, Engi- neering and Non-Inv asi v e Applications, John Wiley and sons, Inc.: New York, NY, USA, 2004. [9] S.D. Mair, A.V. Seaber, R.R Glisson, W.E Garrett, The role of fatigue in susceptibility to acute muscle strain injury. Am. J. Spor t . Med. 19 96, 24(2): pp. 1 37 –143. [10] P. Her b ert s, R . . Kad efor s, H Brom an . Arm posi t i onin g in manual tasks: An electromyographic study of localized muscle fatigue. Ergonomics 1980, 23 (7): pp. 655–665. [11] M. B. I. Reaz, M. S. Hussain, F. Mohd-Yasin. Techniques of EMG signal analysis: detection, processing, classification and applications. Biological Procedures Online, 2006, 8: pp. 11-35. [12] Mohammadreza Asghari Oskoei, Huosheng Hu and John Q. Gan. Manifestation of Fatigue in Myoelectric Signals of Dynamic Contractions Produced During Playing PC Games. 30th Annual International IEEE EMBS Conference Vancouver, Canada, Au- gust 20-24, 2008. [13] Q. Zhou, Y. Chen, C. Ma, X. Zheng, Evaluation of upper limb muscle fatigue based on surface electromyography. Sci China Life Sc i. 201 1 Vol.54(10): pp. 939–944. [14] Isa Halim, Abdul Rahman Omar, Alias Mohd Saman, Ibrahim Othaman. Assessment of Muscle Fatigue Associated with Pro- longed Standing in the Workplace. Safe Health Work 2012;(3): pp.31-42. [15] P. V. Komi, P. Tesch. EMG frequency spectrum, muscle struc- ture, and fatigue during dynamic contractions in man. European Journal of Applied Physiology and Occupational Physiology, 1979;42(1): pp. 41-50. [16] D. A. Winter. Biomechanics and Motor Control of Human Movem ent. 3rd Edition, John Wiley and Sons Inc., 2005. [17] Marieb, Human Anatomy & Physiology, 5th Edi tion, Benjamin Cummin gs , San Franc isco, 200 1. [18] Sheir, Butler, & Lewis Hole, Book: Human Anatomy 10th Edi- tion, McGraw Hill, 2004. [19] Gerold Ebenbichler, Josef Kollmitzer, Michael Quittan, Frank Uhl,Chris Kirtley, Veronika Fialka. EMG fatigue patterns ac- companying isometric fatiguing knee-extensions are different in mono- and bi-articular muscles. Electroencephalography and clini cal Neurophysiology 109 (199 8) : pp. 256–262. [20] M. Mischi, C. Rabotti, and M. Cardinale. Electromyographic Assessment of Muscle Fatigue During Isometric Vibration Training at Varying Frequencies. 32nd Annual International Con feren c e of t h e IEEE E MB S Bu enos Air es , Argen t i n a, Aug us t 31 - Septembe r 4, 2 01 0. [21] Stephen Minning, Colin A. Eliot, Tim L. Uhl, Terry R. Malone. EMG analysis of shoulder muscle fatigue during resisted isome- tric shoulder elevation. Journal of Electromyography and Kinesi- ol ogy, 2007, 17: p p. 1 53 –159. |