Paper Menu >>
Journal Menu >>
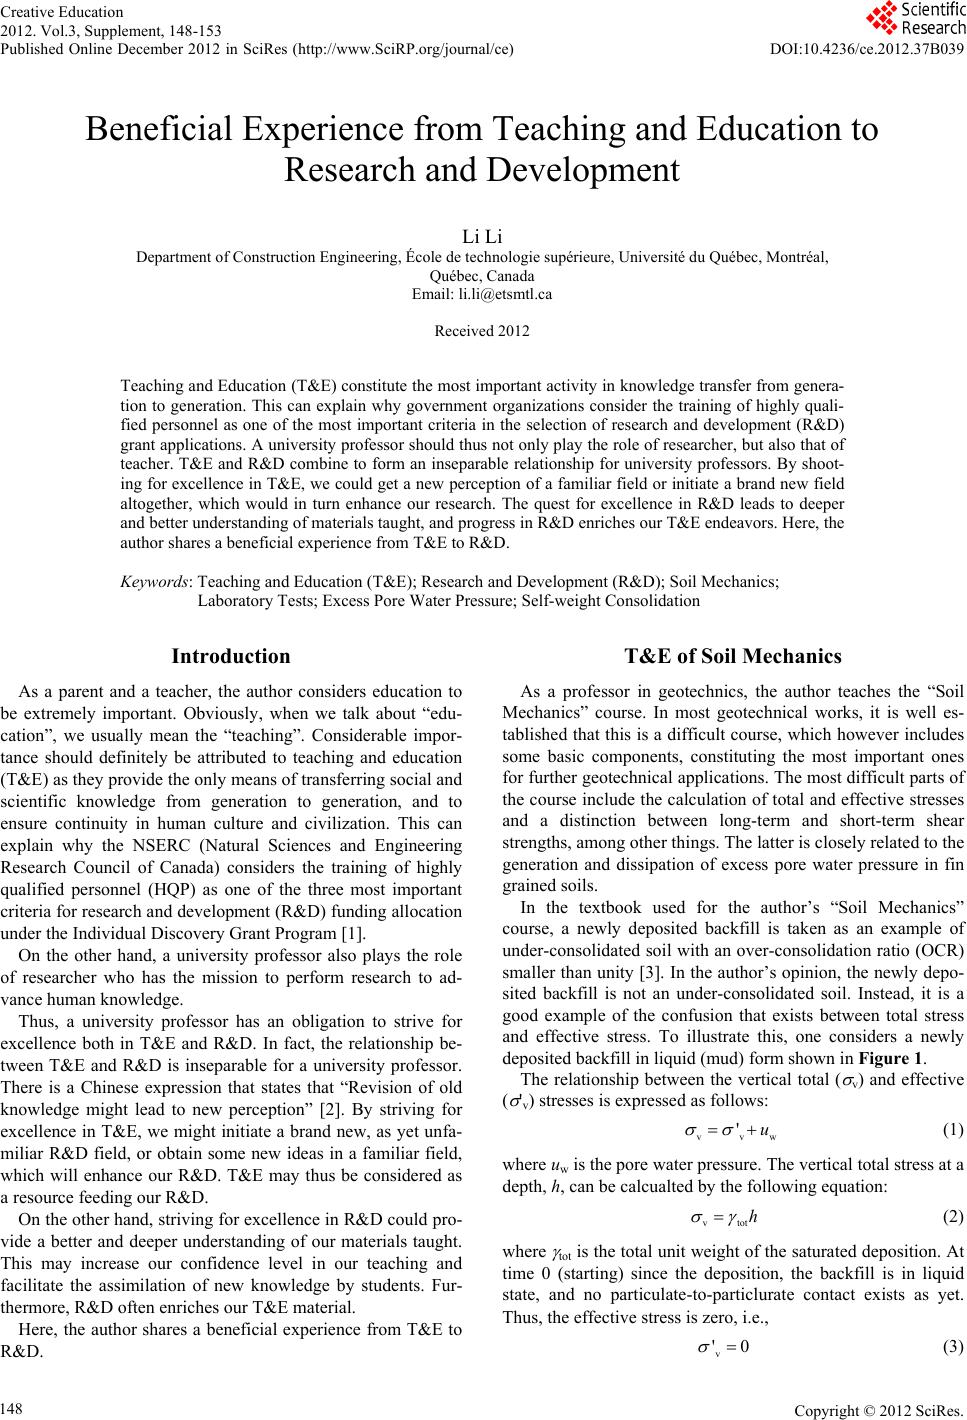 Creative Education 2012. Vol.3, Supplement, 148-153 Published Online December 2012 in SciRes (http://www.SciRP.org/journal/ce) DOI:10.4236/ce.2012.37B039 Copyright © 2012 SciRes. 148 Beneficial Experience from Teaching and Education to Research and Development Li Li Department of Construction Engineering, École de technologie supérieure, Université du Québec, Montréal, Québec, Canada Email: li.li@etsmtl.ca Received 2012 Teaching and Education (T&E) constitute the most important activity in knowledge transfer from genera- tion to generation. This can explain why government organizations consider the training of highly quali- fied personnel as one of the most important criteria in the selection of research and development (R&D) grant applications. A university professor should thus not only play the role of researcher, but also that of teacher. T&E and R&D combine to form an inseparable relationship for university professors. By shoot- ing for excellence in T&E, we could get a new perception of a familiar field or initiate a brand new field altogether, which would in turn enhance our research. The quest for excellence in R&D leads to deeper and better understanding of materials taught, and progress in R&D enriches our T&E endeavors. Here, the author shares a beneficial experience from T&E to R&D. Keywords: Teaching and Education (T&E); Research and Development (R&D); Soil Mechanics; Laboratory Tests; Excess Pore Water Pressure; Self-weight Consolidation Introduction As a parent and a teacher, the author considers education to be extremely important. Obviously, when we talk about “edu- cation”, we usually mean the “teaching”. Considerable impor- tance should definitely be attributed to teaching and education (T&E) as they provide the only means of transferring social and scientific knowledge from generation to generation, and to ensure continuity in human culture and civilization. This can explain why the NSERC (Natural Sciences and Engineering Research Council of Canada) considers the training of highly qualified personnel (HQP) as one of the three most important criteria for research and development (R&D) funding allocation under the Individual Discovery Grant Program [1]. On the other hand, a university professor also plays the role of researcher who has the mission to perform research to ad- vance human knowledge. Thus, a university professor has an obligation to strive for excellence both in T&E and R&D. In fact, the relationship be- tween T&E and R&D is inseparable for a university professor. There is a Chinese expression that states that “Revision of old knowledge might lead to new perception” [2]. By striving for excellence in T&E, we might initiate a brand new, as yet unfa- miliar R&D field, or obtain some new ideas in a familiar field, which will enhance our R&D. T&E may thus be considered as a resource feeding our R&D. On the other hand, striving for excellence in R&D could pro- vide a better and deeper understanding of our materials taught. This may increase our confidence level in our teaching and facilitate the assimilation of new knowledge by students. Fur- thermore, R&D often enriches our T&E material. Here, the author shares a beneficial experience from T&E to R&D. T&E of Soil Mechanics As a professor in geotechnics, the author teaches the “Soil Mechanics” course. In most geotechnical works, it is well es- tablished that this is a difficult course, which however includes some basic components, constituting the most important ones for further geotechnical applications. The most difficult parts of the course include the calculation of total and effective stresses and a distinction between long-term and short-term shear strengths, among other things. The latter is closely related to the generation and dissipation of excess pore water pressure in fin grained soils. In the textbook used for the author’s “Soil Mechanics” course, a newly deposited backfill is taken as an example of under-consolidated soil with an over-consolidation ratio (OCR) smaller than unity [3]. In the author’s opinion, the newly depo- sited backfill is not an under-consolidated soil. Instead, it is a good example of the confusion that exists between total stress and effective stress. To illustrate this, one considers a newly deposited backfill in liquid (mud) form shown in Figure 1. The relationship between the vertical total ( σ v) and effective ( σ 'v) stresses is expresse d as follows: v vw 'u σσ = + (1) where uw is the pore water pressure. The vertical total stress at a depth, h, can be calcualted by the following equation: v toth σγ = (2) where γ tot is the total unit weight of the saturated deposition. At time 0 (starting) since the deposition, the backfill is in liquid state, and no particulate-to-particlurate contact exists as yet. Thus, the effective stress is zero, i.e., v '0 σ = (3)  L. LI Copyright © 2012 SciRes. 149 h h w Figure 1. A newly deposited backfill. Entering Eqs. (2) and (3) into Eq. (1), we obtain the pore water pressure at a depth, h, as follows: w tot uh γ = (4) As γ tot is usually higher than the unit weight of water, γ w, Eq. (4) indicates that the pore water pressure at a depth, h, is higher than the hydrostatic pressure of water (= γ wh). Theoretically , if a piezometer is installed at the depth, h, a water height, hw, would be expected in the piezometer as follows: tot w w hh γ γ = (5) This equation indicates that the water column in the piezom- ter, hw, should be higher than the water table, h as γ tot is usually higher than γ w. The water column above the water table is called the “excess pore water perssure height”, which can read- ily be detected by an electronic piezometer. However, if a conventional tube piezometer was installed, nothing would probably be found in the piezometer. The reason for that will be given below. This may however lead to a false conclusion that the pore water pressure is nil and that the verti- cal total stress, σ v, is the same as the vertical effective stress, σ 'v. After a period of drainage and consolidation, the true vertical effective stress is increased to σ 'v0, which is the maximum ver- tical effective stress to which the newly deposited backfill has been submitted during its past history. Thus, its pre-consoldia- tion pressure, σ 'p, would be: p v0 '' σσ = (6) Obviously, the over-consolidatio ratio of the newly deposited backfill is: p v0 '1 ' OCR σ σ = = (7) This means that the newly deposited backfill is always a normally consoldiated soil. However, if we were to take the vertical total stress σ v0, which can be directely calculated from Eq. (2), as the the verti- cal effective stress, σ 'v0, we would obtain an OCR smaller than one1, as follows: ppp v0 v0v0 False calculationTrue state ''' 1 '' OCR σσσ σ σσ ==≤= (8) because, v0totv0 wv0 ''hu σγ σσ == +≥ (9) To confirm these hypotheses, and especially, to obtain a visualization of the excess pore water pressure, a laboratory instrumentation was built. This was part of the tasks realized by the author during the 2011-2012 school year to improve his T&E quality. The materials presented here has been used in the author’s teaching to faciliate comprehension of the very ab- stract “excess pore water pressure” concept by students. Laboratory Tests for T&E Newly Deposited Backfill Material The material of a newly deposited backfill was made from waste clayey samples, which had been used and stored in a bucket over several terms of the “Soil Mechanics” course in the École de technologie supérieure (ÉTS) Department of Con- struction Engineering. All these dry clayey samples were first well mixed, ground, and brewed with sufficient water to obtain an over saturated clayey liquid-like sample (Fi gure 2). Instrumentation and Tests Figure 3 shows the instrumentation used to investigate the self-weight consolidation behaviour of a newly deposited back- fill. Sand is put in the bottom of a rigid wall cylinder, and cov- ered with geotextile and filter paper. A piezometer is introduced into the sand layer. Figure 4 shows the situation in the beginning (Figure 4(a)) and the near end (Figure 4(b)) of the backfill deposition. Visualization of Excess Pore Water Pressure The term “excess pore wate pressure” has been defined pre- viously, and is closely related to the long-term and short-term stability of earth workings. Because the textbook [3] does not provide for its visualization, it is too abstract to understand for many students. Figure 2. Material of a newly deposited backfill sample. 1 Same false conclusion can also be deduced if the hydrostatic pressure is taken as the pore water pressure as the former is smaller than the latter. 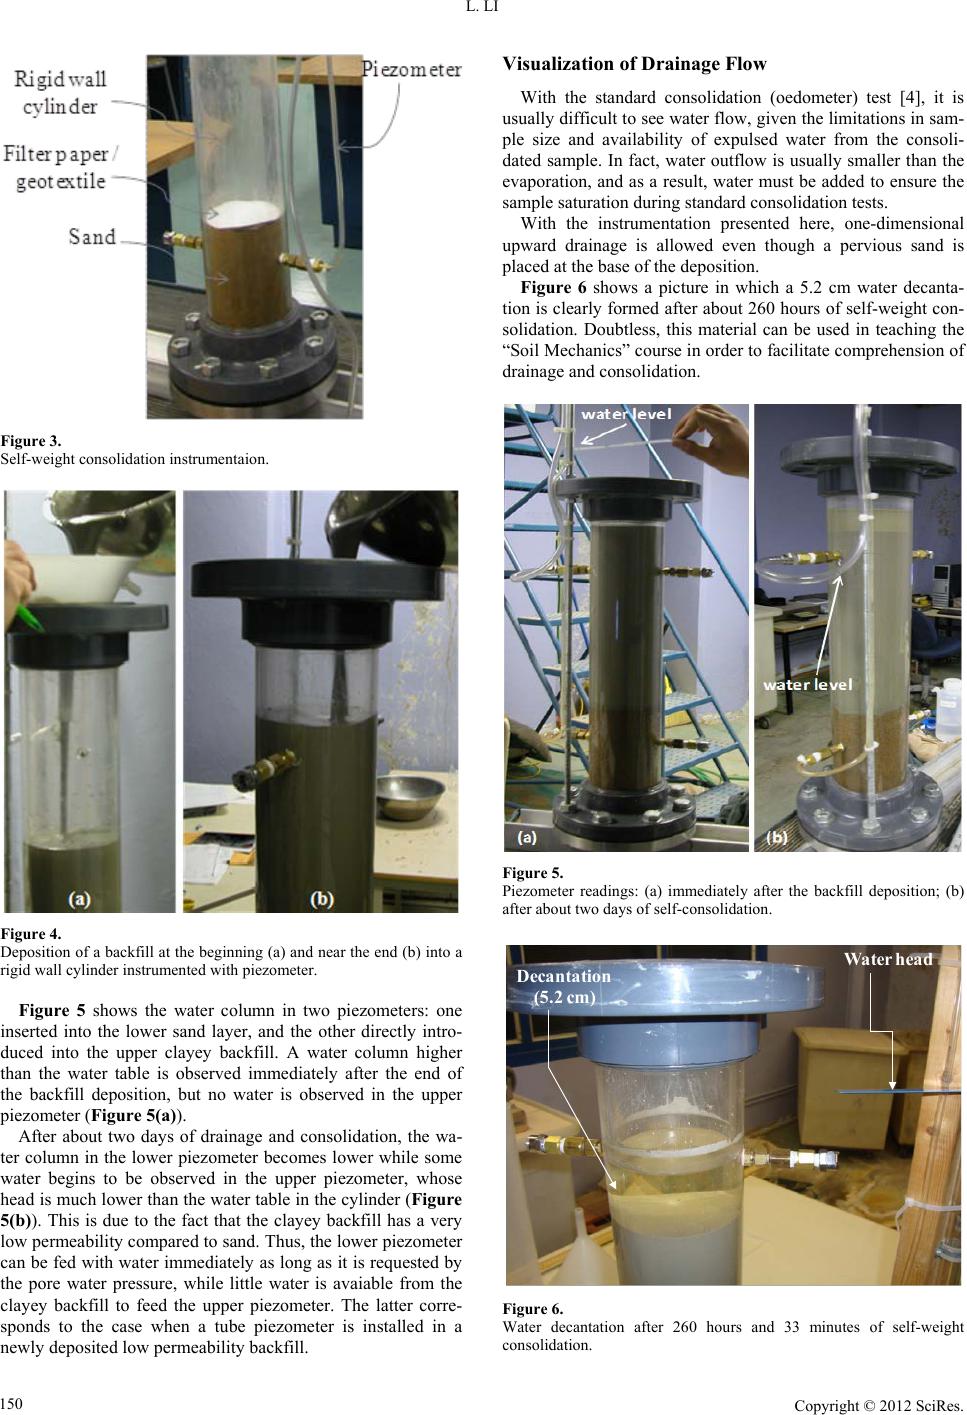 L. LI Copyright © 2012 SciRes. 150 Figure 3. Self-weight consolidation instrumentaion. Figure 4. Deposition of a backfill at the b eginning (a) and near the end (b) into a rigid wall cylinder instrumented with piezometer. Figure 5 shows the water column in two piezometers: one inserted into the lower sand layer, and the other directly intro- duced into the upper clayey backfill. A water column higher than the water table is observed immediately after the end of the backfill deposition, but no water is observed in the upper piezometer (Figure 5(a)). After about two days of drainage and consolidation, the wa- ter column in the lower piezometer becomes lower while some water begins to be observed in the upper piezometer, whose head is much lower than the water table in the cylinder (Figure 5(b)). This is due to the fact that the clayey backfill has a very low permeability compared to sand. Thus, the lower piezometer can be fed with water immediately as long as it is requested by the pore water pressure, while little water is avaiable from the clayey backfill to feed the upper piezometer. The latter corre- sponds to the case when a tube piezometer is installed in a newly deposited low permeability backfill. Visualization of Drainage Flow With the standard consolidation (oedometer) test [4], it is usually difficult to see water flow, given the limitations in sam- ple size and availability of expulsed water from the consoli- dated sample. In fact, water outflow is usually smaller than the evaporation, and as a result, water must be added to ensure the sample saturation during standard consolidation tests. With the instrumentation presented here, one-dimensional upward drainage is allowed even though a pervious sand is placed at the base of the deposition. Figure 6 shows a picture in which a 5.2 cm water decanta- tion is clearly formed after about 260 hours of self-weight con- solidation. Doubtless, this material can be used in teaching the “Soil Mechanics” course in order to facilitate comprehension of drainage and consolidation. Figure 5. Piezometer readings: (a) immediately after the backfill deposition; (b) after about two days of self-consolidation. Water head Decantation (5.2 cm) Figure 6. Water decantation after 260 hours and 33 minutes of self-weight consolidation. 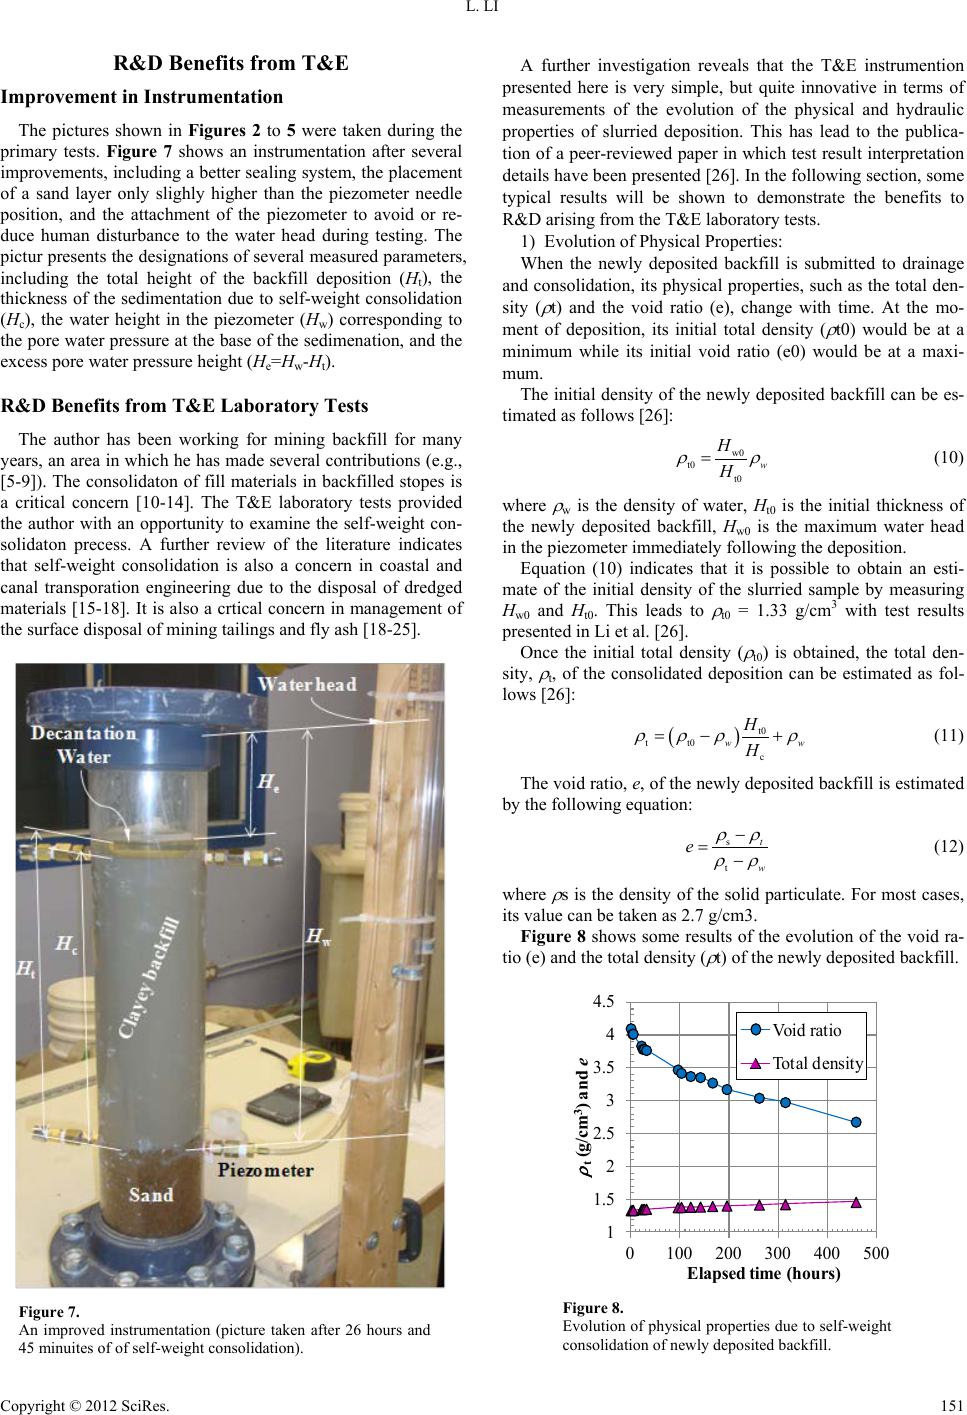 L. LI Copyright © 2012 SciRes. 151 R&D Benefits fro m T&E Improvement in Instrumentation The pictures shown in Figures 2 to 5 were taken during the primary tests. Figure 7 shows an instrumentation after several improvements, including a better sealing system, the placement of a sand layer only slighly higher than the piezometer needle position, and the attachment of the piezometer to avoid or re- duce human disturbance to the water head during testing. The pictur presents the designations of several measured parameters, including the total height of the backfill deposition (Ht), the thickness of the sedimentation due to self-weight consolidation (Hc), the water height in the piezometer (Hw) corresponding to the pore water pressure at the base of the sedimenation, and the excess pore water pressure height (He=Hw-Ht). R&D Benefits from T&E Laboratory Tests The author has been working for mining backfill for many years, an area in which he has made several contributions (e.g., [5-9]). The consolidaton of fill materials in backfilled stopes is a critical concern [10-14]. The T&E laboratory tests provided the author with an opportunity to examine the self-weight con- solidaton precess. A further review of the literature indicates that self-weight consolidation is also a concern in coastal and canal transporation engineering due to the disposal of dredged materials [15-18]. It is also a crtical concern in management of the surface disposal of mining tailings and fly ash [18-25]. Figure 7. An improved instrumentation (picture taken after 26 hours and 45 minuites of of self-weight consolidation). A further investigation reveals that the T&E instrumention presented here is very simple, but quite innovative in terms of measurements of the evolution of the physical and hydraulic properties of slurried deposition. This has lead to the publica- tion of a peer-reviewed paper in which test result interpretation details have been presented [26]. In the following section, some typical results will be shown to demonstrate the benefits to R&D arising from the T&E laboratory tests. 1) Evolution of Physical Properties: When the newly deposited backfill is submitted to drainage and consolidation, its physical properties, such as the total den- sity ( ρ t) and the void ratio (e), change with time. At the mo- ment of deposition, its initial total density ( ρ t0) would be at a minimum while its initial void ratio (e0) would be at a maxi- mum. The initia l density of the newly deposited backfill can be es- timated as follows [26]: w0 t0 t0 w H H ρρ = (10) where ρ w is the density of water, Ht0 is the initial thickness of the newly deposited backfill, Hw0 is the maximum water head in the piezometer immediately following the deposition. Equation (10) indicates that it is possible to obtain an esti- mate of the initial density of the slurried sample by measuring Hw0 and Ht0. This leads to ρ t0 = 1.33 g/cm3 with test results presented in Li et al. [26]. Once the initial total density ( ρ t0) is obtained, the total den- sity, ρ t, of the consolidated deposition can be estimated as fol- lows [26]: ( ) t0 t t0 c ww H H ρ ρρρ =−+ (11) The void ratio, e, of the newly deposit ed backf ill is esti mated by the following equation: s t t w e ρρ ρρ − =− (12) where ρ s is the density of the solid particulate. For most cases, its value can be taken as 2.7 g/cm3. Figure 8 shows some results of the evolution of the void ra- tio (e) and the total density ( ρ t) of the newly deposited backfill. 1 1.5 2 2.5 3 3.5 4 4.5 0100 200 300 400 500 ρ t (g/cm 3 ) an d e Elaps ed ti me (hours ) V oid ratio Total density Figure 8. Evolution of ph ysical properties due to self-weight consolidation of newly deposited backfill.  L. LI Copyright © 2012 SciRes. 152 It can be seen that the void ratio decreases while the total den- sity increases with the time of self-weight consolidation. 2) Evolution of Pore Water Pressures and Stresses With the instrumentation presented here, the pore water pressure, uw, and the excess pore water pressure ∆u, at the base of the deposition can be readily obtained as follows: w ww u gH ρ = (13) we u gH ρ ∆= (14) where g (= 9.81 m/s2) is the gravity accelerator. The total vertical stress, σ v, at the base of the deposition can be estimated with the following equation [26], ( ) v wtctc g HHgH σρ ρ = −+ (15) while the vertical effective stress, σ 'v at the base of the deposi- tion is estimated by the following equation: v vw 'u σσ = − (16) Figure 9 illustrates the evolution of (excess) pore water pressures and (total and effective) stresses at the base of the newly deposited backfill. It can be seen that the pore water pressure and the excess pore water pressure decrease at the same pace with the time of self-weight consolidation. Regard- ing the vertical stresses, the total one decreases while the effec- tive one increases with time of self-weight consolidation. Within the tested period, the difference between the total and effective stresses remains significantly high, indicating that the drainage and consolidation process are still far from complete. 2) Evolution of Hydraulic Properties The hydraulic conductivity (or coefficient of permeability), k, is an important parameter in drainage and seepage calculations. Considering Darcy’s flow, the hydraulic conductivity can be obtained by the following equation: v ki = (17) where v is the flow velocity through the sample, and i is the hydraulic gradient. With the instrumentation presented here, they can be obtained by the following equations: ( ) tc HH vt ∆− =∆ (18) w c 1 H iH =− (19) where ∆t is the time interval between two time point s of meas- urement, ∆(Ht – Hc) is the thickness variation of the decantation water during the period ∆t. Figure 10 shows the evolution of hydraulic conductivity of the newly deposited backfill estimated from experimental re- sults. It can be seen that the hydraulic conductivity decreases quickly at the early stage of self-weight consolidation, and tends to become constant after about 200 hours of consolidation. The figure also plots a description proposed by Li et al. [26]. It can be seen that the proposed equation describes the experi- mental data quite well. Discussion The results presented above stem from a very simple instru- mentation aimed at providing a visualizion of excess pore water pressure during the self-weight consolidation of a newly depos- ited backfill. The instrumentation was initially designed for T&E purposes. The results presented above clearly show that this target is achieved. Furthermore, it has been shown that the laboratory test method presented here can be used to measure a variety of physical and hydarulic properties of slurried depositions under self-weight consolidaton. Compared to existing test methods for measuring slurried deposition physical and hydraulic prop- erties [4, 15-16], the method presented here has an important advantage: no external hydraulic or mechanical solicitation is applied. Consequently, the state of the deposition is not dis- turbed during the test. Results obtained with the proposed method should be more representative than with existing methods. Of course, the instrumentaion presented here is still far from perfect. More work is needed to improve the testing method. Nonetheless, the results shown above clearly demonstrate the R&D benefits from T&E. 0 500 1000 1500 2000 2500 3000 3500 4000 4500 0100200300400500 Stresses and pressures (Pa) Elapsed ti me (hours) Vertical total stress Vertical effective stress Pore water pressure Excess pore water pressure Figure 9. Evolution of (excess) pore water pressures and (total and effective) stresses at the base of the newly depos- ited backfill. 0 0.002 0.004 0.006 0.008 0100 200 300 400 500 k(cm/min) Elapsed ti me ( hours) Exp. data Proposed equation Figure 10. Evolution of hydraulic condu ctivity of th e newly dep os- ited backfill estimated f rom measurement an d describ ed with an equation proposed in Li et al. [26]. 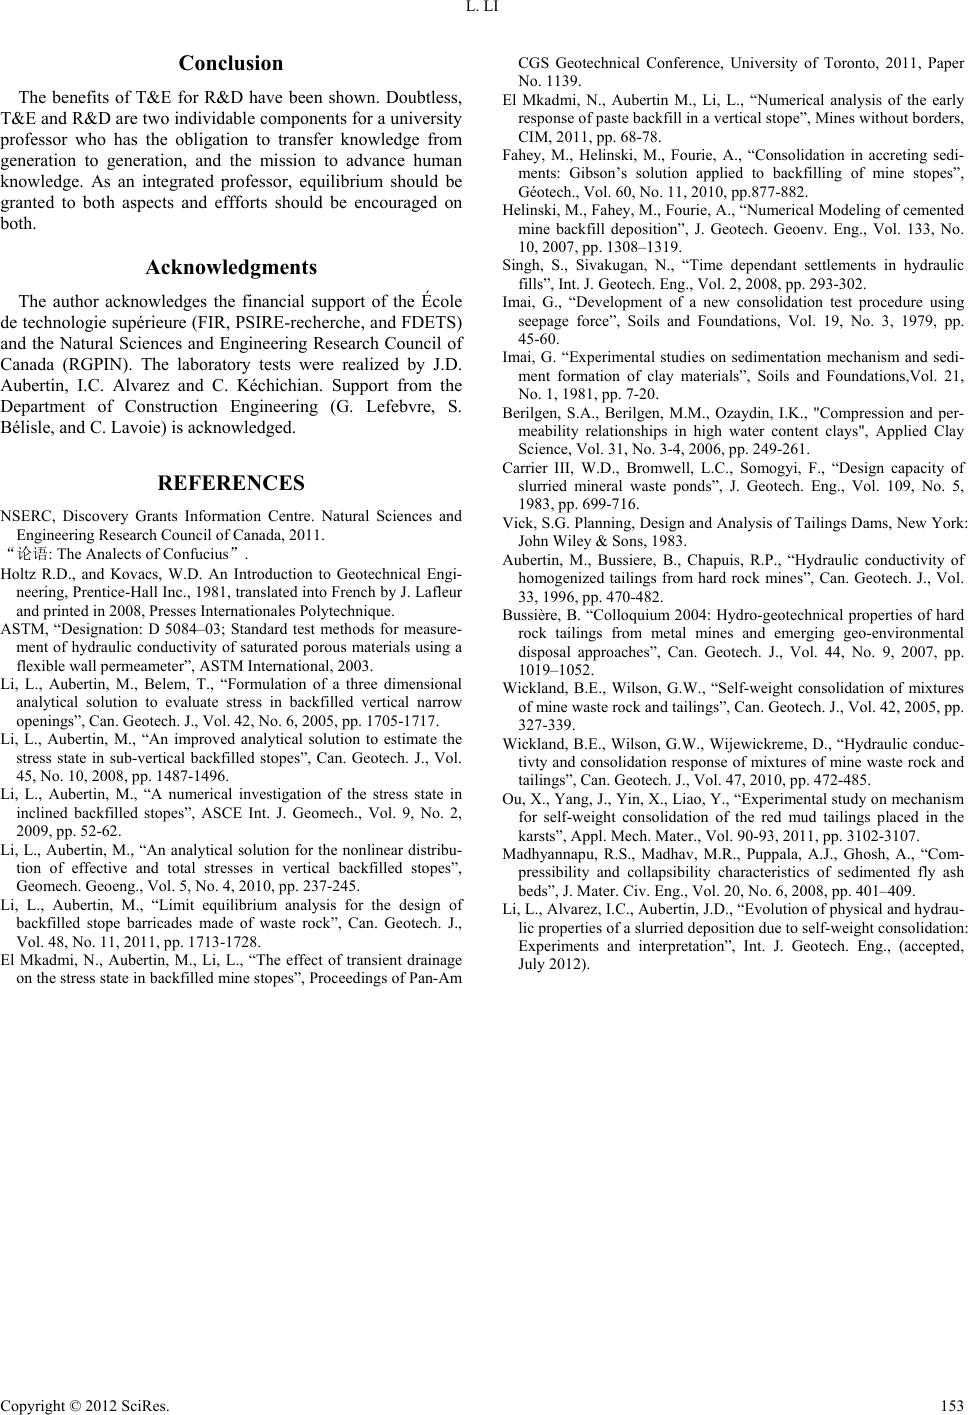 L. LI Copyright © 2012 SciRes. 153 Conclusion The benefits of T&E for R&D have been shown. Doubtless, T&E and R&D are two individable c omponents for a university professor who has the obligation to transfer knowledge from generation to generation, and the mission to advance human knowledge. As an integrated professor, equilibrium should be granted to both aspects and effforts should be encouraged on both. Acknowledgment s The author acknowledges the financial support of the École de technologie supérieure (FIR, PSIRE-recherche, and FDETS) and the Natural Sciences and Engineering Research Council of Canada (RGPIN). The laboratory tests were realized by J.D. Aubertin, I.C. Alvarez and C. Kéchichian. Support from the Department of Construction Engineering (G. Lefebvre, S. Bélisle, and C. Lavoie) is acknowledged. REFERENCES NSERC, Discovery Grants Information Centre. Natural Sciences and Engineering Research Council of Canada, 2011. “论语: The Analects of Confucius”. Holtz R.D., and Kovacs, W.D. An Introduction to Geotechnical Engi- neering, Prentice-Hall Inc., 1981 , translated into French by J. Lafleur and printed in 2008, Presses Internationales Polytechnique. ASTM, “Designation: D 5084–03; Standard test methods for measure- ment of hydraulic co nductivity of saturated porous mat erials using a flexible wall permeameter”, ASTM International, 2003. Li, L., Aubertin, M., Belem, T., “Formulation of a three dimensional analytical solution to evaluate stress in backfilled vertical narrow openings”, Can. Geotech. J., Vol. 42, No. 6, 2005, pp. 1705-1717. Li, L., Aubertin, M., “An improved analytical solution to estimate the stress state in sub-vertical backfilled stopes”, Can. Geotech. J., Vol. 45, No. 10, 2008, pp. 1487-1496. Li, L., Aubertin, M., “A numerical investigation of the stress state in inclined backfilled stopes”, ASCE Int. J. Geomech., Vol. 9, No. 2, 2009, pp. 52-62. Li, L., Aubertin, M., “An analytical solution for the nonlinear distribu- tion of effective and total stresses in vertical backfilled stopes”, Geomech. Geoeng. , Vol. 5, No. 4, 2010, pp. 237-245. Li, L., Aubertin, M., “Limit equilibrium analysis for the design of backfilled stope barricades made of waste rock”, Can. Geotech. J., Vol. 48, No. 11, 2011, pp. 1713-1728. El Mkadmi, N., Aubertin, M., Li, L., “The effect of transient drainage on the stress state in b ack filled mine stop es”, Proceed ing s o f Pan-Am CGS Geotechnical Conference, University of Toronto, 2011, Paper No. 1139. El Mkadmi, N., Aubertin M., Li, L., “Numerical analysis of the early response of paste b ackf ill in a v e rtical sto pe”, Min es wit h o ut b o rders, CIM, 2011, pp. 68 -78. Fahey, M., Helinski, M., Fourie, A., “Consolidation in accreting sedi- ments: Gibson’s solution applied to backfilling of mine stopes”, Géotech., Vol. 60, No. 11, 2010, pp.877-882. Helinski, M., Fahey, M., Fou rie, A., “ Numerical Modeling o f cemented mine backfill deposition”, J. Geotech. Geoenv. Eng., Vol. 133, No. 10, 2007, pp. 1308–1319. Singh, S., Sivakugan, N., “Time dependant settlements in hydraulic fills”, Int . J. Geotech. Eng., Vol. 2, 2008, pp. 293-302. Imai, G., “Development of a new consolidation test procedure using seepage force”, Soils and Foundations, Vol. 19, No. 3, 1979, pp. 45-60. Imai, G. “Experimental studies on sedimentation mechanism and sedi- ment formation of clay materials”, Soils and Foundations,Vol. 21, No. 1, 1981, pp. 7-20. Berilgen, S.A., Berilgen, M.M., Ozaydin, I.K., "Compression and per- meab ility relationships in high water content clays", Applied Clay Science, Vol. 31, No. 3-4, 2006, pp. 249-261. Carrier III, W.D., Bromwell, L.C., Somogyi, F., “Design capacity of slurried mineral waste ponds”, J. Geotech. Eng., Vol. 109, No. 5, 1983, pp. 699-716. Vick, S.G. Planning, Desig n and An alysis of T ailings D ams, Ne w Yo rk: John Wiley & Sons, 1983. Aubertin, M., Bussiere, B., Chapuis, R.P., “Hydraulic conductivity of homogenized tailings f rom hard rock mines”, Can. Geotech. J., Vol . 33, 1996, pp. 470-482. Bussière, B. “Colloquium 2004: Hydro-geotechnical properties of hard rock tailings from metal mines and emerging geo-environmental disposal approaches”, Can. Geotech. J., Vol. 44, No. 9, 2007, pp. 1019–1052. Wickland, B.E., Wilson, G.W., “Self-weight consolidation of mixtures of mine waste rock and tailing s”, Can . Geotech . J. , Vol. 42 , 20 05, pp . 327-339. Wickland, B.E., Wilson, G .W., Wijewickreme, D., “Hydraulic conduc- tivty and consolidation response of mixtures of mine waste rock and tailings”, Can. Geotech. J., Vol. 47, 2010, pp. 472-485. Ou, X., Yang, J., Yin, X., Liao, Y., “Exp erimental study on mechanism for self-weight consolidation of the red mud tailings placed in the karsts”, Appl. Mech. Mater., Vol. 90-93, 2011, pp. 3102-3107. Madhyannapu, R.S., Madhav, M.R., Puppala, A.J., Ghosh, A., “Com- pressibility and collapsibility characteristics of sedimented fly ash beds”, J. Mater. Civ. Eng., Vol. 20, No. 6, 2008, pp. 401–409. Li, L., Alvarez, I. C., Aub ertin, J.D. , “ Evolution of p hysical and h ydrau- lic properties of a slurried deposition due to self-weight consolidation: Experiments and interpretation”, Int. J. Geotech. Eng., (accepted, July 2012). |