Paper Menu >>
Journal Menu >>
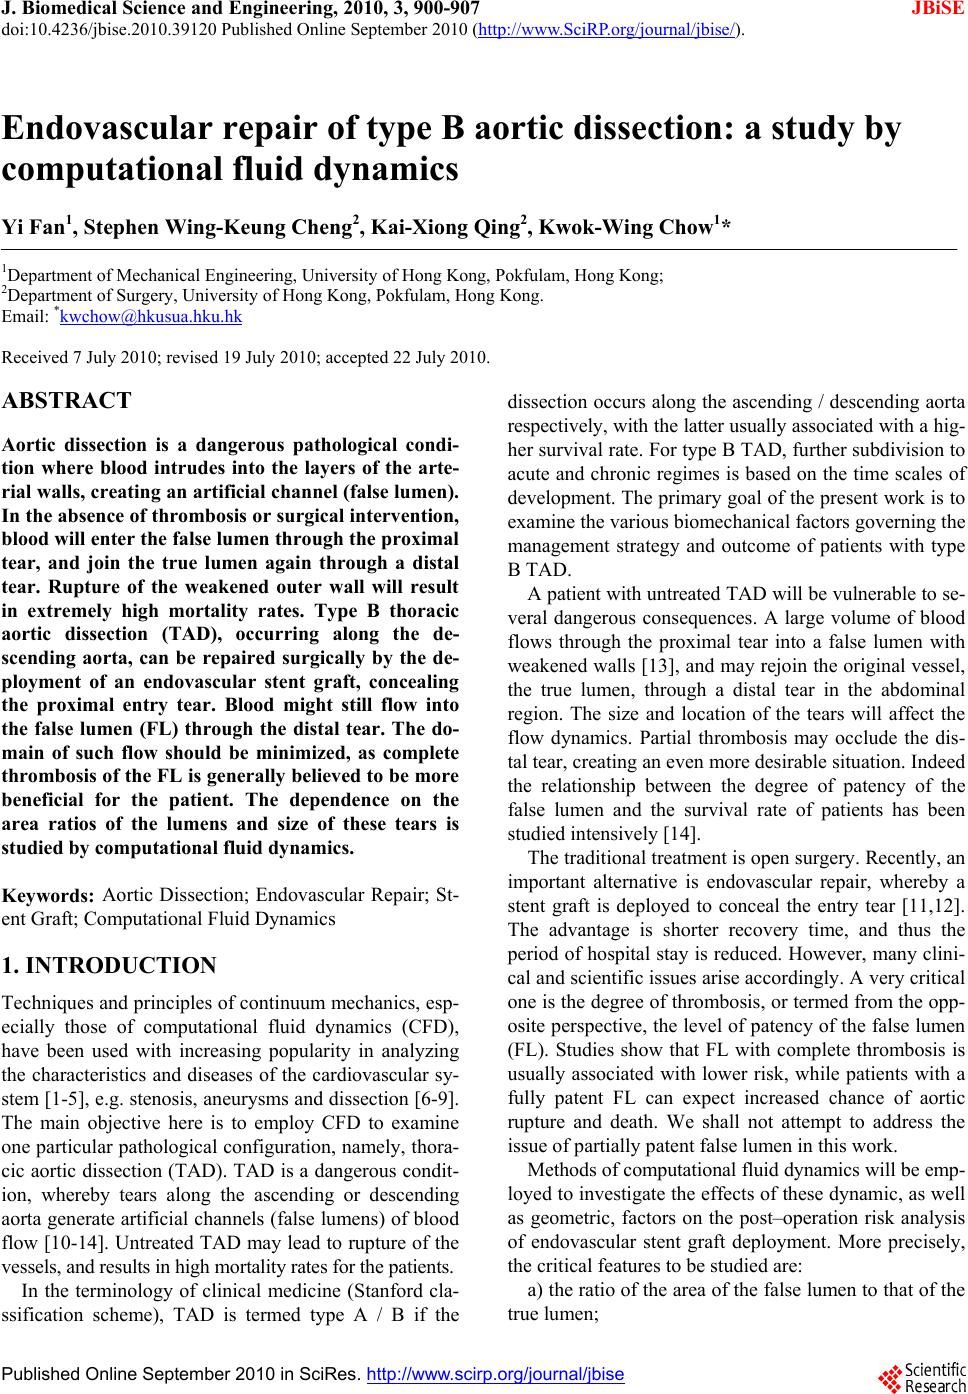 J. Biomedical Science and Engineering, 2010, 3, 900-907 doi:10.4236/jbise.2010.39120 Published Online September 2010 (http://www.SciRP.org/journal/jbise/ JBiSE ). Published Online September 2010 in SciRes. http:// www.scirp.org/journal/jbise Endovascular repair of type B aortic dissection: a study by computational fluid dynamics Yi Fan1, Stephen Wing-Keung Cheng2, Kai-Xiong Qing2, Kwok-Wing Chow1* 1Department of Mechanical Engineering, University of Hong Kong, Pokfulam, Hong Kong; 2Department of Surgery, University of Hong Kong, Pokfulam, Hong Kong. Email: *kwchow@hkusua.hku.hk Received 7 July 2010; revised 19 July 2010; accepted 22 July 2010. ABSTRACT Aortic dissection is a dangerous pathological condi- tion where blood intrudes into the layers of the arte- rial walls, creating an artificial channel (false lumen). In the abs ence of throm bosis o r surg ical int erve ntion , blood will enter the false lumen through the proximal tear, and join the true lumen again through a distal tear. Rupture of the weakened outer wall will result in extremely high mortality rates. Type B thoracic aortic dissection (TAD), occurring along the de- scending aorta, can be repaired surgically by the de- ployment of an endovascular stent graft, concealing the proximal entry tear. Blood might still flow into the false lumen (FL) through the distal tear. The do- main of such flow should be minimized, as complete thrombosis of the FL is generally believed to be more beneficial for the patient. The dependence on the area ratios of the lumens and size of these tears is studied by computational fluid dynamics. Keywords: Aortic Dissection; Endovascular Repair; St- ent Graft; Computational Fluid Dynamics 1. INTRODUCTION Techniques and principles of continuum mechanics, esp- ecially those of computational fluid dynamics (CFD), have been used with increasing popularity in analyzing the characteristics and diseases of the cardiovascular sy- stem [1-5], e.g. stenosis, aneurysms and dissection [6-9]. The main objective here is to employ CFD to examine one particular pathological configuration, namely, thora- cic aortic dissection (TAD). TAD is a dangerous condit- ion, whereby tears along the ascending or descending aorta generate artificial channels (false lumens) of blood flow [10-14]. Untreated TAD may lead to rupture of the vessels, and results in high mortality rates for the patients. In the terminology of clinical medicine (Stanford cla- ssification scheme), TAD is termed type A / B if the dissection occurs along the ascending / descending aorta respectively, with the latter usually associated with a hig- her survival rate. For type B TAD, further subdivision to acute and chronic regimes is based on the time scales of development. The primary goal of the present work is to examine the various biomechanical factors governing the management strategy and outcome of patients with type B TAD. A patient with untreated TAD will be vulnerable to se- veral dangerous consequences. A large volume of blood flows through the proximal tear into a false lumen with weakened walls [13], and may rejoin the original vessel, the true lumen, through a distal tear in the abdominal region. The size and location of the tears will affect the flow dynamics. Partial thrombosis may occlude the dis- tal tear, creating an even more desirable situation. Indeed the relationship between the degree of patency of the false lumen and the survival rate of patients has been studied intensively [14]. The traditional treatment is open surgery. Recently, an important alternative is endovascular repair, whereby a stent graft is deployed to conceal the entry tear [11,12]. The advantage is shorter recovery time, and thus the period of hospital stay is reduced. However, many clini- cal and scientific issues arise accordingly. A very critical one is the degree of thrombosis, or termed from the opp- osite perspective, the level of patency of the false lumen (FL). Studies show that FL with complete thrombosis is usually associated with lower risk, while patients with a fully patent FL can expect increased chance of aortic rupture and death. We shall not attempt to address the issue of partially patent false lumen in this work. Methods of computational fluid dynamics will be emp- loyed to investigate the effects of these dynamic, as well as geometric, factors on the post–operation risk analysis of endovascular stent graft deployment. More precisely, the critical features to be studied are: a) the ratio of the area of the false lumen to that of the true lumen; 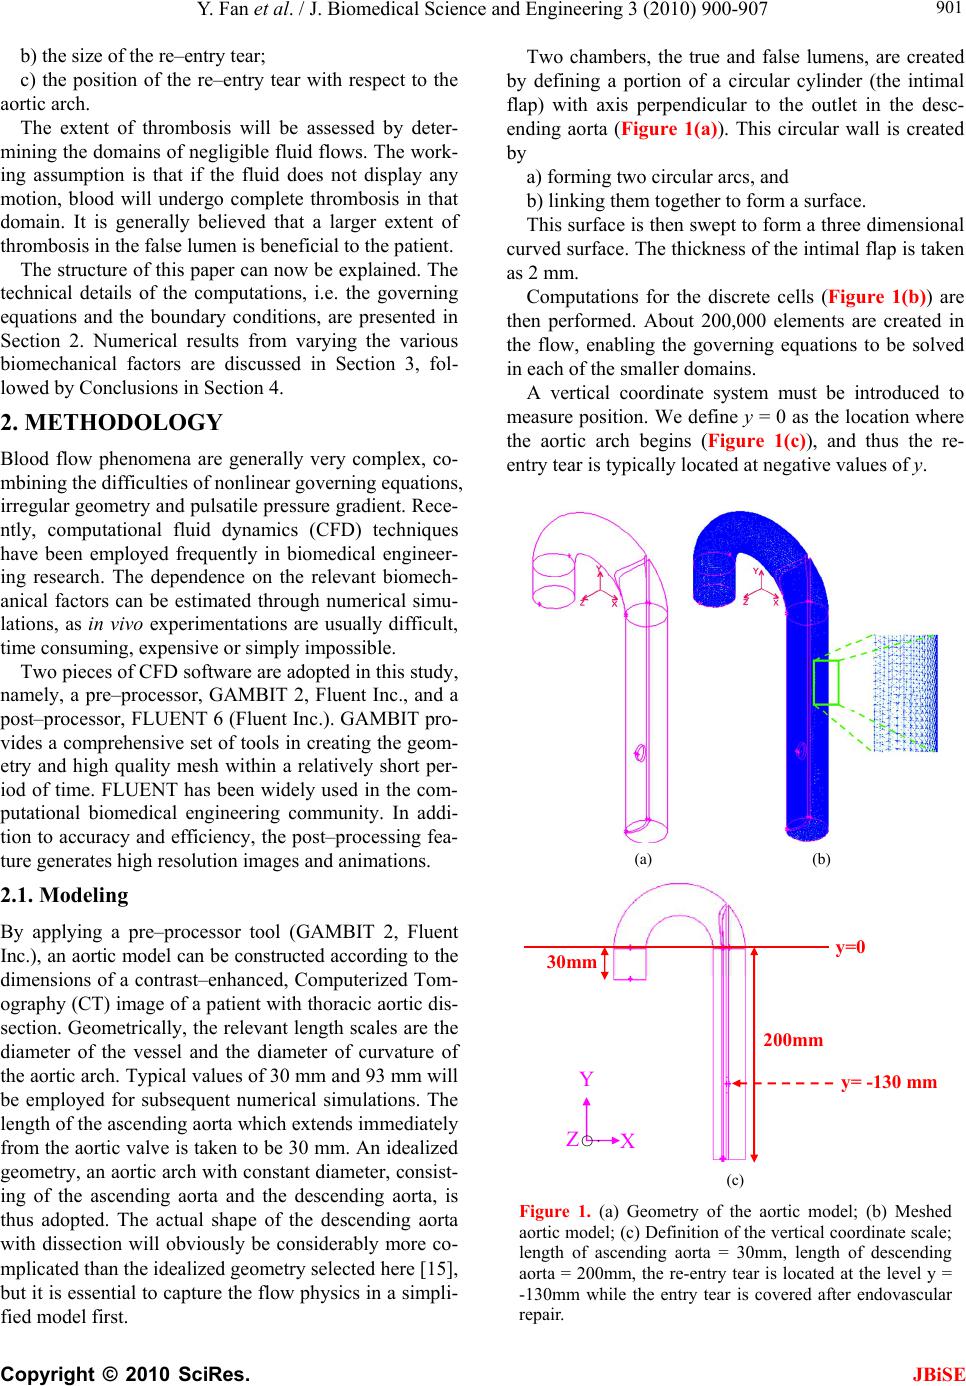 Y. Fan et al. / J. Biomedical Science and Engineering 3 (2010) 900-907 Copyright © 2010 SciRes. JBiSE 901 b) the size of the re–entry tear; c) the position of the re–entry tear with respect to the aortic arch. The extent of thrombosis will be assessed by deter- mining the domains of negligible fluid flows. The work- ing assumption is that if the fluid does not display any motion, blood will undergo complete thrombosis in that domain. It is generally believed that a larger extent of thrombosis in the false lumen is beneficial to the patient. The structure of this paper can now be explained. The technical details of the computations, i.e. the governing equations and the boundary conditions, are presented in Section 2. Numerical results from varying the various biomechanical factors are discussed in Section 3, fol- lowed by Conclusions in Section 4. 2. METHODOLOGY Blood flow phenomena are generally very complex, co- mbining the difficulties of nonlinear governing equations, irregular geometry and pulsatile pressure gradient. Rece- ntly, computational fluid dynamics (CFD) techniques have been employed frequently in biomedical engineer- ing research. The dependence on the relevant biomech- anical factors can be estimated through numerical simu- lations, as in vivo experimentations are usually difficult, time consuming, expensive or simply impossible. Two pieces of CFD software are adopted in this study, namely, a pre–processor, GAMBIT 2, Fluent Inc., and a post–processor, FLUENT 6 (Fluent Inc.). GAMBIT pro- vides a comprehensive set of tools in creating the geom- etry and high quality mesh within a relatively short per- iod of time. FLUENT has been widely used in the com- putational biomedical engineering community. In addi- tion to accuracy and efficiency, the post–processing fea- ture generates high resolution images and animations. 2.1. Modeling By applying a pre–processor tool (GAMBIT 2, Fluent Inc.), an aortic model can be constructed according to the dimensions of a contrast–enhanced, Computerized Tom- ography (CT) image of a patient with thoracic aortic dis- section. Geometrically, the relevant length scales are the diameter of the vessel and the diameter of curvature of the aortic arch. Typical values of 30 mm and 93 mm will be employed for subsequent numerical simulations. The length of the ascending aorta which extends immediately from the aortic valve is taken to be 30 mm. An idealized geometry, an aortic arch with constant diameter, consist- ing of the ascending aorta and the descending aorta, is thus adopted. The actual shape of the descending aorta with dissection will obviously be considerably more co- mplicated than the idealized geometry selected here [15], but it is essential to capture the flow physics in a simpli- fied model first. Two chambers, the true and false lumens, are created by defining a portion of a circular cylinder (the intimal flap) with axis perpendicular to the outlet in the desc- ending aorta (Figure 1(a)). This circular wall is created by a) forming two circular arcs, and b) linking them together to form a surface. This surface is then swept to form a three dimensional curved surface. The thickness of the intimal flap is taken as 2 mm. Computations for the discrete cells (Figure 1(b)) are then performed. About 200,000 elements are created in the flow, enabling the governing equations to be solved in each of the smaller domains. A vertical coordinate system must be introduced to measure position. We define y = 0 as the location where the aortic arch begins (Figure 1(c)), and thus the re- entry tear is typically located at negative values of y. (a) (b) 30mm 200mm y=0 Y y= -130 mm X Z ○‧ (c) Figure 1. (a) Geometry of the aortic model; (b) Meshed aortic model; (c) Definition of the vertical coordinate scale; length of ascending aorta = 30mm, length of descending aorta = 200mm, the re-entry tear is located at the level y = -130mm while the entry tear is covered after endovascular repair.  Y. Fan et al. / J. Biomedical Science and Engineering 3 (2010) 900-907 Copyright © 2010 SciRes. JBiSE 902 The descending aorta is thus divided into the true and false lumens. Endovascular repair is assumed to have been performed, and the proximal tear has been covered by the deployment of a stent graft. A re-entry tear, mod- eled by an elliptic hole of the intimal flap near the distal end, links the false and true lumens. Different area ratios of the lumens are obtained by varying the position of the circular boundary plane (Figures 2(a), 2(b)). In practice, the false lumen is typically several times larger than the true lumen. In subsequent simulations, six models with different area ratios are employed. 2.2. Governing Equations The governing equations of fluid motion are the usual continuity equation (conservation of mass), and the Nav- ier-Stokes (NS) equations (rate of change of momentum). In tensor notations (repeated indices implying summati- on), the continuity equation is 0 i i x u, (1) and the three dimensional NS equations are i ij ij i j i xx p x u u t u 11 , (2) where ρ = fluid density; ui (i = 1, 2, 3) = components of velocity vector; τij = normal and shear stresses; p = pres- sure. Cross section of the model thoracic aorta. Thickness of wall flap: 2mm. For subsequent simulations: F : T (Area Ratio of False Lumen/True Lumen) 1) 15.5mm : 12.5mm (1.83) 2) 16.5mm : 11.5mm (2.37) 3) 17.5mm : 10.5mm (2.85) 4) 18.5mm : 9.5mm (3.47) 5) 19.5mm : 8.5mm (4.28) 6) 21.0mm : 7.0mm (6.05) (a) Lmm S mm Re–entry (distal) tear of an elliptical shape. For subsequent simulations: A rea (Long (L);Short (S)) axes 1) 113.2 mm 2 (20mm; 14mm) 2) 172.8 mm 2 (22mm; 10mm) 3) 216.8 mm 2 (23mm; 12mm) 4 ) 263.9 mm 2 (24mm; 14mm) 5) 306.3 mm 2 (26mm; 15mm) (b) Figure 2. (a) Dimensions of the true and false lumens; (b) Size of the re-entry tear. The finite volume technique is utilized. In the control volume generated by the pre–processor, these governing equations are discretized and solved iteratively consid- ering the fully three dimensional character of the flow configuration. 2.3. Boundary Conditions Several assumptions regarding the rheological properties of blood will be made. Although blood is a suspension of blood cells and platelets in plasma, only plasma will be taken into consideration here as particles are normally dynamical unimportant. The blood is thus treated as an incompressible, homogeneous Newtonian fluid. This is a reasonable assumption for large arteries like the thoracic aorta, supported by recent studies which confirmed that non–Newtonian effects in large arteries are small [1]. The density of blood, ρ, is accordingly taken as 1060 kg m–3 while the viscosity, μ, is set as 0.0035 N s m–2 [2,3]. The no slip boundary conditions are adopted. To reduce the complexity of the problem, the elasticity of the wall, including the intimal flap, [16] will be neglected and will be addressed in a future paper. Similar to many earlier works in the literature, a ve- locity inlet and a pressure outlet are adopted as boundary conditions. To achieve realistic results, the velocity pro- files and pressure waveforms are calibrated to match closely the experimentally measured values as a function of time. Pulsatile (pulsating) profiles are adopted for both the velocity and pressure (Figure 3). At a fixed time, the velocity and pressure are assumed to be uni- form across the inlet and exit respectively. Applying the three-dimensional CFD codes in FLUENT 6 (Fluent Inc.), the blood flow pattern in the thoracic aorta can now be simulated. A remark on some typical numbers is in order. The peak inflow rate is taken as about 0.0002 m s–1. The range of pressure at the outlet is 82 mmHg – 125 mmHg. The systolic cycle is taken as 1 s. The mean velocity is 0.0309 m s–1 and the corresponding mean Reynolds nu- mber, Re = 281, and thus a laminar flow assumption is valid. Even with fairly arbitrary initial conditions, typic- ally three cycles of computations will generate a period- ic output, and data for the fourth cycle will be reported in the subsequent discussion. Both the velocity and pressure are analyzed at the pe- ak flow rate. We define a cut–off plane as the transverse planar surface in the descending aorta above which fluid motion does not exist, or at least is negligible. In clinical practice, the working assumption is that complete thr- ombosis will occur above this cut–off plane. 3. COMPUTATIONAL RESULTS We shall now study several geometric factors which will  Y. Fan et al. / J. Biomedical Science and Engineering 3 (2010) 900-907 Copyright © 2010 SciRes. 903 affect the dynamics of the dissection and the manage- ment strategy for the patients. The tactics in studying the dependence on each factor is to vary this particular fac- tor while all other variables are kept fixed. JBiSE 3.1. Varying the Area Ratio of False Lumen to True Lumen The first scenario is to vary the area ratio by altering the length scale T and F as defined in Figure 2(a). As illus- trative example for discussion, values of T = 12.5 mm and F = 15.5 mm will result in an area ratio of false lu- men to true lumen of 2:1. By steadily increasing F (or decreasing T, Figure 2(a)), Figure 4(a) shows that the region of complete thrombosis shrinks, i.e. values of the y–coordinate of the flow cutoff plane move towards the origin. In other words, a smaller true lumen will imply a smaller domain of thrombosis. A typical flow configura- tion of this ‘backflow’ in the false lumen, after the entry tear has been concealed by endovascular repair, shows indeed a large domain of stagnant fluid (Figure 4(b)). The clinical implication is that patients with a larger false lumen are at a higher risk, as the domain of compl- ete blood clot is now lesser in extent. 3.2. Varying the Size of the Re-Entry Tear Another clinical consideration is the size of the re-entry tear, where typical range of 100 mm2 to 300 mm2 is ch- osen (Figure 2(b)). Figure 5 clearly shows a decreasing domain of complete thrombosis with increasing size of the distal re-entry tear, i.e. y values of the cutoff plane move towards the origin. These results conform to our intuition and the fluid ph- ysics. The smaller the re–entry tear, the smaller the flow rate into the false lumen will be, due to the decreasing area as well as the increased viscous resistance with the shrinking linear dimension. Figure 3. The waveforms for the pulsatile velocity inlet and the pulsatile pressure outlet. (a)  Y. Fan et al. / J. Biomedical Science and Engineering 3 (2010) 900-907 Copyright © 2010 SciRes. JBiSE 904 (b) (c) Figure 4. (a) Varying the area ratio of false lumen to true lumen; (b) After endovascular repair, a larger true lumen will have a larger extent of thrombosis (left), while a larger false lumen will have more back flow and smaller region of thrombosis (right). (Color code: Red = higher velocity; Blue = lower velocity); (c) three dimensional streamline plots in the dissected thoracic aorta after endovascular repair. A larger true lumen will have a larger extent of thrombosis (left), while a larger false lumen will have more back flow and smaller region of thrombosis (right). (Color code: Red = higher velocity; Blue = lower velocity). Figure 5. The relation between the size of the re–entry tear of the false lumen and the extent of complete thrombosis. 3.3. Position of the Re-Entry Tear An examination of a large group of patients with TAD reveals that the position of the re-entry tear along the de- scending thoracic aorta will vary. Hence it is instructive to perform a numerical simulation in this direction. Fig- ures 6(a), 6(b) show that the dependence on the position 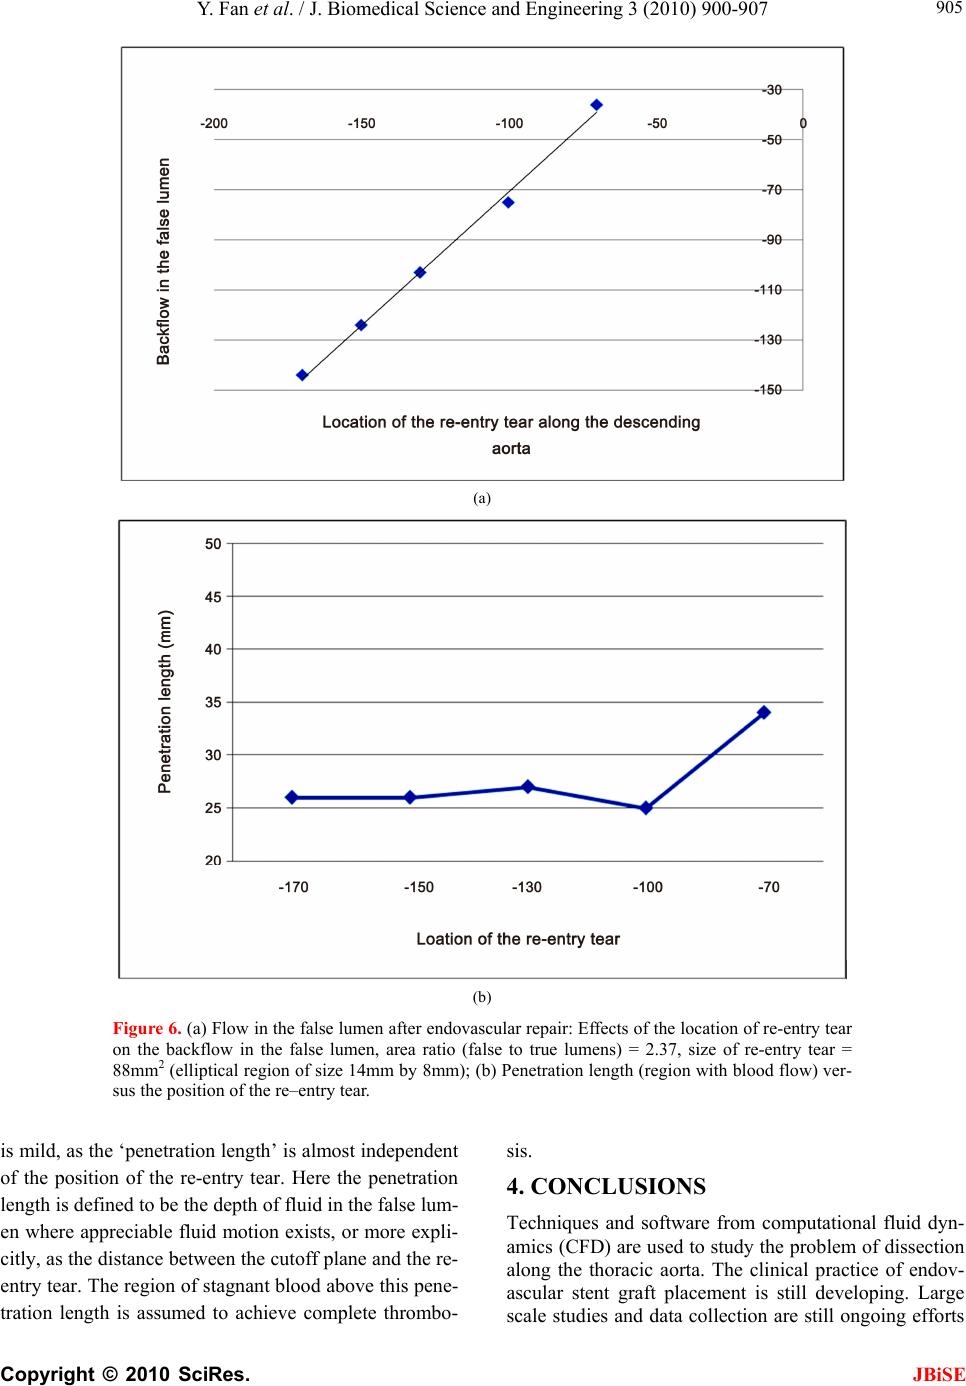 Y. Fan et al. / J. Biomedical Science and Engineering 3 (2010) 900-907 Copyright © 2010 SciRes. JBiSE 905 (a) (b) Figure 6. (a) Flow in the false lumen after endovascular repair: Effects of the location of re-entry tear on the backflow in the false lumen, area ratio (false to true lumens) = 2.37, size of re-entry tear = 88mm2 (elliptical region of size 14mm by 8mm); (b) Penetration length (region with blood flow) ver- sus the position of the re–entry tear. is mild, as the ‘penetration length’ is almost independent of the position of the re-entry tear. Here the penetration length is defined to be the depth of fluid in the false lum- en where appreciable fluid motion exists, or more expli- citly, as the distance between the cutoff plane and the re- entry tear. The region of stagnant blood above this pene- tration length is assumed to achieve complete thrombo- sis. 4. CONCLUSIONS Techniques and software from computational fluid dyn- amics (CFD) are used to study the problem of dissection along the thoracic aorta. The clinical practice of endov- ascular stent graft placement is still developing. Large scale studies and data collection are still ongoing efforts  Y. Fan et al. / J. Biomedical Science and Engineering 3 (2010) 900-907 Copyright © 2010 SciRes. JBiSE 906 [17-19]. CFD study is appealing, as the cost is relatively low, and obviously poses no risk to the patients. The main goals of this work are to help the clinicians (a) to assess the potential of rupture of the false lumen, and (b) to determine the need of undertaking secondary procedure. CFD [20-23] is employed here to assess the extent of thrombosis in the false lumen after endovascu- lar repair, and the working assumption is that an absence of flow will lead to complete thrombosis of the blood. After consultation with clinicians, three main biome- chanical factors are identified and investigated. Firstly, the dependence on the area ratios of the lumens is stud- ied. The main result is that patients with a smaller false lumen should be at a lower risk, as the domain of stag- nant fluid / complete thrombosis is larger. Secondly, a larger re-entry tear typically leads to lar- ger region of blood in motion. This is consistent with fluid physics, as a smaller aperture means larger viscous resistance in the flow through re-entry tear, and thus a smaller flow rate. Consequently, a larger re-entry tear is probably undesirable. Thirdly, the extent of blood in mo- tion is almost independent of the position of the re-entry tear along the descending aorta. In conclusions, the area ratio of the lumens and the si- ze of the re-entry tear are thus critical factors. These are indeed features vascular surgeons study from the com- puted tomography (CT) images of the patients. Hence CFD studies should complement clinicians’ assessment of the risk and treatment procedures of the patients. Finally, further research on a) other biomechanical factors, e.g. varying blood pre- ssure and modeling of a partially patent false lumen, and b) improving the fluid physics modeling, e.g. incorp- orating non–Newtonian effects will definitely generate new scientific results and improve the management of this cardiovascular disease [24,25]. REFERENCES [1] Pedley, T.J. (1980) The fluid mechanics of large blood vessels. Cambridge University Press, Cambridge. [2] Fung, Y.C. (1997) Biomechanics: Circulation. 2nd Edi- tion, Springer, Berlin. [3] Morris, L., Delassus, P., Callanan, A., Walsh, M., Wallis, F., Grace, P. and McGloughlin, T. (2005) 3–D numerical simulation of blood flow through models of the human aorta. Journal of Biomechanical Engineering – Transac- tions of ASME, 127(5), 767-775. [4] Ricotta. J.J., Pagan, J., Xenos, M., Alemu, Y., Einav, S. and Bluestein, D. (2008) Cardiovascular disease man- agement: The need for better diagnostics. Medical & Bio- logical Engineering & Computing, 46(11), 1059-1068. [5] El Zahab, Z., Divo, E. and Kassab, A. (2010) Minimizat- ion of the wall shear stress gradients in bypass grafts ana- stomoses using meshless CFD and genetic algorithms optimization. Computer Methods in Biomechanics and Biomedical Engineering, 13(1), 35-47. [6] Hassani, K., Navidbakhsh, M. and Rostami, M. (2007) Modeling of the aorta artery aneurysms and renal artery stenosis using cardiovascular electronic systems. Bio- medical Engineering Online, 6(1), 22-31. [7] Qiao, A. and Liu, Y. (2008) Medical application oriented blood flow simulation. Clinical Biomechanics, 23(Suppl 1), 130- 136. [8] Hong, J., Wei, L., Fu, C. and Tan, W. (2008) Blood flow and macromolecular transport in complex blood vessels. Clinical Biomechanics, 23(Suppl 1), 125-129. [9] Molla, M.M., Paul, M.C. and Roditi, G. (2010) LES of additive and non–additive pulsatile flows in a model arte- rial stenosis. Computer Methods Biomechanics and Bio- medical Engineering, 13(1), 105-120. [10] Cigarroa, J.E., Isselbacher, E.M., DeSanctis, R.W. and Eagle, K.A. (1993) Diagnostic—Imaging in the evalua- tion of suspected aortic dissection—Old standards and new directions. New England Journal of Medicine, 328(1), 35-43. [11] Nienaber, C.A., Fattori, R., Lund, G., Dieckmann, C., Wolf, W., von Kodolitsch, Y., Nicolas, V. and Pierangeli, A. (1999) Nonsurgical reconstruction of thoracic aortic dissection by stent-graft placement. New England Jour- nal of Medicine, 340(20), 1539-1545. [12] Dake, M.D., Kato, N., Mitchell, R.S., Semba, C.P., Razavi, M.K., Shimono, T., Hirano, T., Takeda, K., Ya- da, I. and Miller, D.C. (1999) Endovascular stent-graft placement for the treatment of acute aortic dissection. New England Journal of Medicine, 340(20), 1546-1552. [13] Tsai, T.T., Schlicht, M.S., Khanafer, K., Bull, J.L., Valassis, D.T., Williams, D.M., Bergner, R. and Eagle, K.A. (2008) Tear size and location impacts false lumen pressure in an ex vivo model of chronic type B aortic dis- section. Journal of Vascular Surgery, 47(4), 844-851. [14] Tsai, T.T., Evangelista, A., Nienaber, C.A., Myrmel, T., Meinhardt, G., Cooper, J.V., Smith, D.E., Suzuki, T., Fattori, R., Llovet, A., Froehlich, J., Hutchison, S., Dista- nte, A., Sundt, T., Beckman, J., Januzzi, J.L., Isselbacher, E.M. and Eagle, K.A. (2007) Partial thrombosis of the false lumen in patients with acute type B aortic dissection. New England Journal of Medicine, 357(4), 349-359. [15] Giannakoulas, G., Giannoglou, G., Soulis, J., Farmakis, T., Papadopoulou, S., Parcharidis, G. and Louridas, G. (2005) A computational model to predict aortic wall str- esses in patients with systolic arterial hypertension. Med- ical Hypothesis, 65(6), 1191-1195. [16] Gao, F., Watanabe, M. and Matsuzawa, T. (2006) Stress analysis in a layered aortic arch model under pulsatile fl- ow. Biomedical Engineering Online, 5, 25-35. [17] Böckler, D., Schumacher, H., Ganten, M., von Tengg-Kobligk, H., Schwarzbach, M., Fink, C., Kauczor, H.U., Bardenheuer, H. and Allenberg, J.R. (2006) Com- plicati- ons after endovascular repair of acute sympto- matic and chronic expanding Stanford type B aortic dis- sections. Jo- urnal of Thoracic and Cardiovascular Sur- gery, 132(2), 361- 368. [18] Eggebrecht, H., Nienaber, C.A., Neuhäuser, M., Baum- gart, D., Kische, S., Schmermund, A., Herold, U., Reh- ders, T.C., Jakob, H.G. and Erbel, R. (2006) Endovascu- lar stent – graft placement in aortic dissection: A meta– analysis. European Heart Journal, 27(4), 489-498.  Y. Fan et al. / J. Biomedical Science and Engineering 3 (2010) 900-907 Copyright © 2010 SciRes. 907 JBiSE [19] Nienaber, C.A., Kische, S., Zeller, T., Rehders, T.C., Schneider, H., Lorenzen, B., Bünger, C. M. and Ince, H. (2006) Provisional extension to induce complete attach- ment after stent-graft placement in type B aortic dissec- tion: The PETTICOAT concept. Journal of Endovascu- lar Therapy, 13(6), 738-746. [20] Wen, C.Y., Yang, A.S., Tseng, L.Y. and Chai, J.W. (2010) Investigation of pulsatile flowfield in healthy tho- racic aorta models. Annals of Biomedical Engineering, 38(2), 391-402. [21] Marzo, A., Singh, P., Reymond, P., Stergiopulos, N., Pat- el, U. and Hose, R. (2009) Influence of inlet boundary conditions on the local haemodynamics of intracranial aneurysms. Computer Methods in Biomechanics and Bio- medical Engineering, 12(4), 431-444. [22] Balossino, R., Pennati, G., Migliavacca, F., Formaggia, L., Venezziani, A., Tuveri, M. and Dubini, G. (2009) Co- mputational models to predict stenosis growth in carotid arteries: Which is the role of boundary conditions? Com- puter Methods in Biomechanics and Biomedical Engi- neering, 12(1), 113-123. [23] Lam, S.K., Fung, G. S.K., Cheng, S. W.K. and Chow, K.W. (2008) A computational study on the biomechanic- al factors related to stent-graft models in the thoracic aorta. Medical & Biological Engineering & Computing, 46(11), 1129-1138. [24] Xu, X.Y. and Collins, M.W. (1995) Numerical modeling of blood flow in compliant arteries and arterial bifurca- tions. In: Power, H. Ed., Biofluid Mechanics, Computa- tional Mechanics Publications, Southampton, 55-93. [25] Shibeshi, S.S. and Collins, W.E. (2005) The rheology of blood flow in a branched arterial system. Applied Rheol- ogy, 15(6), 398-405. [26] Wang, D. and Bernsdorf, J. (2009) Lattice Boltzmann simulation of steady non-Newtonian blood flow in a 3D generic stenosis case. Computer and Mathematics in Ap- plications, 58(5), 1030-1034. [27] Khoynezhad, A., Donayre, C.E., Omari, B.O., Kopchok, G.E., Walot, I. and White, R.A. (2009) Midterm results of endovascular treatment of complicated acute type B ao- rtic dissection. Journal of Thoracic and Cardiovascular Surgery, 138(3), 625-631. [28] Ting, A.C.W., Cheng, S.W.K. and Ho, P. (2003) End- oluminal stent grafts for aortic diseases: Experience at a major teaching hospital in Hong Kong. Australian and New Zealand Journal of Surgery, 73(3), 100-104. |