Paper Menu >>
Journal Menu >>
 Engineering, 2013, 5, 174-179 doi:10.4236/eng.2013. 51b032 Published Online January 2013 (http://www.SciRP.o rg/journal/eng) Copyright © 2013 SciRes. ENG Operation Indices for Sm art Power Di spat ch Center Design Jianing Liu1, Puming Li1, Jin Zhong2, Liang Liang2 1Power Dispatch Center, Guangdong Power Grid Co., Guangzhou, China 2Department of Electrical & Electronic Engineering, The University of Hong Kong, Hong Kong, China Email: jzhong@eee.hku.hk Received 2013 Abstract With t he deve lopment of po wer sys tems, po wer grid within a control area becomes much more complicated due to in- creasing number of nodes and renewable energy interconnections. The role of power system control center is more crit- ical in maintaining system reliable and security operations. Latest developed information and communication technolo- gies provide a platform to enhance the functions and performance of power system control center. Smart power dispatch concept will be the trend of future control center development. In this paper, we start from the human factors of control center design and propose operation indices to reduce the information presented to the system operator. The operation indices will b e t he impo rtant c rite ria in situatio n a warene ss o f a po wer grid. Pa st, pr esent, future a nd cap abilit y sta tes o f a power grid are also proposed to provide better visions to the operator of system conditions. The basic ideas of opera- tion indices and operation states are discussed in the paper. In the end, the design factors for a power dispatch cockpit are discussed. Keywords: Control Center; Power Dispatch; Operation In dex ; Power System Operati on ; Human Factors; Power Dispatch Cockpit. 1. Introduction Control ce nter is the so ul of a po wer system for it s oper- ations. The task o f control center is to maintain real-time balancing of power supply and demand while achieve the security, reliability and economic requirements of power system operation. The concept of smart grid was raised after the 2003 North American blackout. The purpose of smart grid is to upgrade existing power systems with latest communication, power electronics and control technologies [1]. Besides the upgrading of power genera- tion, transmissio n and distributio n facilities, a smart con- trol center usin g latest tec hnologies i s essential for future smart grid. The development of control center used to follow the requirement of power system operation and management, while updated with the development of communication technologies. In a smart grid, the func- tions of a control center and the way of power dispatch will have an essential change to adapt newly developed smart grid. The development of supervisory control and data ac- quisition (SCADA) system could be traced back to the 1965 blackout of New York [2]. Power system mea- surement and monitoring system was developed. Later, advanced applications like security analysis, load fore- casting, generation scheduling, and contingency analysis were developed. With the monitorin g data fro m SCAD A and the advanced applications, energy management sys- tem (EMS) was deployed. The SCADA/EMS system has been used in almost all power control centers in the world fo r p o wer s yst e m moni t o ri ng, a nal ys i s a nd control. The basic concepts and framework of SCADA/EMS were deployed in 1970s-1980s [3]. The upgrading in recent years is mainly focus on software implementation, visualization and communication [4-6]. Much more data and information is available to the system operator with the upgrading of communication and data acquisition met hod s. With the latest gener atio n of SCAD A/EMS, t he system operator is facing a huge amount of data, both real-time and offline data. The data available to the sys- tem operator have been increased exponentially. Howev- er, the design concept of EMS still keep the same as be- fore, the system operator monitors operation data and needs to make operation decisions in the emergent situa- tion according to their experiences or base on the calcu- lation results of off-line decision tools. The design framework works well in the past, as the amount of data  J. N. LIU ET AL. Copyright © 2013 SciRes. ENG 175 available to the operator is limited. Nowadays, plenty of data acquired from SCADA system is available to the system operator. In contingency situations, it is hard for the syste m oper ator to quickly locate useful infor mation, analyze power flow distribution, re-allocate power flow and modify network topology. Although latest EMS sys- tems have better analytical abilities, manual operations from system operators are still necessary. To safely op- erate a complicated system as large-scale power system, human factors and visualizations techniques need to be considered in the design of control center to improve t he per for ma nce a nd d ec isi o n ma ki ng by t he s yste m operator in emergent situat ions. In this paper, we will discuss the philosophy of control center design considering human factors and ergonomics. To simplify the data faced to the system operator, we will propose several important operation indices for the syste m operator to make quick decisions. In the end, the concept of dispatch cockpit for a power system control center will be presented. 2. Control Center Design Issues 2.1. Man-Machine Model Power system is the most complicated system in the world not only because of its large amount of bus-bars, generation and transmission devices. In different opera- tion states, voltage and power parameters are different, and they indicate the trend of future states. Automatic breaker actions due to fault events or overloading c hange the topology of the network. The large number of devic- es and the real-time changing of operation states produce a lot of real-time information to the system operator, whose work is to receive information and act on the basis of the information to control the system. This is a man-machine model. A well designed interface and framework of a man-machine model could significantly improve the ef- ficiency of the control system. Especially during the emergency states, quick and correct actions to the events are very important. The issue in power system control center is that the system operator needs to handle too much information in very short time to react to emer- genc y situation. A clear i nd ic ation of operation states and simplified (after analysis) information could release the pressure to the system operator and help them to make quick dec isions. 2.2. Visualization and Human Factors in Control Centers The man-machine interaction has been applied in the de- sign of EMS and power system contr ol center. For e xam- ple, one-line diagram, 2-D visualization and geographic information are used to display the power grid. Multiple screens are used for displaying of grid topology in mul- tiple layers. 3-D visualization and animation are also proposed for power system analysis [7], which could eas- ily indicate severe voltage problem or over-loading. Vi- sualization software is also developed to display power flow and ope ration data i n a use r -friendly interface [8]. A Web-based tool with flexible open data structure is pro- posed to serve as a platform for power system visualiza- tion [9]. I n 1980s, human factors have been considered in the design of dispatch control centers for utilities to overcome stressful situations in system operations [10]. The major states of power system operations are normal, degraded, and restorative. Therefore, the operator’s activ- ities can be categorized as pre-dispatch, dispatch and post-dispatch. Raw data needs to be converted to useful necessary information for three different time lines. 3. Operati on Indices for Diff erent Operati on States 3.1. Operation States for Power System Dispatch In traditional power system dispatch and state estimation, system operations states are classified as normal, de- graded and restorative states. With our operation expe- riences of a large-scale power grid, fours states with sim- ple indices are proposed. The four states are past state, present state, future state and capability state. For present state, it shows current situation of the system, for example, whether it is normal state, abnormal state or in emergent. The present state will become past state with time passing. The future state is calculated based on the system fore- casting result, current system parameters and raw data. Analytical tools need to be used to calculate the state pa- rameters of present and future states. Capability state shows the stability capability of a system. It is somewhere between present state and future state. The definition and calculation of the state are based on the system reserve, loading margin, e tc. T he four states and its times lines are shown in Figure 1. For present and future states, each of them has normal, abnormal and emergent states. The rela- tionship and interaction between the normal, abnormal and emergent states are show as in Figure 2. Past state Present state Future state Capability state Past FuturePresent Figure 1 . Four states with timelines 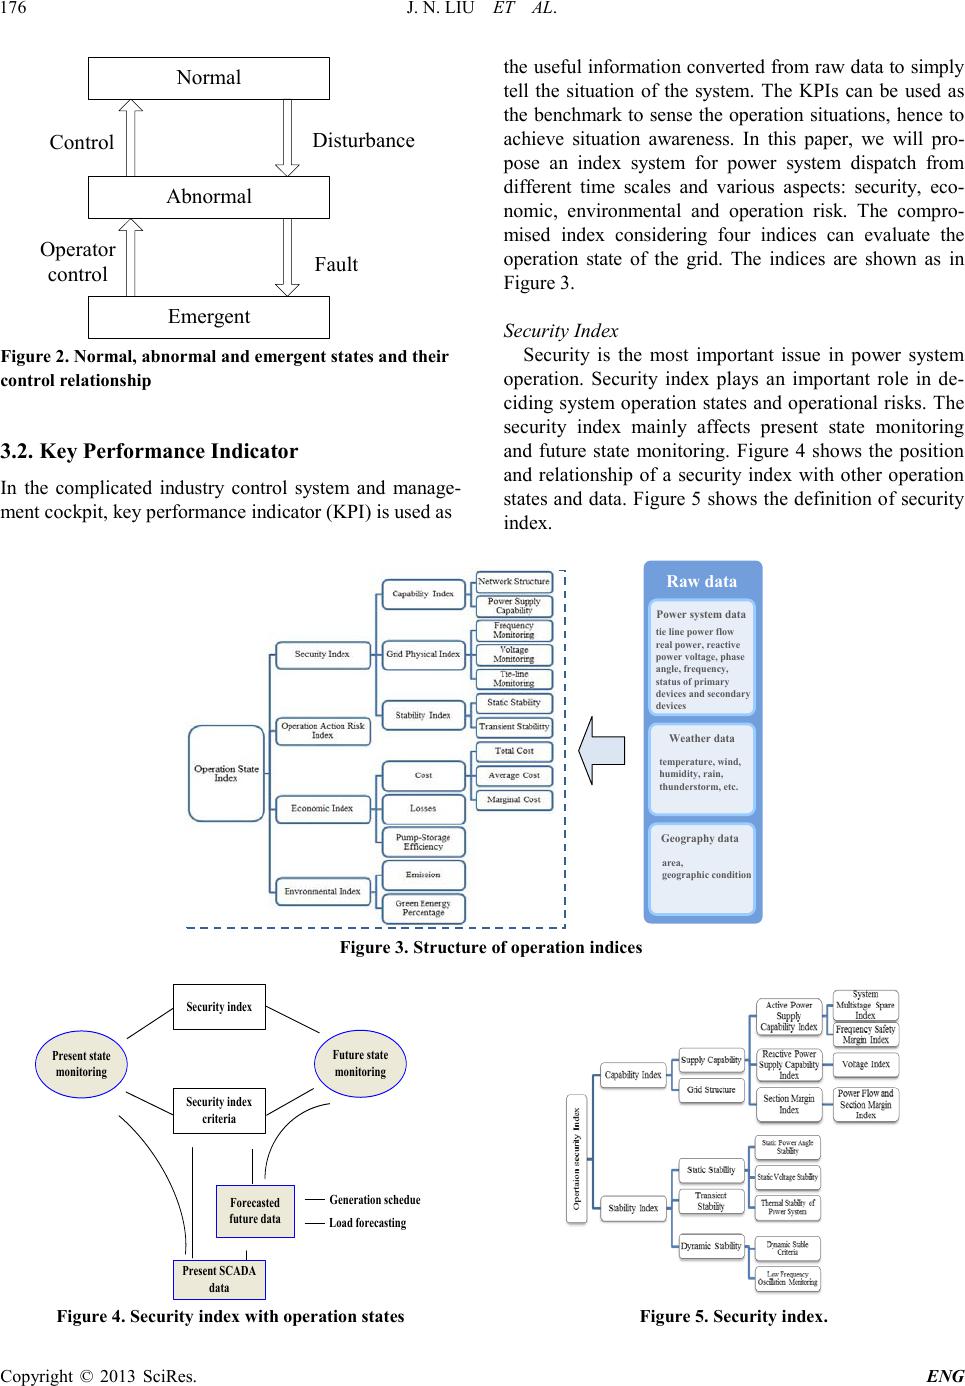 J. N. LIU ET AL. Copyright © 2013 SciRes. ENG 176 Normal Abnormal Emergent Disturbance Fault Operator control Control Figure 2. Normal, abnormal an d emergent states and t heir control relationship 3.2. Key Performance Indi cat or In the complicated industry control system and manage- ment cockpit, key performance indicat o r (KPI) is used as the useful infor matio n converted from raw data to simply tell the situation of the system. The KPIs can be used as the benchmark to sense the operation situations, hence to achieve situation awareness. In this paper, we will pro- pose an index system for power system dispatch from different time scales and various aspects: security, eco- nomic, environmental and operation risk. The compro- mised index considering four indices can evaluate the operation state of the grid. The indices are shown as in Figure 3. Security Index Security is the most important issue in power system operation. Security index plays an important role in de- ciding syste m oper ation states and operational ris ks. T he security index mainly affects present state monitoring and future state monitoring. Figure 4 shows the position and relationship of a security index with other operation states and da ta. Figure 5 sho ws t he definition of security index. Raw data Power system data Weather data Geography data tie line power flow real power, reactive power voltage, phase angle, frequency, status of primary devices and secondary devices temperature, wind, humidity, rain, thunderstorm, etc. area, geographic condition Figure 3. Structure of operation indices Security index Security index criteria Present state monitoring Future state monitoring Present SCADA data Forecasted future data Generation schedue Load forecasting Figure 4. Security index wi th operation states Figure 5. Security index . 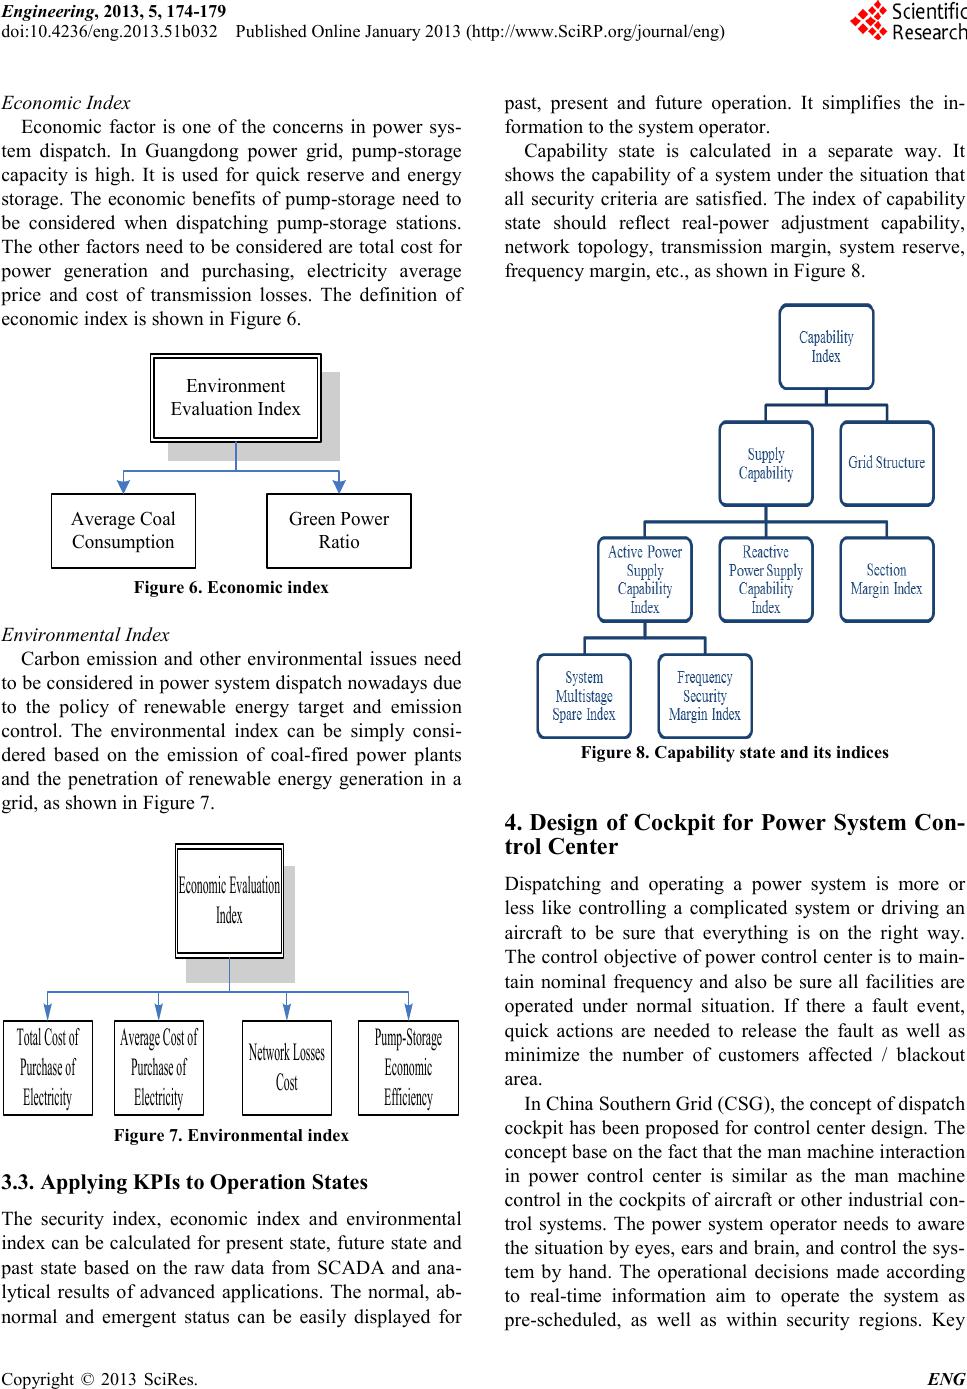 Engineering, 2013, 5, 174-179 doi:10.4236/eng.2013. 51b032 Published Online January 2013 (http://www.SciRP.o rg/journal/eng) Copyright © 2013 SciRes. ENG Economic Index Economic factor is one of the concerns in power sys- tem dispatch. In Guangdong power grid, pump-storage capacity is high. It is used for quick reserve and energy storage. The economic benefits of pump-storage need to be considered when dispatching pump-storage stations. The other factors need to be considered are total cost for power generation and purchasing, electricity average price and cost of transmission losses. The definition of eco nomic ind ex is s hown in F igure 6. Environment Evaluation Index Average Coal Consumption Green Power Ratio Figure 6. Economic index Environmental Index Carbon emission and other environmental issues need to be considered in power system dispatch nowadays due to the policy of renewable energy target and emission control. The environmental index can be simply consi- dered based on the emission of coal-fired power plants and the penetration of renewable energy generation in a grid , as shown in Figure 7. Economic Evaluation Index Average Cost of Purchase of Electricity Network Losses Cost Total Cost of Purchase of Electricity Pump-Storage Economic Efficiency Figure 7. Enviro nmental index 3.3. Applying KPIs to Operation States The security index, economic index and environmental index can be calculated for present state, future state and past state based on the raw data from SCADA and ana- lytical results of advanced applications. The normal, ab- normal and emergent status can be easily displayed for past, present and future operation. It simplifies the in- formation to the system operator. Capability state is calculated in a separate way. It shows the capability of a system under the situation that all security criteria are satisfied. The index of capability state should reflect real-power adjustment capability, network topology, transmission margin, system reserve, freq uenc y margin, etc., a s sho wn in F igure 8. Figure 8. Capability state and its indices 4. Design of Cockpit for Power System Con- trol Center Dispatching and operating a power system is more or less like controlling a complicated system or driving an aircraft to be sure that everything is on the right way. The control objective of power control center is to main- tain nominal frequency and also be sure all facilities are operated under normal situation. If there a fault event, quick actions are needed to release the fault as well as minimize the number of customers affected / blackout area. In China S outhern G rid (CS G) , the concept of dis patch cockpit has been proposed for control center design. The concept base on the fact that the man machine interaction in power control center is similar as the man machine control in the co ckpits of aircra ft or other industrial co n- trol systems. The power system operator needs to aware the si tuatio n by e yes, ea rs and brai n, and c ontro l the sys- tem by hand. The operational decisions made according to real-time information aim to operate the system as pre-scheduled, as well as within security regions. Key 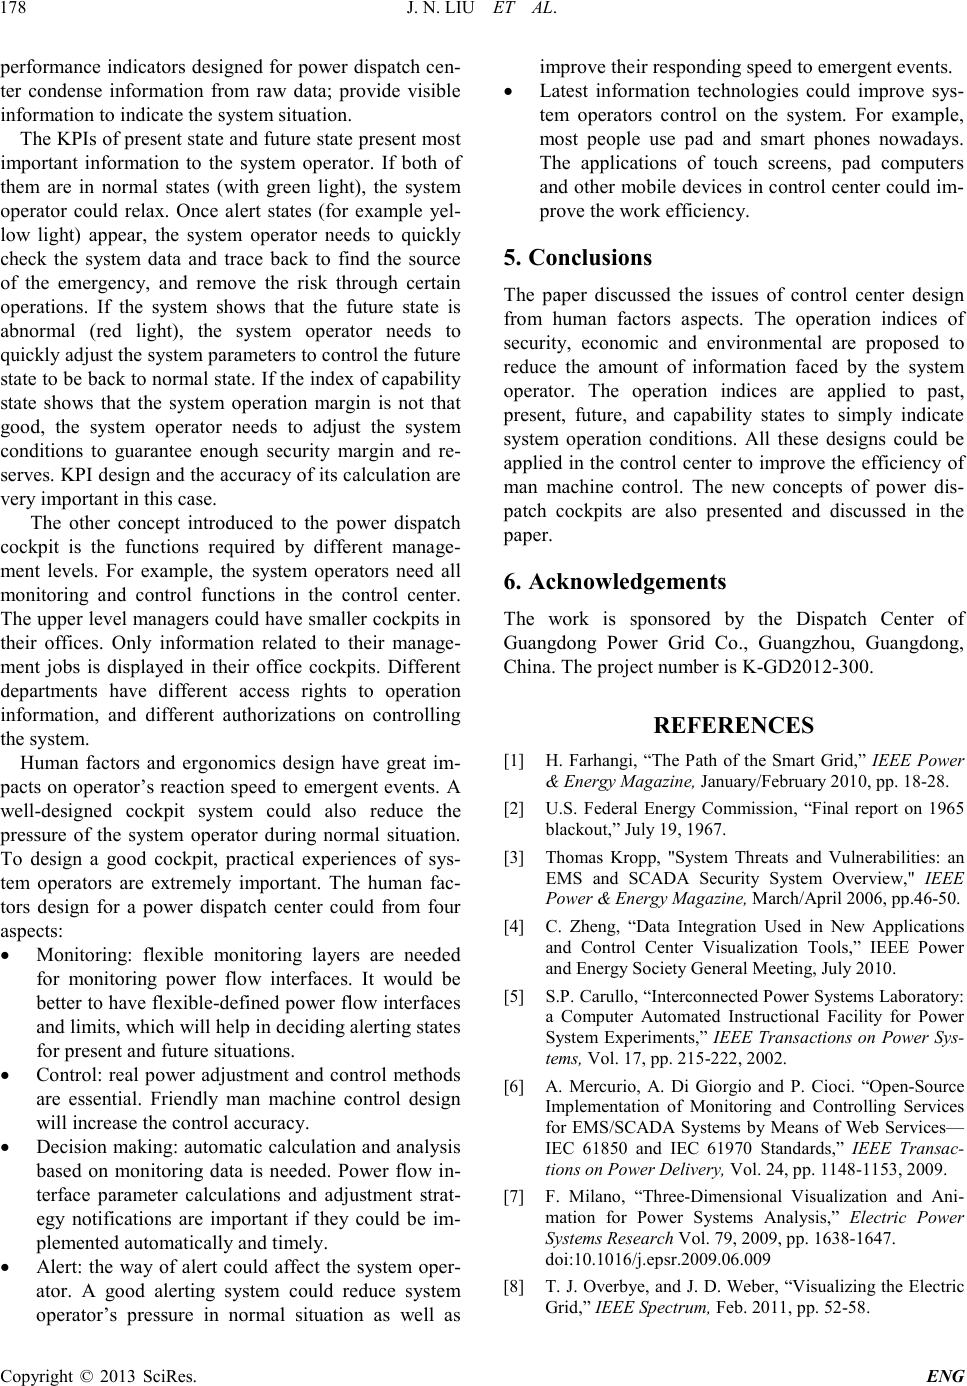 J. N. LIU ET AL. Copyright © 2013 SciRes. ENG 178 performance indicators designed for power dispatch cen- ter condense information from raw data; provide visible information to i nd ic a te the system situation. The KPIs of present state and future state present most important information to the system operator. If both of them are in normal states (with green light), the system operator could relax. Once alert states (for example yel- low light) appear, the system operator needs to quickly check the system data and trace back to find the source of the emergency, and remove the risk through certain operations. If the system shows that the future state is abnormal (red light), the system operator needs to quickly adjust the system parameters to contr ol the future state to be back to normal state. If the index of capability state shows that the system operation margin is not that good, the system operator needs to adjust the system conditions to guarantee enough security margin and re- serves. KPI design and the accurac y of its calculation are very import ant i n this case. The other concept introduced to the power dispatch cockpit is the functions required by different manage- ment levels. For example, the system operators need all monitoring and control functions in the control center. The upper level managers could have smaller cockpits in their offices. Only information related to their manage- ment jobs is displayed in their office cockpits. Different departments have different access rights to operation information, and different authorizations on controlling the s ys tem. Human factors and ergonomics design have great im- pacts on operator’s reaction speed to emerge nt event s. A well-designed cockpit system could also reduce the pressure of the system operator during normal situation. To design a good cockpit, practical experiences of sys- tem operators are extremely important. The human fac- tors design for a power dispatch center could from four aspects: • Monitoring: flexible monitoring layers are needed for monitoring power flow interfaces. It would be better to have flexible -defined power flow interfaces and limits, which will help in deciding aler ting states for pres ent and future situations. • Control: real power adjustment and control methods are essential. Friendly man machine control design will increase the control accurac y. • Decision making: automatic calculation and analysis based on monitoring data is needed. Power flow in- terface parameter calculations and adjustment strat- egy notifications are important if they could be im- plemented automatically and t imely. • Alert: the way of alert could affect the system oper- ator. A good alerting system could reduce system operator’s pressure in normal situation as well as improve their responding speed to emergent events. • Latest information technologies could improve sys- tem operators control on the system. For example, most people use pad and smart phones nowadays. The applications of touch screens, pad computers and other mobile d evices in contro l center could im- prove the work ef fi cienc y. 5. Conclusions The paper discussed the issues of control center design from human factors aspects. The operation indices of security, economic and environmental are proposed to reduce the amount of information faced by the system operator. The operation indices are applied to past, present, future, and capability states to simply indicate system operation conditions. All these designs could be applied in the co ntrol center to improve the efficie ncy of man machine control. The new concepts of power dis- patch cockpits are also presented and discussed in the paper. 6. Acknowledgements The work is sponsored by the Dispatch Center of Guangdong Power Grid Co., Guangzhou, Guangdong, China. The project number is K-GD2012-300. REFERENCES [1] H. Farhangi, “The Path of the Smart Grid,” IEEE Power & Energy Magazine, January/February 2010, pp. 18-28. [2] U.S. Federal Energy Commission, “Final report on 1965 blackout,” July 19, 1967. [3] Thomas Kropp, "System Threats and Vulnerabilities: an EMS and SCADA Security System Overview," IEEE Power & Energy Magazine, March/April 2006, pp.46-50. [4] C. Zheng, “Data Integration Used in New Applications and Control Center Visualization Tools,” IEEE Power and Ener gy Society General Meeting, July 2010. [5] S.P . Caru llo, “Int erconn ected Power S ystems Lab orato ry: a Computer Automated Instructional Facility for Power Syst em Experiments,” IEEE Transactions on Power Sys- tems, V ol. 17 , pp. 215-222, 2002 . [6] A. Mercurio, A. Di Giorgio and P. Cioci. “Open-Source Implementation of Monitoring and Controlling Services for EMS/SCADA Systems b y Means of Web Services— IEC 61850 and IEC 61970 Standards,” IEEE Transac- tions on Power D elivery, Vol. 24, pp. 1148-1153, 2009. [7] F. Milano, “Three-Dimensional Visualization and Ani- mation for Power Systems Analysis,” Electric Power Systems R es earch Vol. 79, 2009, pp. 16 38-1647. doi:10.1016/j.epsr.2009.06.009 [8] T. J. Overb ye, and J. D. Weber, “V isualizin g the Electric Grid,” IEEE Spectrum, Feb. 2011, pp. 52-58.  J. N. LIU ET AL. Copyright © 2013 SciRes. ENG 179 [9] F. Li, “Web Tool Opens Up Power System Visualiza- tion,” IEEE Power & Energy Magazine, July/August 2003, pp . 37-41. [10] C. J. Frank, R. A. Bednarik, K. N. Zadeh , H. D. McNai r, and C. J. Goddard, “Dispatch Control Center Human Factors – Revisited,” IEEE Transactions on Power Ap- paratus and Systems, Vol. PAS-104, No. 6, June 1985, pp. 1294-1299. |