Paper Menu >>
Journal Menu >>
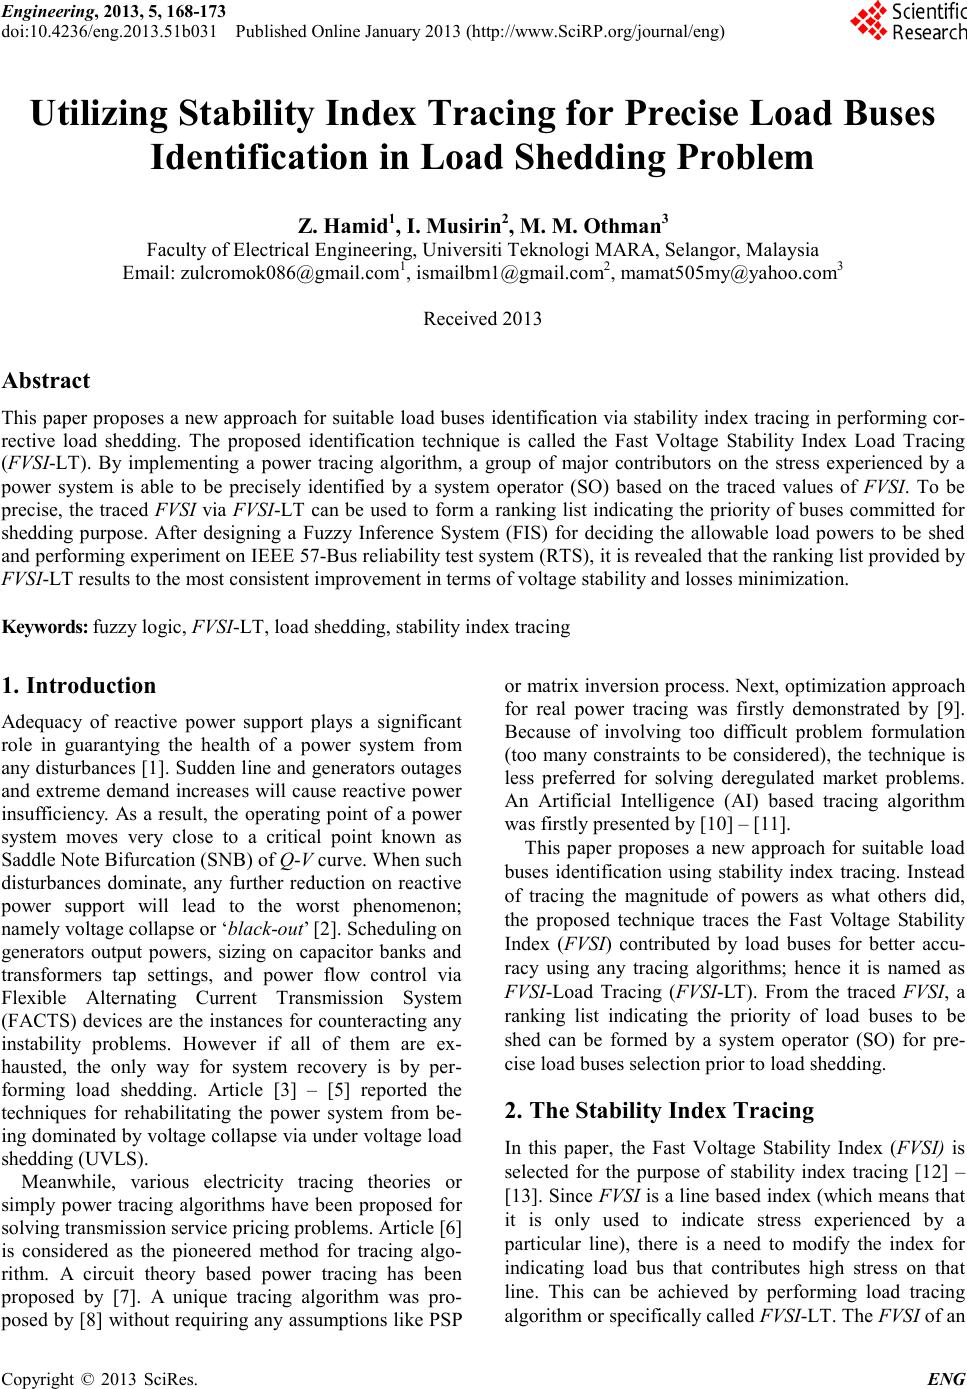 Engineering, 2013, 5, 168-173 doi:10.4236/eng.2013.51b031 Published Online January 2013 (http://www.SciRP.org/journal/eng) Copyright © 2013 SciRes. ENG Utilizing Stability Index Tracing for Precise Load Buses Identification in Load Shedding Problem Z. Hamid1, I. Musirin2, M. M. Othman3 Faculty of Electrica l Engineering, Uni ver siti Teknologi MAR A, Selangor, Malaysia Email: zulcromok086@gmail.com1, ismailbm1@gmail.com2, mamat505my@yahoo.com3 Received 2013 Abstract This pap er propo ses a new approach for suitable load buses id entificatio n via stability index tracing in performing cor- rective load shedding. The proposed identification technique is called the Fast Voltage Stability Index Load Tracing (FVSI-LT). By implementing a power tracing algorithm, a group of major contributors on the stress experienced by a power system is able to be precisely identified by a system operator (SO) based on the traced values of FVSI. To be precise, the traced FVSI via FVSI-LT can be used to form a ranking list indicating the priority of buses committed for shedding purpose. After designing a Fuzzy Inference System (FIS) for deciding the allowable load powers to be shed and performing experiment on IEEE 57-Bus reliability test system (RT S), it is revealed t hat the ra nki ng list pro vided b y FVSI-LT re sults to the most consis te nt improvement in terms of voltage stability and losses minimization. Keywords: fuzzy logic, FVSI-LT, load shedding, stability index trac ing 1. Introduction Adequacy of reactive power support plays a significant role in guarantying the health of a power system from any disturb ance s [1] . Sudd en line and ge nera tors o utages and extreme demand increases will cause reactive power insufficiency. As a result, the operating point of a power system moves very close to a critical point known as Saddle No te Bifurcation (S NB) of Q-V cur ve. Whe n such disturbances dominate, any further reduction on reactive power support will lead to the worst phenomenon; namely voltage collapse or ‘black-out’ [2]. Scheduling on generators output powers, sizing on capacitor banks and transformers tap settings, and power flow control via Flexible Alternating Current Transmission System (FACTS) devices are the instances for counteracting any instability problems. However if all of them are ex- hausted, the only way for system recovery is by per- forming load shedding. Article [3] – [5] reported the techniques for rehabilitating the power system from be- ing do mina ted b y vol tage c ollapse via under voltage load shedding (UVLS). Meanwhile, various electricity tracing theories or simply power tracing algorithms have been proposed for solving tr ansmission service pricing problems. Article [6] is considered as the pioneered method for tracing algo- rithm. A circuit theory based power tracing has been proposed by [7]. A unique tracing algorithm was pro- posed by [8] without requiring any assumptions like PSP or matrix inversion process. Next, optimization approach for real power tracing was firstly demonstrated by [9]. Because of involving too difficult problem formulation (too many constraints to be considered), the technique is less preferred for solving deregulated market problems. An Artificial Intelligence (AI) based tracing algorithm was firstly pr esented by [10] – [11]. This paper proposes a new approach for suitable load buses identification using stability index tracing. Instead of tracing the magnitude of powers as what others did, the proposed technique traces the Fast Voltage Stability Index (FVSI) contributed by load buses for better accu- racy using any tracing algorithms; hence it is named as FVSI-Load Tracing (FVSI-LT). From the traced FVSI, a ranking list indicating the priority of load buses to be shed can be formed by a system operator (SO) for pre- cise load buses selection prior to load shedding. 2. The Stability Index Tracing In this paper, the Fast Voltage Stability Index (FVSI) is selected for the purpose of stability index tracing [12] – [13]. Since FVSI is a line based index (which means that it is only used to indicate stress experienced by a particular line), there is a need to modify the index for indicating load bus that contributes high stress on that line. This can be achieved by performing load tracing algorithm or sp ecificall y calle d FVSI-LT. The FVSI of an 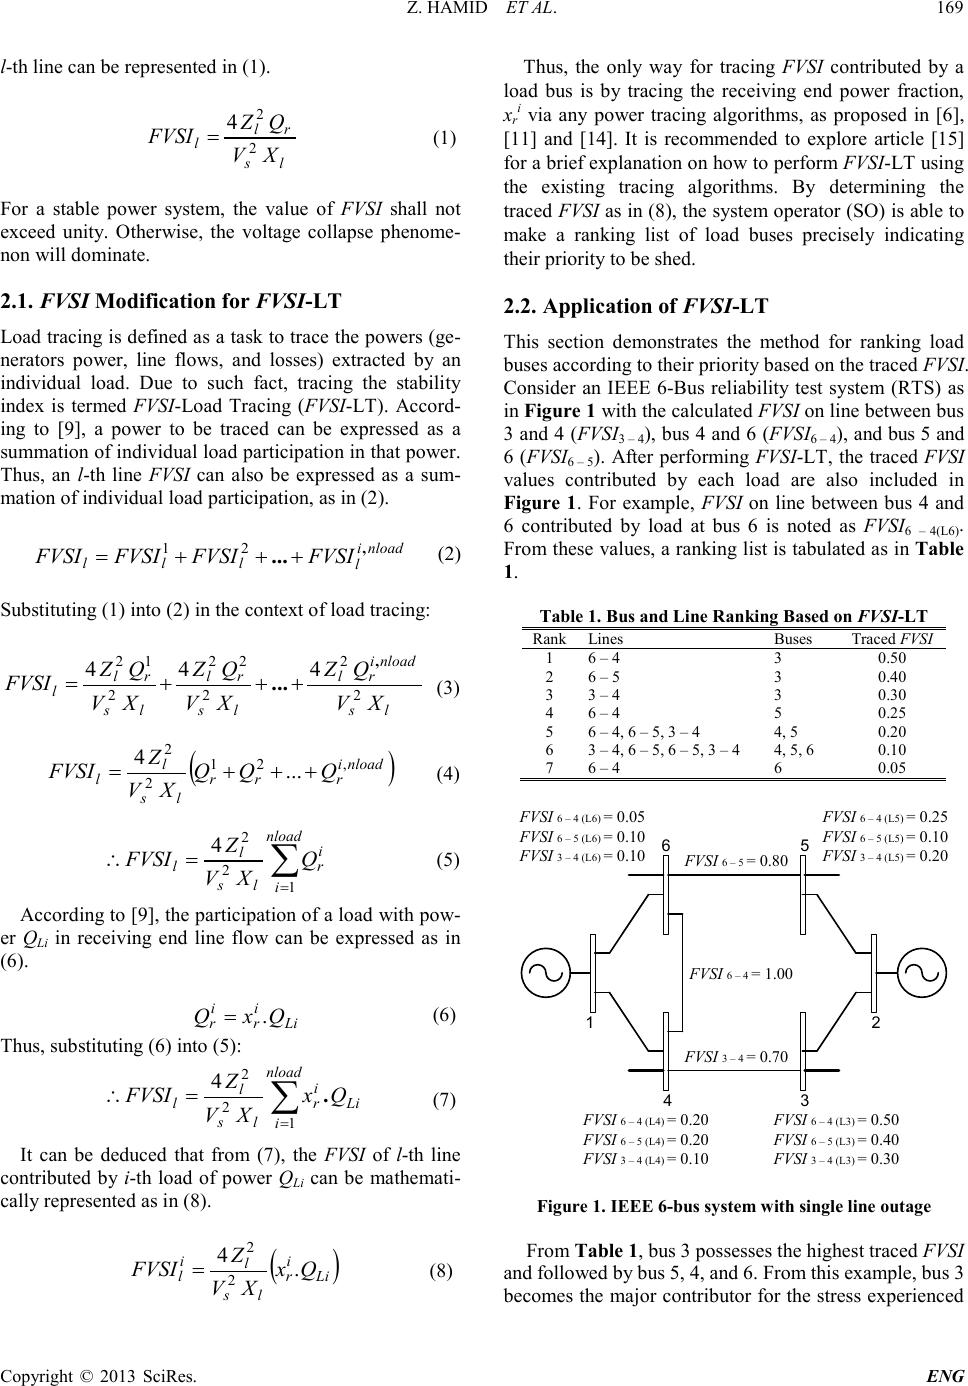 Z. HAMID ET AL . Copyright © 2013 SciRes. ENG 169 l-th line can be represented in (1) . (1) For a stable power system, the value of FVSI shall not exceed unity. Otherwise, the voltage collapse phenome- non will dominate. 2.1. FVSI Modification for FVSI-LT Load tracing is defined as a task to trace t he powers (ge- nerators power, line flows, and losses) extracted by an individual load. Due to such fact, tracing the stability index is termed FVSI-Load Tracing (FVSI-LT). Accord- ing to [9], a power to be traced can be expressed as a summation of indiv idual load p articipa tion in that power. Thus, an l-th line FVSI can also be expressed as a sum- mation of individ ual load participation, as in (2). (2) Substituting (1) into (2 ) in the context of load trac ing: (3) (4) (5) According to [9], the participa tion of a loa d with po w- er QLi in receiving end line flow can be expressed as in (6). (6) Thus, substituting (6) into (5): (7) It can be deduced that from (7), the FVSI of l-th line contributed by i-th load of power QLi can be mathemati- cally represented as in (8). (8) Thus, the only way for tracing FVSI contributed by a load bus is by tracing the receiving end power fraction, xri via any power tracing algorithms, as proposed in [6], [11] and [14]. It is recommended to explore article [15] for a brief explanation on how to perform FVSI-LT using the existing tracing algorithms. By determining the traced FVSI as in (8) , the syst em operator ( SO) is able to make a ranking list of load buses precisely indicating their priority to be shed. 2.2. Application of F VSI-LT This section demonstrates the method for ranking load buses according to their priority based on the traced FVSI. Consider an IEEE 6-Bus reliability test system (RTS) as in Figure 1 with the calculate d FVSI on line between bus 3 and 4 (FVSI3 – 4), bus 4 and 6 (FVSI6 – 4) , and bus 5 and 6 (FVSI6 – 5). After performing FVSI-LT, the traced FVSI values contributed by each load are also included in Figure 1. For example, FVSI on line between bus 4 and 6 contributed by load at bus 6 is noted as FVSI6 – 4(L6). Fro m these value s, a ra nkin g list is tabul ated a s in Table 1. Table 1. Bus and Line R anking Bas e d on FVSI-LT Ran k Lines Bu ses Traced FVSI 1 6 – 4 3 0.50 2 6 – 5 3 0.40 3 3 – 4 3 0.30 4 6 – 4 5 0.25 5 6 – 4, 6 – 5, 3 – 4 4, 5 0.20 6 3 – 4, 6 – 5, 6 – 5, 3 – 4 4, 5, 6 0.10 7 6 – 4 6 0.05 1 6 4 5 3 2 FVSI 6 – 4 = 1.00 FVSI 6 – 4 (L3) = 0.50 FVSI 6 – 5 (L3) = 0.40 FVSI 3 – 4 (L3) = 0.30 FVSI 3 – 4 = 0.70 FVSI 6 – 5 = 0.80 FVSI 6 – 4 (L4) = 0.20 FVSI 6 – 5 (L4) = 0.20 FVSI 3 – 4 (L4) = 0.10 FVSI 6 – 4 (L5) = 0.25 FVSI 6 – 5 (L5) = 0.10 FVSI 3 – 4 (L5) = 0.20 FVSI 6 – 4 (L6) = 0.05 FVSI 6 – 5 (L6) = 0.10 FVSI 3 – 4 (L6) = 0.10 Figure 1. IEEE 6-bus system wit h single line outage From Table 1, bus 3 possesses the highest traced FVSI and f ol l ow e d by bus 5, 4, an d 6. F rom th is e x ample, bus 3 becomes the major contributor for the stress experienced ls rl l XV QZ FVSI 2 2 4 = ( ) Li i r ls l i l Qx XV Z FVSI . 4 2 2 = nloadi l lll FVSIFVSIFVSIFVSI , ...+++= 21 Li i r i r QxQ .= ∑ = =∴ nload i Li i r ls l l Qx XV Z FVSI 1 2 2 4. ls nloadi rl ls rl ls rl lXV QZ XV QZ XV QZ FVSI 2 2 2 22 2 12 444 , ...+++= ( ) nloadi rrr ls l l QQQ XV Z FVSI ,21 2 2 ... 4+++= ∑ = =∴ nload i i r ls l l Q XV Z FVSI 1 2 2 4 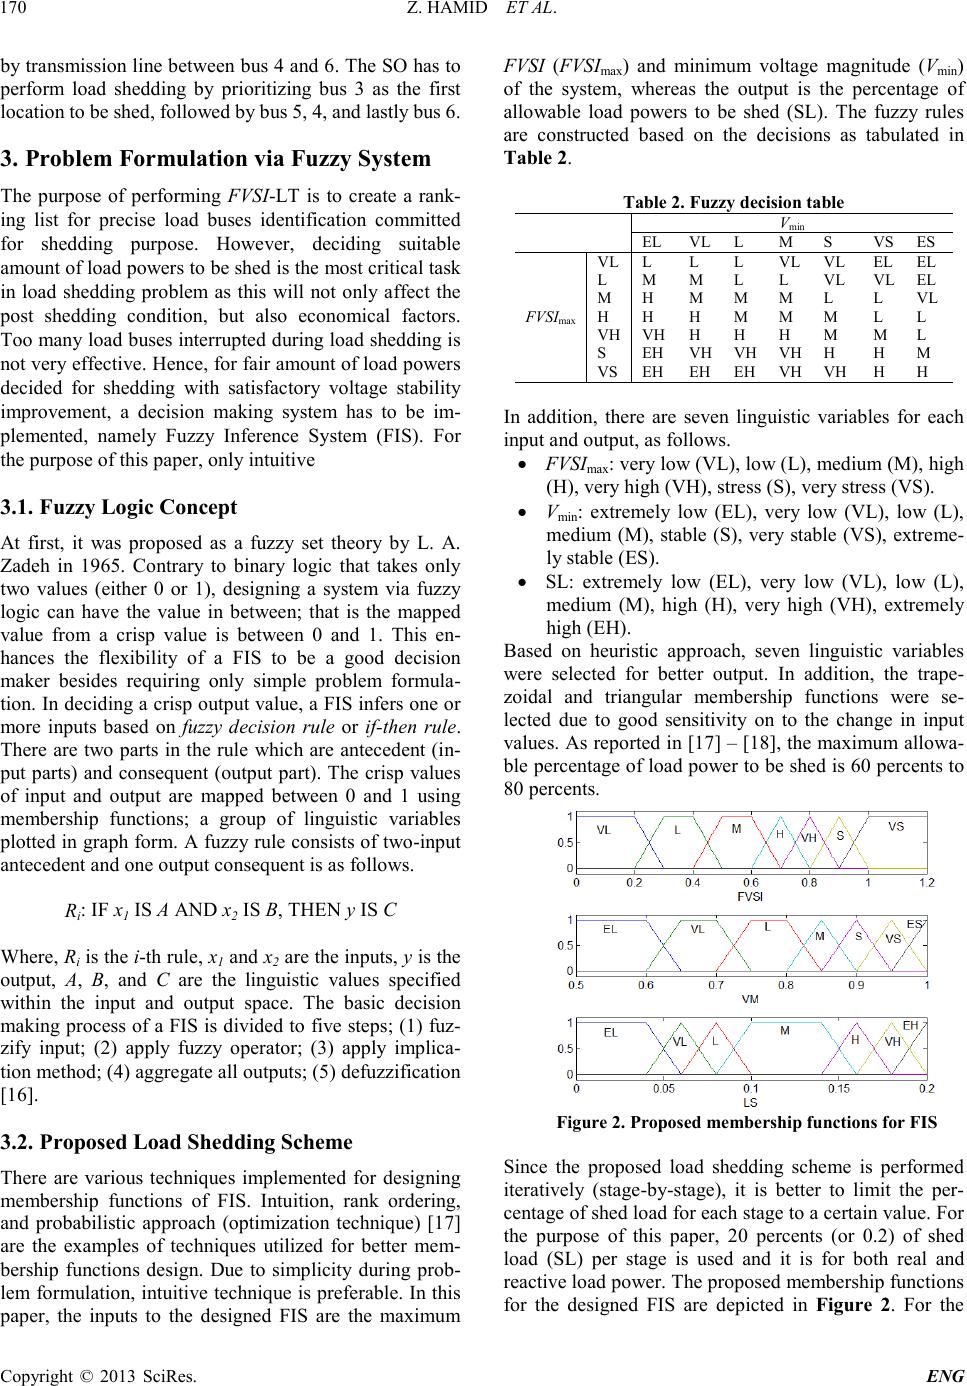 Z. HAMID ET AL . Copyright © 2013 SciRes. ENG 170 by tra nsmis sion li ne bet ween b us 4 and 6. The SO has to perform load shedding by prioritizing bus 3 as the first location t o be s hed, fol l owed by bus 5, 4, and last l y bus 6. 3. Problem Formulation via Fuzzy System The purpose of performing FVSI-LT is to create a rank- ing list for precise load buses identification committed for shedding purpose. However, deciding suitable amount of load powers to b e shed is the most critical task in load shedding problem as this will not only affect the post shedding condition, but also economical factors. Too many load buses inter rupt ed dur ing load shedd ing is not very effective. Hence, for fair amount of load powers decided for shedding with satisfactory voltage stability improvement, a decision making system has to be im- plemented, namely Fuzzy Inference System (FI S). For the purpose of this paper, only intuitive 3.1. Fuzzy Logic Concept At first, it was proposed as a fuzzy set theory by L. A. Zadeh in 1965. Contrary to binary logic that takes only two values (either 0 or 1), designing a system via fuzzy logic can have the value in between; that is the mapped value from a crisp value is between 0 and 1. This en- hances the flexibility of a FIS to be a good decision maker besides requiring only simple problem formula- tion. In deciding a crisp output value, a FIS infers one or more inputs based on fuzzy decision rule or if-then rule. There are two parts in the rule which are antecedent (in- put parts) and consequent (output part). The crisp values of input and output are mapped between 0 and 1 using membership functions; a group of linguistic variables plotted in graph form. A fuzzy rule consists of two-input antecedent and one output con sequent is as follows. Ri: IF x1 IS A AND x2 IS B, THEN y IS C Where, Ri is the i-th rule, x1 and x2 are the inp uts, y is the output, A, B, and C are the linguistic values specified within the input and output space. The basic decision making process of a FIS is divided to five steps; (1) fuz- zify input; (2) apply fuzzy operator; (3) apply implica- tion method; (4) aggregate a ll outputs; ( 5) defuzzi fication [16]. 3.2. Proposed Load Shedding Scheme There are various techniques implemented for designing membership functions of FIS. Intuition, rank ordering, and probabilistic approach (optimization technique) [17] are the examples of techniques utilized for better mem- bership functions design. Due to simplicity during prob- le m for mulatio n, intui tive tec hnique is prefe rable. In this paper, the inputs to the designed FIS are the maximum FVSI (FVSImax) and minimum voltage magnitude (Vmin) of the system, whereas the output is the percentage of allowable load powers to be shed (SL). The fuzzy rules are constructed based on the decisions as tabulated in Table 2. Table 2. Fuzzy decision table V min EL VL L M S VS ES FVSImax VL L L L VL VL EL EL L M M L L VL VL EL M H M M M L L VL H H H M M M L L VH VH H H H M M L S EH VH VH VH H H M VS EH EH EH VH VH H H In addition, there are seven linguistic variables for each input and output, as follows. • FVSImax: ver y lo w (VL), lo w (L), medium (M) , high (H), very high (VH), stress (S), very stress (VS). • Vmin: extremely low (EL), very low (VL), low (L), medium (M), stable (S), very stable (VS), extreme- ly stable (ES). • SL: extremely low (EL), very low (VL), low (L), medium (M), high (H), very high (VH), extremely high (EH). Based on heuristic approach, seven linguistic variables were selected for better output. In addition, the trape- zoidal and triangular membership functions were se- lected due to good sensitivity on to the change in input value s. As rep orted in [17] – [18], the maximum allowa- ble percentage of load power to be shed is 60 percents to 80 percents. Since the proposed load shedding scheme is performed iteratively (stage-by-stage), it is better to limit the per- centage of shed load for each stage to a certain value. For the purpose of this paper, 20 percents (or 0.2) of shed load (SL) per stage is used and it is for both real and reactive load power. The proposed membership functions for the designed FIS are depicted in Figure 2. For the Figure 2 . Proposed membership functions for F IS 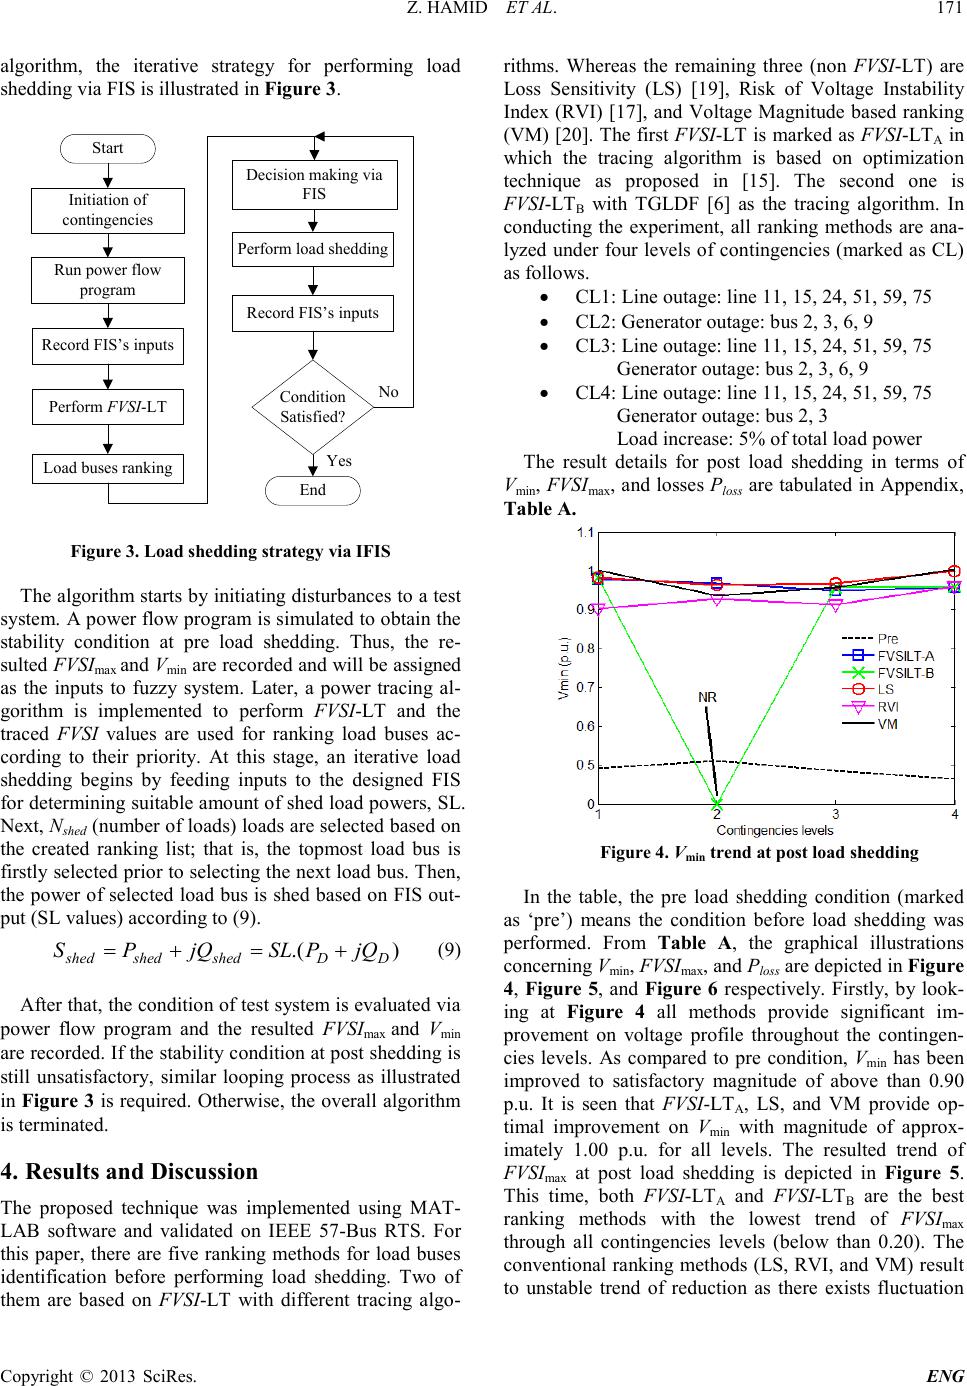 Z. HAMID ET AL . Copyright © 2013 SciRes. ENG 171 algorithm, the iterative strategy for performing load shedding via FIS is illustrated in Figure 3. Initiation of contingencies Condition Satisfied? Start Yes No Run power flow program Perform FVSI-LT Load buses ranking Decision making via FIS Perform load shedding Record FIS’s inputs Record FIS’s inputs End Figure 3. L o ad shedding s trategy via IFIS The algorith m start s by initiating disturba nces to a test system. A power flow program is simulated to obtai n the stability condition at pre load shedding. Thus, the re- sulted FVSImax and Vmin are re corded and will be assigned as the inputs to fuzzy system. Later, a power tracing al- gorithm is implemented to perform FVSI-LT and the traced FVSI values are used for ranking load buses ac- cording to their priority. At this stage, an iterative load shedding begins by feeding inputs to the designed FIS for determining suitable amount of shed load powers, SL. Next, Nshed (number of loads) loads are selected based on the created ranking list; that is, the topmost load bus is firstly selected pr ior to selecting t he next l oad b us. Then, the power of selected load bus is shed based on FIS out- put ( S L values) acc ording to (9). (9) After that, the cond ition of tes t system is eval uate d vi a power flow program and the resulted FVSImax and Vmin are recorded. If the stability condition at post shedding is still unsatisfactory, similar looping process as illustrated in Figure 3 is required. Otherwise, the overall algorithm is terminated. 4. Results and Discussion The proposed technique was implemented using MAT- LAB software and validated on IEEE 57-Bus RTS. For this paper, there are five ranking methods for load buses identification before performing load shedding. Two of them are based on FVSI-LT with different tracing algo- rithms. Whereas the remaining three (non FVSI-LT) are Loss Sensitivity (LS) [19], Risk of Voltage Instability Index (RVI) [17], and Voltage Magnitude based ranking (VM) [20]. The first FVSI-LT is marked as FVSI-LTA in which the tracing algorithm is based on optimization technique as proposed in [15]. The second one is FVSI-LTB with TGLDF [6] as the tracing algorithm. In conducting the experiment, all ranking methods are ana- lyzed under four levels of contingencies (marked as C L) as follows. • CL1: Line outage: line 11, 15, 24, 51, 59, 75 • CL2: Generator outage: bus 2, 3, 6, 9 • CL3: Line outage: line 11, 15, 24, 51, 59, 75 Generator outage: bus 2, 3, 6, 9 • CL4: Line outage: line 11, 15, 24, 51, 59, 75 Generator outage: bus 2, 3 Load increase: 5% of total load power The result details for post load shedding in terms of Vmin, FVSImax, and losse s Ploss are tabulated in Appendix, Table A. In the table, the pre load shedding condition (marked as ‘pre’) means the condition before load shedding was performed. From Table A, the graphical illustrations concerning Vmin, FVSImax, and Ploss are depicted in Figure 4, Figure 5, and Figure 6 respectively. Firstly, by look- ing at Figure 4 all methods provide significant im- provement on voltage profile throughout the contingen- cies levels. As compared to pre condition, Vmin has been improved to satisfactory magnitude of above than 0.90 p.u. It is seen that FVSI-LTA, LS, and VM provide op- timal improvement on Vmin with magnitude of approx- imately 1.00 p.u. for all levels. The resulted trend of FVSImax at post load shedding is depicted in Figure 5. This time, both FVSI-LTA and FVSI-LTB are the best ranking methods with the lowest trend of FVSImax through all contingencies levels (below than 0.20). The conve ntional r ankin g metho ds (LS, RVI , and V M) resul t to unstable trend of reduction as there exists fluctuation Figure 4 . Vmin trend a t pos t load s hedding ).( DDshedshedshed jQPSLjQPS+=+=  Z. HAMID ET AL . Copyright © 2013 SciRes. ENG 172 at CL1 and CL2 with magnitude of FVSImax of above than 0.20. Figure 5 . FVSI max trend at post loa d shedding Similar trend as FVSImax is observed for losses trend in Figure 6. The most consistent improvement on Ploss is resulted by both FVSI-LT methods with reduced losses of about 10 MW, however there is still no result at CL2 for FVSI-LTB. Unstable trend of losses reduction is de- picted by conventional ranking methods through all le- vels; implying that they are not very consistent as FVSI-LT. Moreover, the reduced Ploss is not as good as the proposed technique especiall y at CL2 and CL3. From all analysis, it is revealed that the most consistent im- provement can only be provided via FVSI-LT A. Based on Figure 4 to Fig ure 6, the impro vement trend r esult ed b y this method is stable and optimal regardless of contin- gencie s sever ity. As c an be se en in Figure 5 and Figure 6, thei r i mprovement tr end c onsists of large fluctuat ion at CL1 to CL3 and the resulted FVSImax and Ploss at those levels is not as good as FVSI-LTA. Moreover in provid- ing satisfactory voltage stability improvement, the num- ber of loads involved for load shedding, Nshed requi re d b y conventional ranking methods are higher than that of FVSI-LT. From Table A, VM is the only method that requires high Ns hed at all contingencies levels, followed by LS at CL2 and CL4, and RVI at CL3. Too many loads involved for shedding means large interruption occurs at consumer sites and this is not good for an efficient load sheddin g s cheme. 5. Conclusion In brief, a new approach for precise load buses identifi- cati on has b een proposed. The technique applied stability index tracing namely FVSI-LT for creating a useful ranking list of load buses. Based on the traced FVSI, the load buses are ranked according to their p riority and this will help the system operator (SO) to perform accurate load buses selection prior to performing any corrective actions against voltage instability. After validating the reliability of ranking list in load shedding problem, it was justified that FVSI-LT is reliable as the improvement on voltage stability condition at post load shedding is consistent regardless of contingencies severity. As com- pared to other methods, ranking list via FVSI-LT pro- vides satisfactory improvement in terms of voltage mag- nitude, line stress, and losses minimization. Such dis- covery has proven the capability of power tracing to be an alternative for voltage stability improvement besides solving power system economics prob lems as what other researches proposed. 6. Acknowledgemen t The authors would like to acknowledge The Research Manage ment I nstitute (RMI) UiT M, Shah A lam, Human Resource Department of UiTM and Ministry of Higher Education Malaysia (MOHE) for the financial support of this research. This research is jointly supported by Re- search Management Institute (RMI) via the Excellence Research Grant Scheme UiTM with project code: 600-RMI/ST/DANA 5/3/Dst (164/2011) and MOHE under the Exploratory Research Grant Scheme (ERGS) with project code: 600-RMI/ERGS 5/3 (14/2011). REFERENCES [1] D. Devaraj , J. P. Roselyn, “Genetic Algorithm Based Reactive Power Dispatch for Voltage Stability Improvemen t”, Electrical Power An d En erg y Systems, Vol. 32, 2010, pp. 1151 – 1156 . [2] P. Pinceti, “Emergency Load-Shedding Algorithm for Large Industrial Plants”, Control Engineering Practice, Vol. 10, 2002, pp. 17 5 – 181. [3] F. M. Echavarren, E. Lobato, L. Rouco, “A Corrective Load Shedding Scheme to Mitigate Voltage Collapse”, International Journal of Ele ctrical Power and Energy Sy stems, Vol. 28, 20 06, pp. 58 – 64 . [4] L. D. Arya, V. S. Pande, D. P. Kothari, “A Technique for Load-Shedding Based On Voltage Stability Consideration”, In- ternational Journal of Elect r ical Powe r and Energy S ystems, Vo l. 27, 2005, pp. 506 – 517. Figure 6 . Ploss trend at post load shedding  Z. HAMID ET AL . Copyright © 2013 SciRes. ENG 173 [5] T. Amraee, A. M. Ranjbar, B. Mozafari, N. Sadati, “An En- hanced Under-Voltage Load-Shedding Scheme to Provide Volt- age Stability”, Electric Power Systems Research, Vol. 77, 2007, pp. 1038 – 1 046. [6] J. Bialek, “Tracing the Flow of Electricity”, in Generation, Trans mission a nd Distribu tion, I EE Proc eedings, Vol. 143, no. 4, July 1996, pp. 313 - 320. [7] J. H. Teng, “Power Flow and Loss Allocation for Deregulated Transmission Systems”, International Journal of Electrical Power and Energy Sy s tem s, Vol. 27, 2005, pp. 327–333. [8] S.Abdelkader, "A Meth od for Determining Generators ’ Shares in Loads, Line Flows and Losses," Journ al of t he Frank lin Institute, Vol. 344, 2007, pp. 1063–1074 [9] A. R. Abhyankar, S. A. Soman, S. A. Khaparde, “Optimization Appr oach to Re al P owe r Tr acing: An A ppl icatio n to T rans mis sion Fixed Cost Allocation”, IEEE Transactions on Power Systems, Vol. 21, no. 3, August 2006, pp. 1350 - 1361. [10] M. H. Su laiman , M. W. Mustafa, H. Shareef, S. N. A. Khalid, O. Aliman, “Real and Reactive Power Flow Allocation in Deregu- lated Power System Utilizing Genetic-Support Vector Machine Technique”, International Review of Electrical Engineering (IREE), Vol. 5, 2010, pp. 2199 – 2208. [11] M. H. Sul aiman, M. W. Must afa, H. S haree f, S. N. A . Khalid , “An Application Of Artificial Bee Colony Algorithm with Least Squares Support Vector Machine for Real And Reactive Power Trac ing in Deregu lated Power System ”, In ternational Journal of Electrical Power and Energy Systems, Vol. 37, 2012, pp. 67 – 77. [12] I. Musirin, T. K. A. Rahman, “Estimation of Maximum Loadability in Power Systems by Using Fast Voltage Stability Index”, International Journal of Power and Energy Systems, Vol. 25, n. 3, 2005 , pp. 181 – 189. [13] I. Musirin, T. K. A. Rahman, “Evolut iona ry Programmi ng Ba sed Optimization Technique for Maximum Loadability Estimation in Electric Power System”, in National Proceedings of Power En- gineering Conference (PECon) Dec. 2003. pp. 205 – 210. [14] Z. Hamid, I. Musirin, M. M. Othman, M. N. A. Rahim, “New Formulation Technique for Generation Tracing via Evolutionary Programming”, International Review of Electrical Engineering (IREE), Vol. 6, 2011, pp. 1946 – 1959. [15] Z. Hamid, I. Musirin, M. N. A. Rahim, N. A. M. Kamari, “Ap- plication of Electricity Tracing Theory and Hybrid Ant Colony Algorithm for Ranking Bus Priority in Power System”, Interna- tional Journal of Electrical Power and Energy Systems, Vol. 4 3, 2012, pp. 1427 – 1434. [16] T. J. Ross, Fuzzy Logic with Engineering Applications. John Wiley and Sons, 2009. [17] J. Sasikala, M. Ramaswamy, “Fuzzy Based Load Shedding Strategies for Avoiding Voltage Collapse”, Applied Soft Com- puting, Vol. 11, 2011, pp. 3179 – 3185. [18] D. Mingchui, L. Chinwang, W. Chikong, “Adaptive Un- der-Frequency Load Shedding”, Tsinghua Science and Technol- ogy, Vol. 13, 2008, pp. 823 – 828. [19] J. Zhu, Optimization of Power System Operation: John Wiley and Sons, 2009 [20] A. M. A. Haidar, A. Mohamed, A. Hussain, “Vulnerability Con- trol of Large Scale Interconnected Power System Using Neu- ro-Fuzzy Load Shedding Approach”, Expert Systems with Ap- plications, Vol. 37, 2010, pp. 3171 – 3176. Appendix: Table A. Post load shedding performance under various contingencies levels – IEEE 57-Bus RTS CL Method Nshed Top 10 load buses (based on priority) V min (p.u.) FVSImax P loss (MW) 1 Pre - 0.492 1.253 56.213 FVSI -LT A 16 30, 25 , 31, 35 , 38, 47, 49, 28, 15, 18 0.979 0.146 12.921 FVSI-LTB 16 30 , 31, 50, 25, 42, 49, 9, 41 , 47, 18 0.984 0.095 11.852 LS 18 31, 30, 25, 33, 32, 23, 20, 35, 57, 19 0.983 0.274 12.848 RVI 23 8, 12, 3, 6, 9, 1, 2, 17, 18, 19 0.902 0.395 20.596 VM 29 30, 31, 25, 33, 32, 23, 35, 57, 20, 56 1.003 0.146 11.051 c 2 Pre - 0.510 1.381 38.451 FVSI-LTA 19 30, 25, 38, 50, 2, 31, 35, 53, 14, 3 0.968 0.102 11.007 FVSI-LTB - - - - - LS 30 31, 30, 25, 33, 32, 35, 57, 56, 23, 42 0.963 0.139 21.087 RVI 22 8, 1, 12, 2, 13, 17, 3, 5, 6, 14 0.929 0.192 26.171 VM 31 30, 31, 25, 33, 32, 35, 57, 56, 23, 42 0.936 0.158 19.857 c 3 Pre - 0.485 1.184 69.528 FVSI-LTA 15 31 , 30, 25 ,49, 9, 2, 3, 14, 35 ,38 0.950 0.098 13.211 FVSI-LTB 15 30, 31, 50, 42, 25, 2, 49 , 3, 47, 41 0.957 0.091 13.723 LS 16 31, 30, 25, 33, 32, 23, 20, 35, 57, 19 0.969 0.298 21.599 RVI 30 8, 12, 1, 17, 3, 5, 6, 13, 14, 15 0.914 0.192 24.459 VM 32 30, 31, 25, 33, 32, 23, 35, 57, 20, 56 0.957 0.189 13.758 c 4 Pre - 0.464 1.209 89.738 FVSI-LTA 20 30, 25, 2, 3 1, 3, 14, 38, 49, 15, 28 0.957 0.107 13.955 FVSI-LTB 21 30, 31, 50, 42, 25, 2, 49, 9, 3, 47 0.959 0.098 13.671 LS 30 31, 30, 25, 33, 32, 23, 20, 35, 57, 19 1.000 0.163 10.701 RVI 20 8, 12, 6, 9, 1, 17, 3, 15, 16, 18 0.959 0.198 15.035 VM 33 31, 30, 25, 33, 32, 35, 23, 57, 20, 56 1.005 0.187 11.587 |