Paper Menu >>
Journal Menu >>
 Engineering, 2013, 5, 163-167 doi:10.4236/eng.2013.51b030 Published Online January 2013 (http://www.SciRP.org/journal/eng) Copyright © 2013 SciRes. ENG Planning of Anti-Disaster Transf orm er S ubst at i on Based on NN and PSO T. Wang1, Q.J. Tang2, X.L. Yang2, X.D. Liu2 1Wenzhou Electric Power Bureau, Wenzhou, China 2 High Voltage Division, Xi’an Jiaotong University, Xi’an, China Email: liuxuand@mail.xjtu.edu.cn Abstract Recently, the frequent extreme natural disasters made enormous damage to the electric grid leading to blackouts. The lifeline system aiming at providing continuous power supply for the important load in extreme natural disasters was designed in that condition. In t his paper , a d evelop ed model for plannin g of the tra nsfor mer substation in lifeli ne syste m which considered the effect of existing transformer substations, the motivated areas and punishment areas was propo sed. The Hopfield NN was adopted to solve the feeders and the PSO was adopted to new the locations of the transformer substa tions based on the feed ers. The planning result not only took fully use of the existing subs tation but also get the suitable location for new construction which was satisfactory. Keywords: lifeline system, transformer substation, Hopfield NN, PSO 1. Introduction In recent years, the globe climate beca me more abnormal [1]. More and more power equipment accidents caused by the natural disasters would lead to the blackouts which affected the normal social activities a lot [2]. Many works have been done to prevent the blackouts from happening. One major research area was focused on finding the more suitable topological structure for power grid to improve the robustness aga inst the dis tur bance [3]. The other was aimed at improving the secondary controlling and predicting system to minimize the loss when disaster happened [4][5]. All those work improved the reliability of the power grid in some way. However, in 2008, the Wenchuan earthquake in Sichuan province led to almost 31.8% load shedding which resulted in a loss of about 10.65 billion yuan directl y [6]. In the same year, the ice disaster in South China also destroyed over 36000 10kV+ transmission lines and 2000 35kV+ transformer stations which caused large area outage and a great number of economic losses [2]. The frequent blackouts caused by the natural disasters exposed the shortcomings of the defense system that the improvements on the topological structure and secondary system couldn’t make up the defect on primary side completely which meant that the strong primary side was necessar y [7]. In that conte xt, the State Grid Corporatio n of China proposed the differentiation construction which included the lifeline system aiming at providing continuous power supply for the important load in extreme natural disasters [8]. As the juncture between the power source and the load, the distribution of the transformer substation determined the structure of the power grid, especially in the lifeline system in which the topological structure was as compact as possible. The problem of distribution planning could be divided into two sub-problems that the substations optimization a nd feeder s op timizatio n [9] . A lot o f work s had been done to optimize the distribution substation locations [9]-[13]. Masud defined an approach employing linear and integer programming to optimize the capacities and the expansion of the system substation subject to the constraints of cost, load, voltage, and reserve requirements [9]. Crawford used operations research to simultaneously optimize substations and reliability constraints. Thompson made the further research by using the branch and bound model which was utilized a shortest path table to obtain lower bounds and solutions from a transshipment linear programming model for upper bounds [11]. With the development on computer technology, more and more intelligent algorithms were applied in choosing optimal substation location. Xi’an Jiaotong University used the Hopfield neura l net work ( NN) co mbine d wit h gree dy al gorit hm to find the o p timal fee de r bo unda ry [1 4 ]. T i anj i n Uni versity and North Electric Power University used the particle swarm opti mization (PSO) to find the center in the p lane which would be helpful to get the o ptimal loca tion of the transform substation [15]-[17]. However, almost all 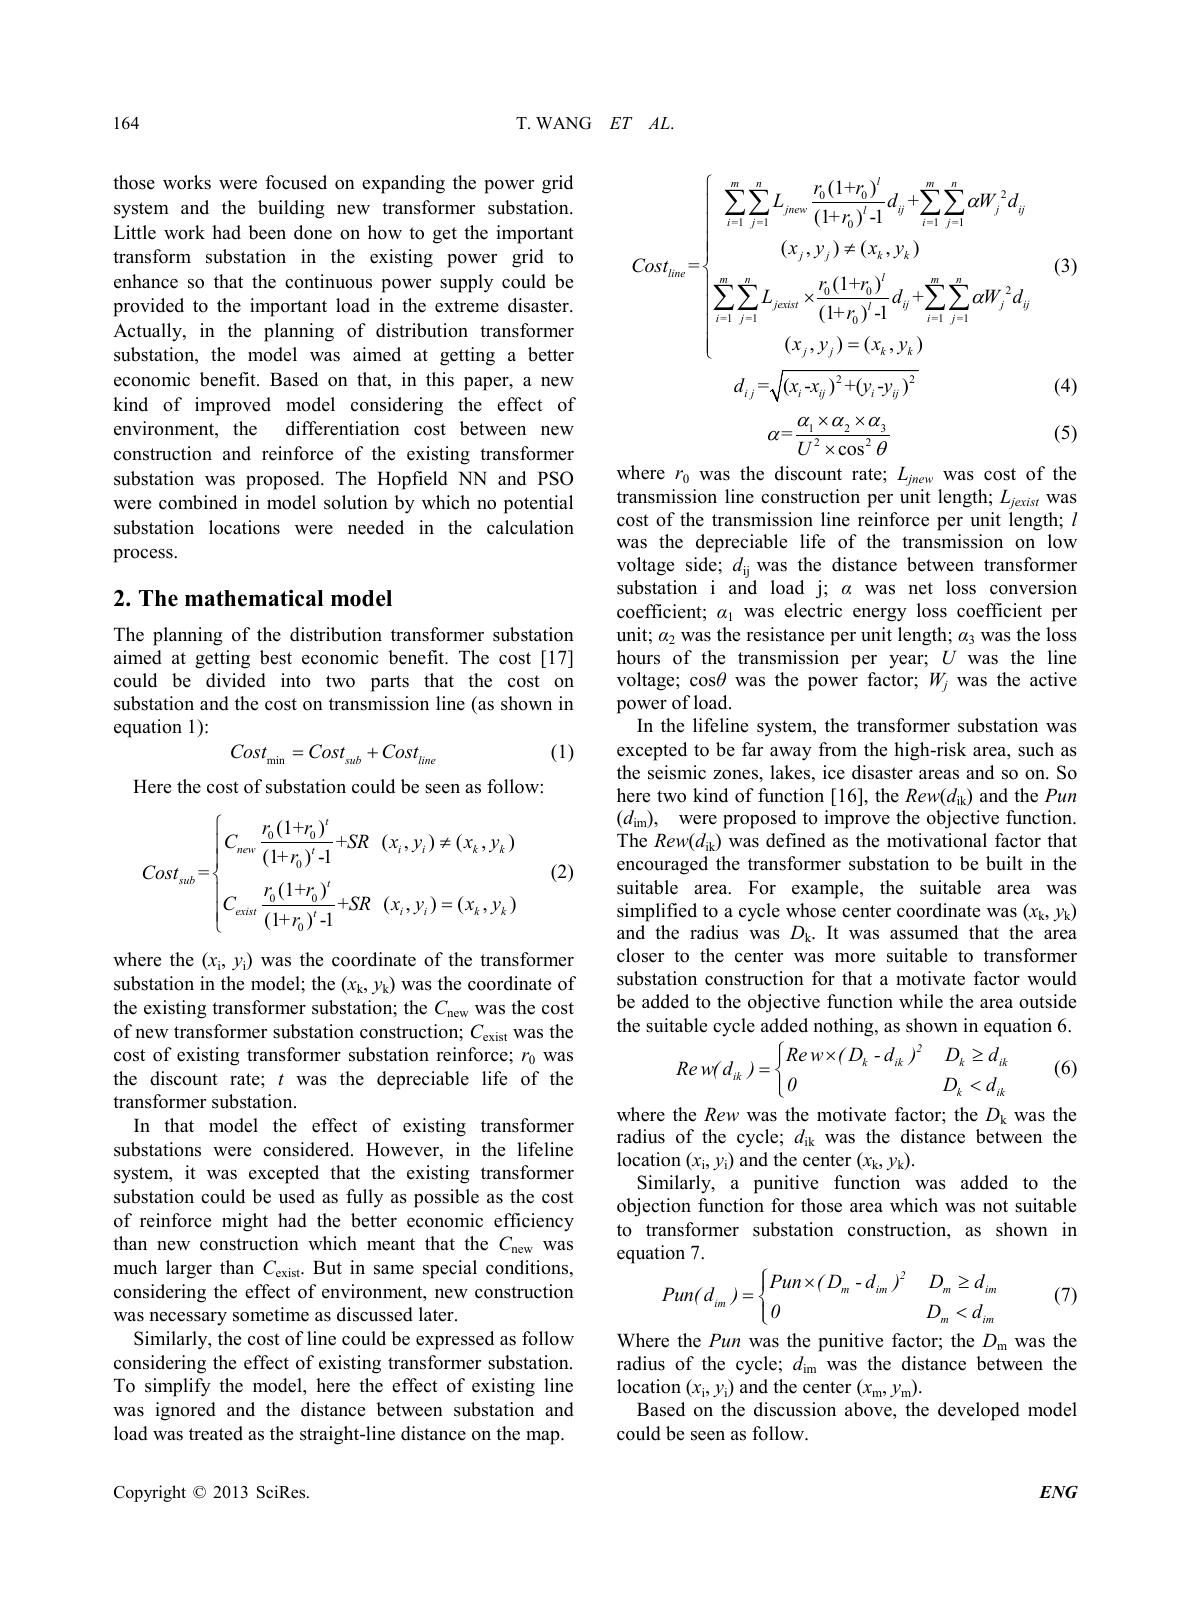 T. WANG ET AL. Copyright © 2013 SciRes. ENG 164 those works were focused on expanding the power grid system and the building new transformer substation. Little work had been done on how to get the important transform substation in the existing power grid to enhance so that the continuous power supply could be provided to the important load in the extreme disaster. Actually, in the planning of distribution transformer substation, the model was aimed at getting a better economic benefit. Based on that, in this paper, a new kind of improved model considering the effect of environment, the differentiation cost between new construction and reinforce of the existing transformer substation was proposed. The Hopfield NN and PSO were combined in model solution by which no potential substation locations were needed in the calculation process. 2. The mathematical model The planning of the distribution transformer substation aimed at getting best economic benefit. The cost [17] could be divided into two parts that the cost on substa tion a nd the cost o n tra nsmi ssion line (a s sho wn in equation 1): min sub line CostCost Cost=+ (1) Here the cost of substation could be seen as follow: 00 0 00 0 (1+) + (,)(,) (1+) -1 =(1+) + (,)(,) (1+) -1 t newi ikk t sub t existi ikk t rr CSRx yxy r Cost rr CSRx yxy r ≠ = (2) where the (xi, yi) was the coordinate of the transformer substation in the model; the (xk, yk) was the coordinate of the exi stin g trans for mer subst atio n; the Cnew was the cost of new transfor mer substatio n co nstruction; Cexist was th e cost of existing transformer substation reinforce; r0 was the discount rate; t was the depreciable life of the transformer substatio n. In that model the effect of existing transformer substations were considered. However, in the lifeline system, it was excepted that the existing transformer substation could be used as fully as possible as the cost of reinforce might had the better economic efficiency than new construction which meant that the Cnew was much larger than Cexist. But in same special conditions, considering the effect of environment, new construction was necessary sometime as discussed later. Similarly, the cost of line could be expressed as follo w considering the effect of existing transformer substation. To simplify the model, here the effect of existing line was ignored and the distance between substation and load was treated as the straight-line distance on the map. 2 00 =1 =1=1 =1 0 2 00 =1 =1=1 =1 0 (1+ )+ (1+) -1 (,)(,) =(1+ )+ (1+) -1 (,)(,) l mn mn jnewijj ij l ij ij jj kk line l mn mn jexistijj ij l ij ij jj kk rr Ld Wd r xy xy Cost rr Ld Wd r xy xy α α ≠ × = ∑∑ ∑∑ ∑∑ ∑∑ (3) 22 =(-)+(-) i jiijiij dxx yy (4) 123 22 =cosU ααα αθ ×× × (5) where r0 was the discount rate; Ljnew was cost of the transmission line construction per unit length; Ljexist was cost of the transmission line reinforce per unit length; l was the depreciable life of the transmission on low voltage side; dij was the distance between transformer substation i and load j; α was net loss conversion coefficient; α1 was electric energy loss coefficient per unit; α2 was the resistance per unit length; α3 was the loss hours of the transmission per year; U was the line voltage; cosθ was the power factor; Wj was the active power of load. In the lifeline system, the transformer substation was excepted to be far away from the high-risk area, such as the seismic zones, lakes, ice disaster areas and so on. So here two kind of function [16], the Rew(dik) and the Pun (dim), were proposed to impro ve the obje ctive function. The Rew(dik) was defined as the motivational factor that encouraged the transformer substation to be built in the suitable area. For example, the suitable area was simplified to a cycle whose center coordinate was (xk, yk) and the radius was Dk. It was assumed that the area closer to the center was more suitable to transformer substation construction for that a motivate factor would be added to the objective function while the area outside the suitable cycle adde d nothing, as shown in equation 6. 2 k ikkik ik k ik Rew(D-d) Dd Rew( d)0 Dd ×≥ =< (6) where the Rew was the motivate factor; the Dk was the radius of the cycle; dik was the distance between the location (xi, yi) and the center (xk, yk). Similarly, a punitive function was added to the objection function for those area which was not suitable to transformer substation construction, as shown in equation 7. 2 m immim im m im Pun(D-d) Dd Pun( d)0 Dd ×≥ =< (7) Where the Pun was the punitive factor; the Dm was the radius of the cycle; dim was the distance between the location (xi, yi) and the center (xm, ym). Based on the discussion above, the developed model could be seen as follow. 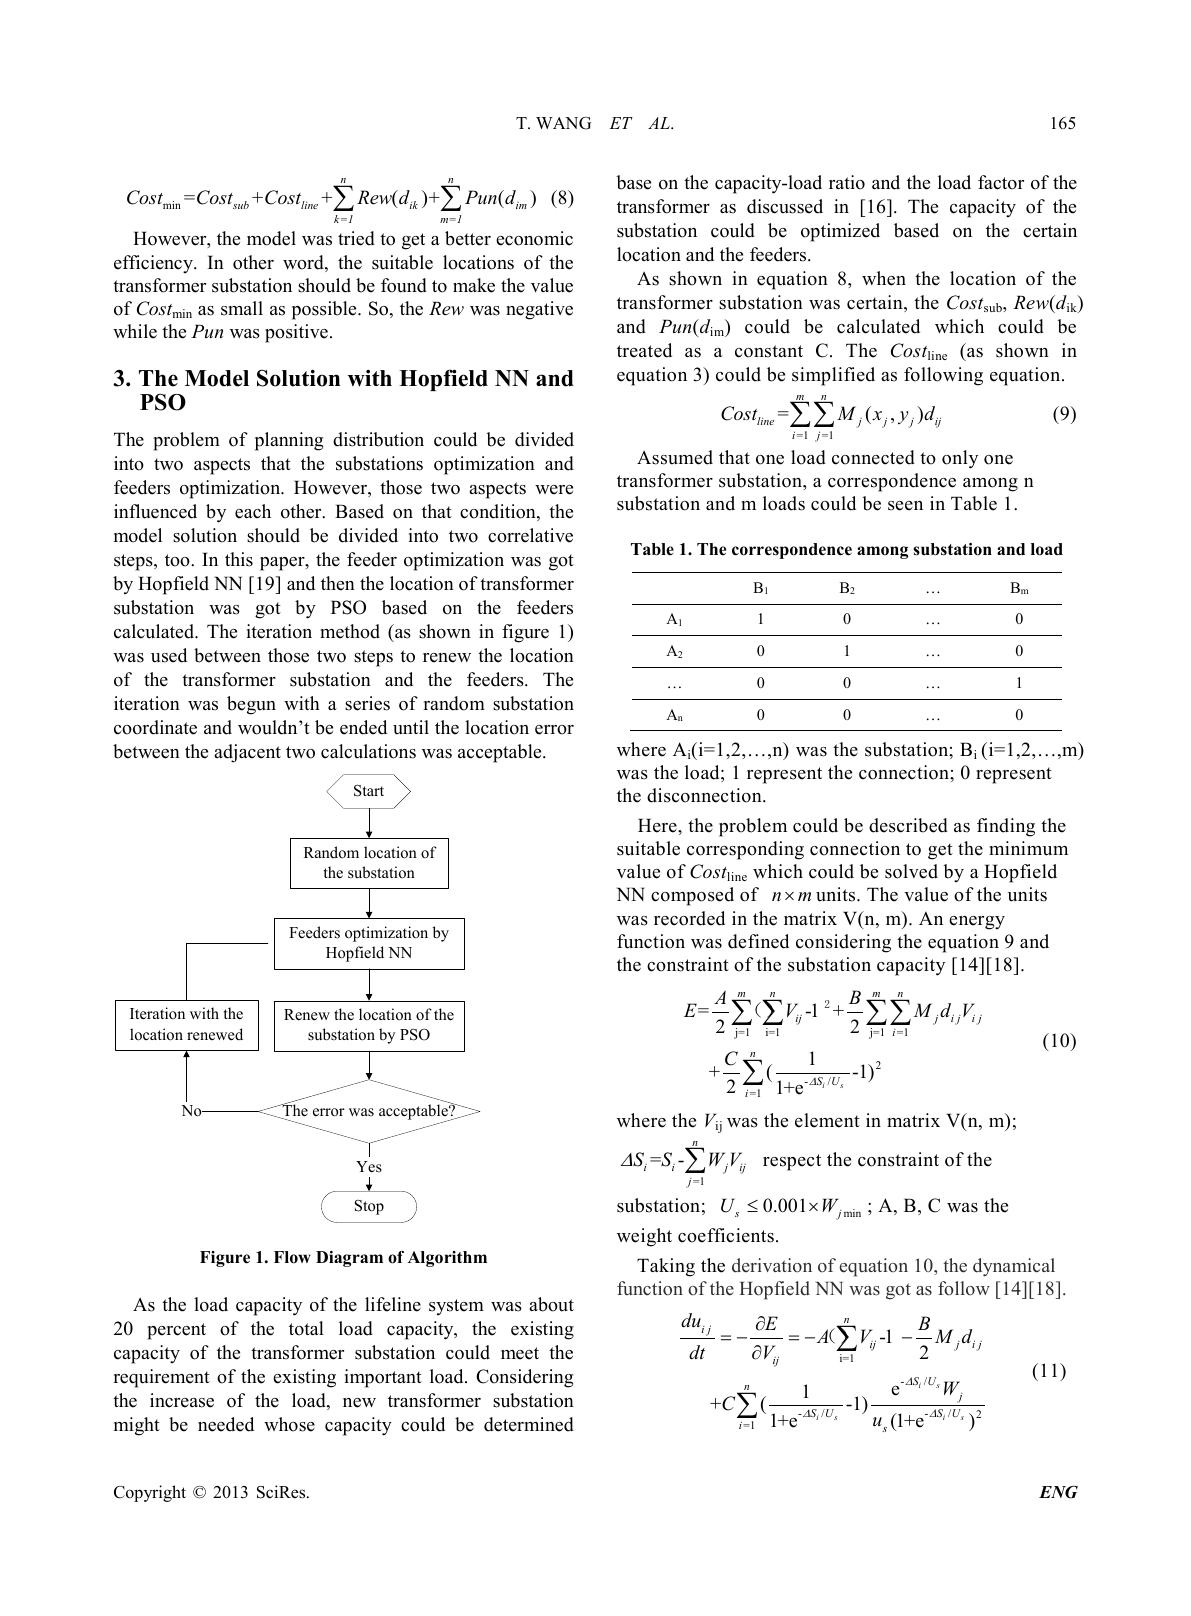 T. WANG ET AL. Copyright © 2013 SciRes. ENG 165 min () () n subline k n ik im m=1 1= Rew d+PuCost =Costond+C st+ ∑ ∑ (8) However, the model wa s tried to get a bette r eco no mic efficiency. In other word, the suitable locations of the trans fo r mer sub stati on s ho uld b e found to ma ke t he va l ue of Costmin as small as possible. So, the Rew was ne gati ve while the Pun was positive. 3. The Model Solution with Hopfield NN and PSO The problem of planning distribution could be divided into two aspects that the substations optimization and feeders optimization. However, those two aspects were influenced by each other. Based on that condition, the model solution should be divided into two correlative steps, too. In this paper, the feeder optimization was got by Hopfield NN [19] and then the location of transformer substation was got by PSO based on the feeders calculated. The iteration method (as shown in figure 1) was used between those two steps to renew the location of the transformer substation and the feeders. The iteration was begun with a series of random substation coordinate and wouldn’t be ended until the lo cation erro r between the adjacent two calculations was acceptable. Start Random location of the substation Feeders optimization by Hopfield NN Renew the location of the substation by PSO The error was acceptable? Stop Yes Iteration with the location renewed No Figure 1 . Flow Diagram of Algorithm As the load capacity of the lifeline system was about 20 percent of the total load capacity, the existing capacity of the transformer substation could meet the requirement of the existing important load. Considering the increase of the load, new transformer substation might be needed whose capacity could be determined base on the capacity-load ratio and the load factor of the transformer as discussed in [16]. The capacity of the substation could be optimized based on the certain location and the feeders. As shown in equation 8, when the location of the transformer s ubstatio n was certain, the Cost s ub, Rew(dik) and Pun(dim) could be calculated which could be treated as a constant C. The Costli ne (as shown in equation 3) could be simplified as following equation. =1 =1 =(, ) mn linejjj ij ij CostMxyd ∑∑ (9) Assumed that one load connected to only one tra ns fo r me r s ubst a ti o n, a c o rre sp o nd e nc e a mo n g n substation and m loads could be seen in Table 1. Table 1. The corr e spondence among substat ion and load B1 B2 … Bm A1 1 0 … 0 A2 0 1 … 0 … 0 0 … 1 An 0 0 … 0 whe re A i(i=1,2,…,n) wa s the subs tat ion; B i ( i=1,2,…,m) was the load; 1 r epre sent t he co n nectio n ; 0 rep re se nt the di sco n nection. Here, the prob le m co uld be descr ibed a s findi ng the suitab le corresponding connection to get the minimum val u e of Costline which could be solved by a Hopfield NN composed of nm× uni ts. T he va lu e o f t he u ni t s was r eco rde d in t he ma tr ix V (n, m). A n ene rg y function was defined considering the equation 9 a nd the constrain t o f the sub statio n capaci ty [14 ][18] . j=1i=1j=1 =1 2 -/ =1 =-1 + 22 1 +(-1) 21+e is m nmn ijjij ij i n SU i AB E VMdV C ∆ ∑ ∑∑∑ ∑ 2 () (10) where the Vij wa s t he eleme n t in ma tri x V ( n, m); =1 =- n iij ij j S SWV ∆ ∑ respect the co nstrai nt o f the substation; min 0.001 sj UW≤× ; A, B, C wa s the weight coefficients. Ta ki n g t he der ivation of equation 10 , the dynamical function of the Hopfield NN was got as follow [14][18]. i=1 -/ -/-/ 2 =1 -1 2 e 1 +(-1) 1+e(1+e ) is is is n ij ijji j ij SU nj SU SU is du EB A VMd dt V W Cu ∆ ∆∆ ∂ =−=− − ∂ ∑ ∑ () (11)  T. WANG ET AL. Copyright © 2013 SciRes. ENG 166 Owning to t he charact ers o f t he Hop field NN , the energy function would be monotone decreasing u ntil got co n st ant as th e d yn a mi c al fu ncti o n ke pt l e ss t han o r equa l to z e ro . Whe n t he ca l c ul a ti o n wa s fi ni s he d , a n norma liza tio n wa s ado pt to e ver y li ne o f t he matr ix V(n, m) so t hat o n l y one el eme n t wa s one wh il e o t hers kept zero whi c h mea nt t hat t he conne ct ion r ela tion among transformer substations and loads were certain. The loc ation o f t he tr an sfo r mer sub sta tio n wou ld b e renewed aiming at finding a suitable coordinate to get the minimum value of t he Costmin (as shown in equation 8) based on the certai n feeders. However, the differentiation of land status in this model made it hard to get t he s u itab le co or di na te wit h t he tr adit ional ana lyt ic me tho d. A s the sup er ior it y in the ex tre mu m problem, PSO arithmetic was used in model solution. Co nsider in g t he e ffe ct o f the ex is tin g tr a nsfor mer substation, the initial particle swarm was constituted of the l o ca t ion of t he exi st i n g t r a ns fo rmer s ub s tation and the random coordinate in the planning area. During the calculation proc es s, t he parti cle s warm would be renewed based on the group extremum and the indi vidual e xtremu ms got by itera tion. A muta tio n (Genetic Algorithm) was used on the new particle swar m every t i me to p reve nt local optimum occurring. 4. Simulation example In this section, then loads was used to examine the planning method discussed before. The date for simulation, for example, the capacity of the existing transformer substation and the loads, the cost for substa tio n a nd line co nstr uct io n, the mai nte nance cha rge, was set based on statistics of wenzhou power network. All the coordinates used in the simulation were uniformization. The location of the load could be seen in Table 2. The location of two transfor mer substation were (0.1, 0.2) and (0.4, 0.6). Using the Hopfield NN to get the feeders, the re sult was sho wn in F igur e 2. The path length in Figure 2 was 10 totally. Then, the Hopfield NN a nd the PSO was co mbined to get the final location of the substation and the feeders. Considering the effect of the environment and the existing transformer substation, two punishment area, two existing substation and one motivated area was defined here as seen in Table 3. The result could be seen in Figure 3. Table 2. The coo r dinates of the loads L1 L2 L3 L4 L5 L6 L7 L8 L9 L10 x 0.1 0 .2 0.4 0.5 0.7 0.8 0.2 0.5 0.7 0 .9 y 0.6 0 .3 0.1 0.5 0.2 0.4 0.8 0.9 0.6 0.8 Figure 2. The feeders calculated by Hopfield NN Table 3. The correspondenc e among s ubsta ti o n and loa d Cen ter Radius location Punishment area 1 (0.55,0.50) 0.2 / Punishment area 2 (0.60,0.70) 0.2 / Motivated area 1 (0.30,0.0.20) 0.1 / Motivated area 2 (0.80,0.65) 0.1 / Existing substation / / (0.30,0.55) Figure 3. The planning c onsidering the e ffect of environment and existing transformer substation The final location of the transformer substations were (0.33,0.17), (0.30,0.54) and (0.79,0.64) which were far away from the punishment areas. In Figure 3, it could been seen that substation 2 almost had the same location to the existing substation and the other two substations were very close to the center of the motivated areas. 5. Conclusion In this paper, a developed model for planning of the  T. WANG ET AL. Copyright © 2013 SciRes. ENG 167 transformer substation in lifeline system was proposed. In the lifeline system, it was excepted that the existing transformer substation could be used as fully as possible to get the better economic efficiency. So in this model, the effect of existing transformer substations, the motivated areas and punishment areas were considered. To solve the model, the Hopfield NN was adopted to solve the feeders and the PSO was adopted to new the locations of the transformer substations based on the feeders. The iteration method was used between those two steps. By the model and the corresponding algorithm, the planning of transformer substation not only took fully use of the existing substation but also get the suitable location for new construction, whic h was satisfactor y REFERENCES [1] Q. Xie and J. Li, “Current situation of natural disaster in electric power system and countermeasures,” Journal of Natural Disasters, Vol. 15, No. 4, 2006, pp. 126-131. [2] AMIN.M, “Toward self-healing energy infrastructure systems,” IEEE Computer Applications in Power, VOL. 14, NO. 1, 2001, pp: 20-29. [3] S.Blumsack. “Defining Power Network Zones from Measures of Electrical Distance,” Conference Record of the IEEE Power & Society General Meeting, 2009, pp: 1-8. [4] Y.S. Xue. “Space-time cooperative framework for defending blackouts: Part Ⅱ reliable information, quantitative analyses and adaptive controls,” Electric Power System, 2006, VOL. 30, NO. 2, pp: 1-10. [5] Y.S. Xue. “Quantitative study of general motion stability and an example on power system stability,” Jiangsu Science and Technology Press, 1999. [6] X.H. Zhang, G.N. Wu, etc. “Effects of Wenchuan Earthquake on Sichuan Grid,” Modern Electric Power, 2009, VOL. 26, NO. 4, pp: 4-9. [7] Y.S. Xue, S.Y. Fei, etc. “The Blackouts Defense System in Extreme Disaster Part Ⅰ new challenge and introspection,” Automation of Electric Power System, 2008, VOL. 32, NO. 9, pp: 1-6. [8] M. Lu, D.H. Hu, etc. “Consideration of Strong & Smart Grid,” Central China Electric Power, 2010, VOL. 12, NO. 6, pp: 1-7. [9] Enver Masud. “An Interactive Procedure for Sizing and Timing Distribution Substations Using Optimization Techniques,” IEEE Power System, 1973, VOL. PAS-93, NO. 5, pp: 12 81-1285. [10] D.I. Sun, D.R. Farris, etc. “Optimal Distribution Substation and Primary Feeder Planning via the Fixed Charge Network Formulation,” IEEE Transactions on Power Apparatus and Systems, 1982, VOL. PAS-101, NO. 3, pp: 602-609. [11] D.M Cowford. “A Mathematical Optimization Techniqu e for Locating and Sizing Distribution Substations and Deriding Their Opitmal Service,” IEEE Transaction on Power Apparatus and System s , 1975, VOL. 94, NO. 2, pp: 230-235. [12] G.L. Thompson. “A Branch and Bound Model for Choosing Optimal Substation Location,” IEEE Transactions on Power Apparatus and Systems, 1981, VOL. 100, NO. 5, pp: 2683-2688. [13] T.H. Fawzi, K.F. Ali, etc. “A New Planning Model for Distribution Systems,” IEEE Transactions on Power Apparatus and Systems, 1983, VOL. PAS-102, NO. 9, pp: 3010-3017. [14] W.X. Gao, X.J. Luo, etc. “A New Distribution Substation Planning Algorithm Based on Greedy Algorithm and Hopfield Neural Network,” Power System Technology, 2004, VOL. 28, NO. 7, pp: 73-76. [15] T. Zeng. “Research on Substation Planning Based on Particle Swarm of Culture Algorithm,” Tianjin University, 2008. [16] Y.W. Zhang. “Optimal Planning for Substation Locating and Sizing,” Tianjin University, 2 005 [17] H.W. Dai. “Optimal Planning of Distribution Substation Location and Sizes-model and Algorithm,” International Journal of Electrical Power and Energy System, 1996, VOL. 18, NO. 6, pp: 353-357. [18] F.Shi, X.C. Wang, etc. “30 cases analysis of Matlab Neural Network,” The Beijing University of Aeronautics and Astronau t ics Press, 2010. |