Engineering, 2013, 5, 132-136
doi:10.4236/eng.2013.51b024 Published Online January 2013 (http://www.SciRP.org/journal/eng)
Copyright © 2013 SciRes. ENG
Energy Saving Potential Due to Refurbishment of Federal
Public Housing in the UAE
Wafa AlAwadhi1, Athari AlNaqbi1, Abeer Manneh1, Ayoub Kazim2, Bassam Abu-Hijleh1
1Faculty of Engineering & I T, The British Universit y in Dubai, D ubai -U AE
2Duba i Inte rnational Academic City, Education Cluster, TECOM Investments, Dubai-U AE
Email: bassa m.abuhijleh@buid.ac.ae
Received 2013
Abstract
This paper, computer energy modeling is used to estimate the potential energy savings of refurbishing existing public
federal housing in the United Arab Emirates. Suc h houses are built by the UAE Ministry of P ublic Works (MoPW) in
five of the seven emirates that make up the UAE federation. T he energy modeling was performed using the Integrated
Environmental Solutions-Virtual Environment (IES-VE) commercial software. The study covered representative
MoPW houses built in the period of 1974-2012. The results indicate po tential ener g y savings upto 30.8% for the case of
model 717 when refurbished to 2 Pearls standards compared to the as built configuration. T he results sho wed little ben-
efit in going from 1 Pearl to 2 Pearls refurbishment level. Thus 1 Pearl seems to be the most practical. This shows the
high potential for energy, and thus environmental, savings should refurbishment be carried out on the homes built by
the MoPW.
Keywords: en ergy m odeling, energy savings , refurbis hment, UAE
1. Introduction
Sustainability features prominently in the UAE’s 2021
vision. T his incl ude s increased det er mina tio n in t he U A E
to reduce CO2 emissions as part of the global effort to
reduce greenhouse gases and mitigate global warming
effects. Although the focus has been on developing and
expanding the use of renewable energy resources, reduc-
ing energy consumption per capita is also an important
aspect. The built environment has been identified as one
of the highest energy consumption sectors in the UAE,
and thus CO2 producers. The focus until now has b een
on regulations for new buildings. As a young country,
UAE compulsory building regulations relating to energy
savings and conservation were introduced only in the
past decade (2003 in Dubai and 2007 in Abu Dhabi).
This means that e ven if all ne w build ings are to ad here to
significantly high energy conservation standards, the
UAE will still have a large stock of buildings, some just
completed, which have excessive cooling loads and thus
are not environmentally friendly. This can be seen from
the data that shows the UAE to have one of the highest
electricity consumption per capita in the world. This re-
flects negatively on the CO2 emissions as the UAE has
the 2nd hi g he st CO2 emi ssions per capita in the world. If
the UAE is to significantly reduce its CO2 footprint the
inefficiencies of the existing building stock needs to be
addr essed.
This paper presents the result of a computer energy mod-
eling study designed to assess the potential energy sav-
ings of refurbishing existing buildings in the UAE. In
particular, public housing buildings built by the UAE
Mini stry of P ub li c W o rks (M oP W ) . The M oP W ha s b ee n
build ing suc h public housing since 1974 and until today.
The existence of detailed data regarding the number and
the construc tion detail s of suc h b uildings mad e them idea
for this study. The study will look at the energy con-
sumption of a representative building in each decade and
see the level of energy reduction that can be achieved
using different refurbishment practices, e.g. extra insula-
tion and changing the gl az ing.
2. Literature Review
The built environment is responsible for approximately
40% of the total primary energy consumption [1]. Al-
though most of the new regulations focus on new build-
ings to be constructed, these new buildings add around
0.5-2% to the total building stock, depending on the type
and the regional economic conditions [2 and 3]. This
means that even if all new buildings have zero CO2
W. ALAWADHI ET AL.
Copyright © 2013 SciRes. ENG
133
emissions, the older inefficient building stock will cause
the CO2 emission levels to remain unacceptably high.
Thus r efurb ish me nt of e xisti ng build ings see ms to be the
most practical way of reducing CO2 emissions in the
short to medium term [4]. T he matur ity of refurbishment
technologies, practices and relatively low costs, makes
refurbishment a better choice for reducing CO2 emis-
sions compared to using more active, and expensive,
renewable energy strategies to meet the high demand of
inefficient build ings. Ma ny studies have b een conducted,
in different countries, to assess the potential and needs
for refurbishment of existing buildings [3, 5-8]. The
scope of these studies covered the environmental, social
and economic aspects of the refurbishment process. In all
cases, the results clearly showed the benefits of refur-
bishing older buildings. The scope of the refurbishment
process is strongly dependent on the age of the building,
building technologies employed in the original build,
building materials used as well as the local climatic con-
ditions and e nvironmental regulation s.
As a young country, the UAE has been late in imple-
menting energy conservation regulations for buildings.
These regulations started with the 2003 Decree 66 in
which Dubai Municipality started enforcing the use of
energy saving practices, i.e. thermal insulation materials
and glazing. Similar regulations were also decreed in
Sharjah in the same year, i.e. 2003. It was not until 2010
that building regulations were decreed in Abu Dhabi.
That is when the Abu Dhabi Urban Planning Council
(UPC) produced the ESTIDAMA building regulations
which included several energy saving requirements.
Form this it is clear that the majority of the buildings in
the UAE were co nstructed with little or no consideration
to energy savings. This is especially true for investment
buildings built by developers for sale rather than rent. In
such situations initial cost savings were the dominate
concern for the developers resulting in cost/corner cut-
ting me as ur es. As a r es ult s uc h b ui ld in gs te nd ed to s u ffer
from high energy operating costs. It is interesting to note
that until 2012 there are no federal building regulations
designed to promote ener gy savi ngs in federal buildings.
This includes all the federally build public houses start-
ing fro m 19 74 until to da y. T he har sh cli mate o f the U AE
coupled with poor thermal characteristics of buildings in
the UAE resulted in very high cooling loads. The highes t
electrical load comes from HVAC equipment which ac-
counts for an average of 40% of the total year around
electrical load and up to 60% of the peak electrical load
during the summer time [9]. Based on this the current
study will focus on the energy saving potential of refur-
bishing exiting buildings in the UAE due to refurbish-
ment of the building envelop in order to improve its
thermal characteristics.
Several federal public housing villas will be studied in
this research to assess the energy saving potential due to
refurb ishment. These federal buildings were chosen due
to the availability of detailed data describing the build-
ings construction characteristics as well as numbers and
years of built. Five different villa models were chosen
for this study. The models were chosen were the most
popular model built by the MoPW in each of the past 5
decades, i.e. from 1974 until 2012. . Table 1 shows a
summary of the main data for these villas. The new ES-
TIDAMA thermal insulation and glazing requirements
are used to guide the level of refurbishment applied for
the different villas. ESTIDAM has five certification le-
vels ranging from 1-5 Pearls [10]. Two refurbishment
levels will be used in the current study, those corres-
ponding to 1 and 2 Pearls. Table 2 lists the minimum
ESTIDAMA thermal requirements for 1 and 2 Pearls
certification.
Table 1. S ummary data of the five villa modles used in the
curr ent study.
Model
number
Decade
built
Villa
Configuration
Total floor
area (m2)
Window/wall
ratio (% )
C73 1970s
G 108
B74 1980s
G 114 3.7
670 1990s
G 351 6.7
717 2000s
G+1 394 11.5
762 2010s
G+1 472 11.1
Table 2. Mi nimum ESTIDAMA thermal requirements for 1
and 2 Pearls certificat ion.
1 Pearl 2 Pearls
Wall U-value (W/m C
o
)
0.32
0.29
Roof U-value (W/m Co)
0.14 0.12
Glazing U-va l ue (W/m2 Co)
2.2 1.9
Glazing Solar Heat Gain Coefficient
(S HGC)
0.4 0.3
Maximum Window/Wa ll area rati o
(%)
15% 10%
3. Methodology
Computer modeling has proven to be a powerful tool
among building professionals and researchers, whether
they are used for drawing, rendering, evaluating or opti-
mization. A Computer simulation modeling program si-
mula te s a n abstr a ct mo d el o f a p ar ticular building a nd ca n
be used to explore and gain new design ideas, technolo-
gical products and verdicts. Computer energy modeling is
a subset of this category and is used to enhance buildi ngs’
desi gns and systems through a ssessing and estimating the
performance of a building and its integrated systems.
W. ALAWADHI ET AL.
Copyright © 2013 SciRes. ENG
134
Such p rogra ms and models are used when systems are too
complex for an analytical assessment. This type of mod-
eling assists designers in processing building regulations,
simulate solar analysis, thermal analysis, acoustic analysis,
ventila tion and air flow, create shading designs and light-
ing designs within a 3D model. There is a wide range of
energy simulation software available that have been used
by researchers including; Energy plus [11], DOE-2 [12
and 13], Ecotect [14 and 15], and IES [16 and 17]. For
this work, the Integrated Environmental Solutions – Vir-
tual Reality (IES-VE) software was chosen due to high
level of accuracy and ran ge of capa bil i ties.
Five different MoPW built villas were selected for this
study The MoPW built several models in each decade
since 1974 and until today. The villas chosen were the
most popular models built in each decade.
Each villa was modeled in IES based on the design data
provided by the MoPW. This included architectural,
structural and material components. Figure 1 shows a
sample t he IE S villa model ( model 717). IE S was used to
calculate the energy consumption of the different villas.
This was done for the ori ginal configuration of the villas,
i.e. as built, as well after the virtual refurbishment of the
villas by adding additional insulation or upgrading the
existing glazing. The effectiveness of the refurbishment
was assessed by looking at the percentage change in the
energy consumption of the refurbishment villa compared
to the energy consumption of the original villa. These
results will be shown and discussed in the following sec-
tion.
After taking a closer look at the layout and plans of the
different models, it became clear that models C73 and
B74 are es s entially the same in t erms of configuration and
build technology. Thus model C73 was not simulate d.
Figur e 1. T he IES co mpute r model of villa model 717.
4. Results and Discussion
IES energy modeling computer modeling software was
used to simulate the total energy load of each of the four
villa models over an entire year. Each model was simu-
lated as per built configuratio n them after refurbishing it
to EST IDAMA’s 1 and 2 Pear l standards. Note that the 2
Pearls standard requires a window/wall ration of less
than 10%. Still not change in the models w/w was made
as per of the virtual refurbishment exercise as this was
deemed unpractical in real-life refurbishment. Also fro m
Table. 1 shows that only models 717 and 762 had a w/w
ratio greater than 10% but not by much.
Table. 3 show the total annual energy load (TAEL) for
the four villa models and how this changes with refur-
bishment levels. It is interesting that all four models ex-
hibit similar trends and even values in terms of energy
reduction due to refurbishment. The refurbishment to 1
Pearl level r esulted in a significant 27. 5-29.8% reduction
in total energy. Going to 2 Pearls level did not improve
the ener g y performance much over the 1 Pearl level, only
an addition 0.7-1.1%. This is clear indica tion that 1 P earl
insulation levels are good enough for the UAE climate
and further enhancements in these values have little in
terms of return.
Table 3. Cha nges in the total energy consumption d ue to
upgrading the models’ ther mal chatacteristics .
Mo de l n umbe r
Total Annual
Energy Load
(MWh)
Change in TAEL
compared to
based model (%)
Normalized
TAEL
(kWh/m2)
B74 (base)
54.7
NA
480
B74 (1 Pearl)
39
28.7%
342
B74 (2 Pearls)
38.6
29.4%
339
670 (Base)
188.5
NA
537
670 (1 Pearl)
134.7
28.5%
384
670 (2 Pearls)
132.7 29.6% 378
717 (Base)
237.2
NA
602
717 (1 Pearl)
166.4
29.8%
422
717 (2 Pearls)
164.1
30.8%
416
762 (Base)
174.9
NA
371
762 (1 Pearl)
126.8
27.5%
269
762 (2 Pearls)
125 28.5% 265
Table. 3 also show the normalized total annual energy
load per m2 of the models gross floor area. This is an
indic ator of the e nerg y effi cienc y of t he di fferent models
(TAEL). It is interesting to note that between the 1980s
(B74) and the 2000s (717), the energy consumption per
m2 has gone up. The increase in window/wall ratio dur-
ing that period (Table. 1) coupled with poor thermal
W. ALAWADHI ET AL.
Copyright © 2013 SciRes. ENG
135
glazing characteristics, all models had single pan glass
windows, resulted in high solar heat gain loads and thus
the increase in the normalized TAEL. Model 762 has the
lowest normalized TAEL although it has a high 11.1%
w/w glazing but the glazing used has much better ther-
mal characteristics than the other models, U-glazing for
model 762 is 2.83 W/m2K compared to 4.83 W/m2K
from model 717. Note that the val ue o f t he U-glazing for
model 762 is close to that required by the 1 Pearl regula-
tions, Table. 1.
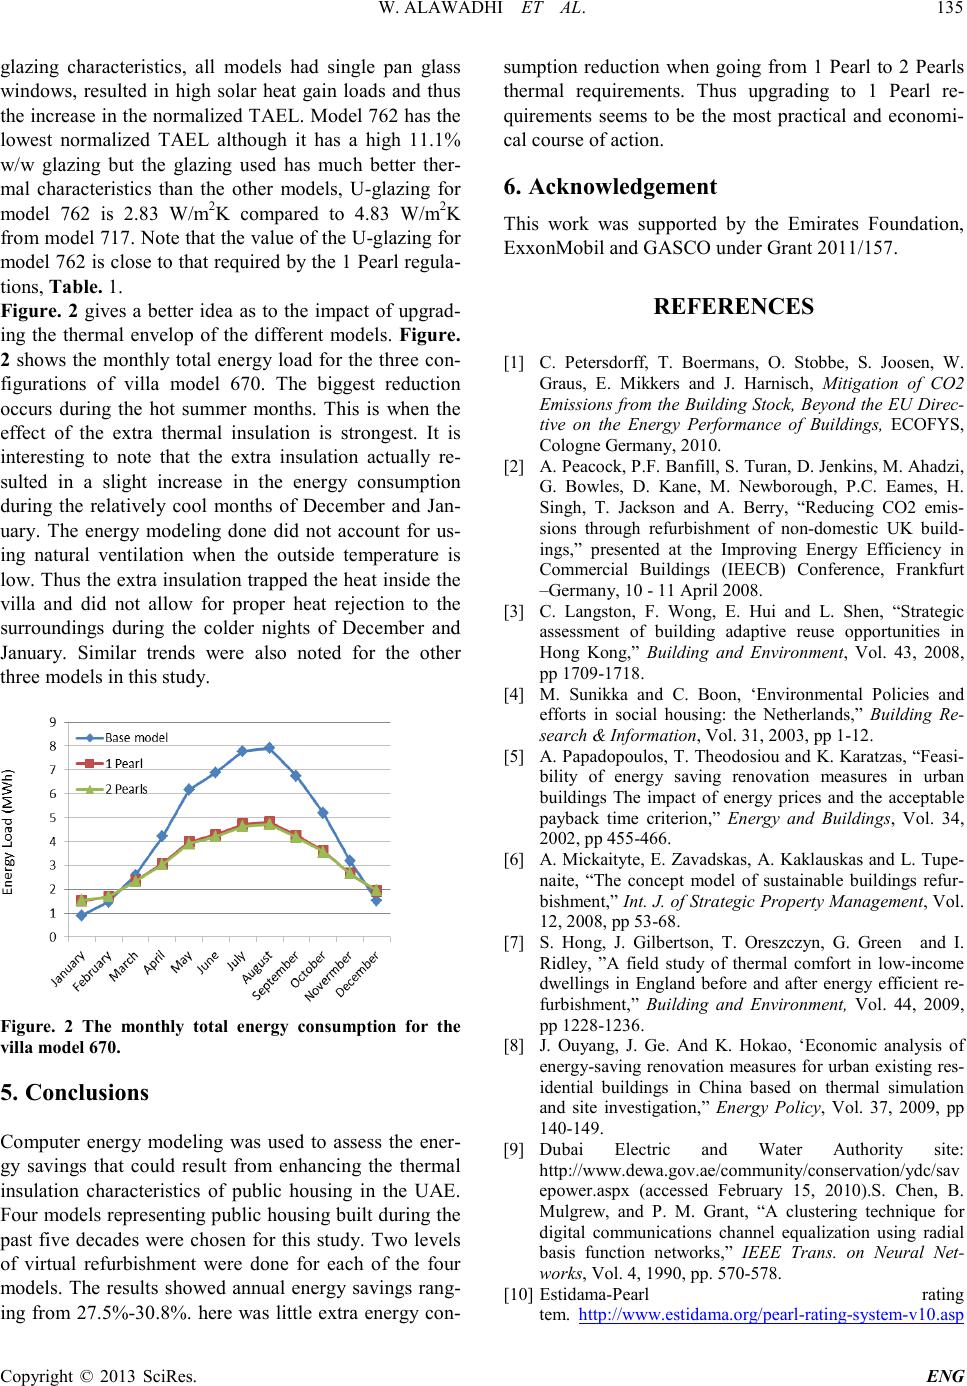
Figure. 2 gives a better idea as to the impact of upgrad-
ing the thermal envelop of the different models. Figure.
2 shows the monthly total energy load for the three con-
figurations of villa model 670. The biggest reduction
occurs during the hot summer months. This is when the
effect of the extra thermal insulation is strongest. It is
interesting to note that the extra insulation actually re-
sulted in a slight increase in the energy consumption
during the relatively cool months of December and Jan-
uary. The energy modeling done did not account for us-
ing natural ventilation when the outside temperature is
low. T hus the extra insul atio n tra pped the heat insi de the
villa and did not allow for proper heat rejection to the
surroundings during the colder nights of December and
January. Similar trends were also noted for the other
three models i n th is study.
Figure. 2 The monthly total energy consumption for the
villa model 670.
5. Conclusions
Computer energy modeling was used to assess the ener-
gy savings that could result from enhancing the thermal
insulation characteristics of public housing in the UAE.
Four models repr esenti ng publ ic housi ng buil t duri ng the
past five decades were chosen for this study. Two levels
of virtual refurbishment were done for each of the four
models. T he results sho wed annual energy savings rang-
ing from 27.5%-30.8%. here was little extra energy con-
sumption reduction when going from 1 Pearl to 2 Pearls
thermal requirements. Thus upgrading to 1 Pearl re-
quirements seems to be the most practical and economi-
cal course of action.
6. Acknowledgemen t
This work was supported by the Emirates Foundation,
ExxonMobil and GASCO under Grant 2011/157.
REFERENCES
[1] C. Petersdorff, T. Boermans, O. Stobbe, S. Joosen, W.
Graus, E. Mikkers and J. Harnisch, Mitigation of CO2
Emissions from the Building Stock, Beyond the EU Direc-
tive on the Energy Performance of Buildings, ECOFYS,
Cologne Germany, 2010.
[2] A. P eacock, P. F. Banfill , S. Turan, D. Jen kins, M. Ahadzi ,
G. Bowles, D. Kane, M. Newborough, P.C. Eames, H.
Singh, T. Jackson and A. Berry, “Reducing CO2 emis-
sions through refurbishment of non-domestic UK build-
ings,” presented at the Improving Energy Efficiency in
Commercial Buildings (IEECB) Conference, Frankfurt
German y, 1 0 - 11 April 2008.
[3] C. Langston, F. Wong, E. Hui and L. Shen, “Strategic
assessment of building adaptive reuse opportunities in
Hong Kong,” Building and Environment, Vol. 43, 2008,
pp 1709-1718.
[4] M. Sunikka and C. Boon, ‘Environmental Policies and
efforts in social housing: the Netherlands,” Building Re-
search & Information, Vol. 31, 2003, pp 1-12.
[5] A. Papadopoulos, T. Theodosiou and K. Karatzas, “F easi-
bility of energy saving renovation measures in urban
buildings The impact of energy prices and the acceptable
payback time criterion,” Energy and Buildings, Vol. 34,
2002, pp 455-466.
[6] A. Mickaityte, E. Zavadskas, A. Kaklauskas and L. Tupe-
naite, “The concept model of sustainable buildings refur-
bishment,” Int. J. of Strategic Property Management, Vol.
12, 2008, pp 53-68.
[7] S. Hong, J. Gilbertson, T. Oreszczyn, G. Green and I.
Ridley, ”A field study of thermal comfort in low-income
dwellings in England before and after energy efficient re-
furbishment,” Building and Environment, Vol. 44, 2009,
pp 1228-1236.
[8] J. Ouyang, J. Ge. And K. Hokao, ‘Economic analysis of
energy-saving renovation measures for urban existing res-
idential buildings in China based on thermal simulation
and site investigation,” Energy Policy, Vol. 37, 2009, pp
140-149.
[9] Dubai Electric and Water Authority site:
http://www.dewa.gov.ae/co mmunity/conservation/ydc/sav
epower.aspx (accessed February 15, 2010).S. Chen, B.
Mulgrew, and P. M. Grant, “A clustering technique for
digital communications channel equalization using radial
basis function networks,” IEEE Trans. on Neural Net-
works, Vol. 4, 1990, pp. 570-578.
[10] Estidama-Pearl rating
tem. http ://www.estidama.org/pearl-rating-syst em-v10.asp
W. ALAWADHI ET AL.
Copyright © 2013 SciRes. ENG
136
x?lang=en-US
[11] N. Fumo, P. Mago & R. Luck. Methodology to estimate
building energy consumption using EnergyPlus Bench-
mark Models. Energy and Buildings, Vol. 42, 2010, pp.
2331-2337.
, accessed Oct ober 2012.
[12] S. Cho & S. Haberl. Integrating Solar Thermal and Pho-
tovoltaic Systems in Whole Building Energy Simulation.
Fourth National Conference of IBPSA-USA, New York
City, New York, August 11 13, 2010, pp. 344-351
[13] J. Lam, K. Wan, D. Liu & C. Tsang. 2010. Multiple re-
gression models for energy use in air-conditioned office
buildings in different climates. Energy Conversion and
Manage ment , Vol. 51, 2010, pp. 2692-2697.
[14] D. Raia, B. Sodagarb, R. Fieldsonc & X. Hud 2011. As-
sessment of CO2 emissions reduction in a distribution
warehouse Energy, Vol. 36, 2011, pp. 2271-2277.
[15] Y. Saadah & B. AbuHijleh. 2010. Decreasing CO2 Emis-
sions and Embodied Energy during the Construc-tion
Phase Using Sustainable Building Materials. International
Journal of Sustainable Building Technology and Urban
Development, Vol. 1, 2010, pp. 115-120.
[16] S. Azhar, W. Carlton, D. Olsen & I. Ahmad. Building
information modeling for sustainable design and LEED®
rating analysis. Energy and Buildings, Vol. 42, 2010, pp.
1888-1895
[17] N. Al-Masri and B. Abu-Hijleh, ”Courtyard Hous-
ing in Midrise Buildings - An Environmental Assessment
in Hot-Arid Climate,” Renewable & Sustainable Energy
Reviews, Vol. 16, 2012, pp. 1892-1898.