Paper Menu >>
Journal Menu >>
 Engineering, 2013, 5, 115-120 doi:10.4236/eng.2013.51b021 Published Online January 2013 (http://www.SciRP.org/journal/eng) Copyright © 2013 SciRes. ENG The Research about the Trans-provincial Centralized Bidding Trading Market of East China Power Grid --I: Empirical Analysis Bin Zou 1, Xiao-jun Wang 1, Xiao-gang Li 2, Li-bing Yan g2 1School of Mechatronic Engineering and Automation, Shanghai University, Shanghai, China 2East China Power Grid Co., Ltd. Shanghai, China Email: zoubin@shu.edu.cn Received 2013 Abstract The clearing price and bidding price in electricity market are two key indicators to measure whether it is reasonable or not. Based on the grey incidence analysis, this paper studies the correlation coefficient between the clearing price and bidding price with the generation cost, the supervision and rules of the market, the supply and demand situation, the behavior of market members o ver the same period, which is based on the actual data of the trans-provincial centralized trading market of East China Power Grid. The results show that the factors affecting the clearing price and bidding price from largest to smallest are generation cost, supervision and rules of the market, the supply and demand situation, the behavior of market members. The conclusion is that the trans-provincial tradin g platform of East China Po wer Grid is a reasonable regional market which can discover the market cost, and regulate the market supply and demand balance, and promote healthy competition. Keywords: East China Po wer Grid; Trans-provincial Centralized Bidding Trading; Clearing Price; Bidding Price; Grey Incidence Analysis 1. Introduction In China, the split of power plants and power grids had been completed in 2002[1]-[4], but the electricity market has not been established. In this case, each unit was allocated a certain amount of generating energy during the next year according to the installed capacity of the unit, the unit type and the forecasting load. Then, the po wer system operation sched ules the unit outp ut to meet the actual load and guarantees annual generating energy of the unit equal to the value to be assigned. And electricity is purchased by the grid company with the benchmark price that is validated by the National Devel opme nt and Refor m Co mmissi on. This app roach is similar to the cost-based economic dispatch, which is called as planned generation in China. Even so, there is still some effort to adjust power schemes using market competition in China's power industry, the Trans-provincial Centralized Bidding Trading Market of East China Power Grid(TPMECPG) is one of these efforts[5]. East China Power Grid is an interconnected grid, which contains five provinces, and each province is a control zone. Each provincial power grid company is responsible for its own electricity and power balance. But, in order to meet the load demand, about 1% of the total energy needs to be exchanged between these provinces. The TPMECPG is an electric ity auction, and its purpose is to form energy exchange programs between provinces. The marke t co nti nues to r un t wo a nd a ha lf year s fro m December 2008 to June 2011.The market prices have been lower than the audited benchmark price of the government. Coal prices rose too fast, the government requires that all wholesale electricity prices must be the benchmark price, the market pause run. The market shows some interesting phenomenon. For example, the price has been rising from the second half of 2010; however, it has been lower than the government's benchmark price. Even so, the generation companies are still willing to participate in the market competition. What is the true power of electricity price fluctuations? It is because of the market power of generation companies or rising costs? Why power generation co mpanies are willing to participa te in market competition, even if the market price is lower than the benchmark price? 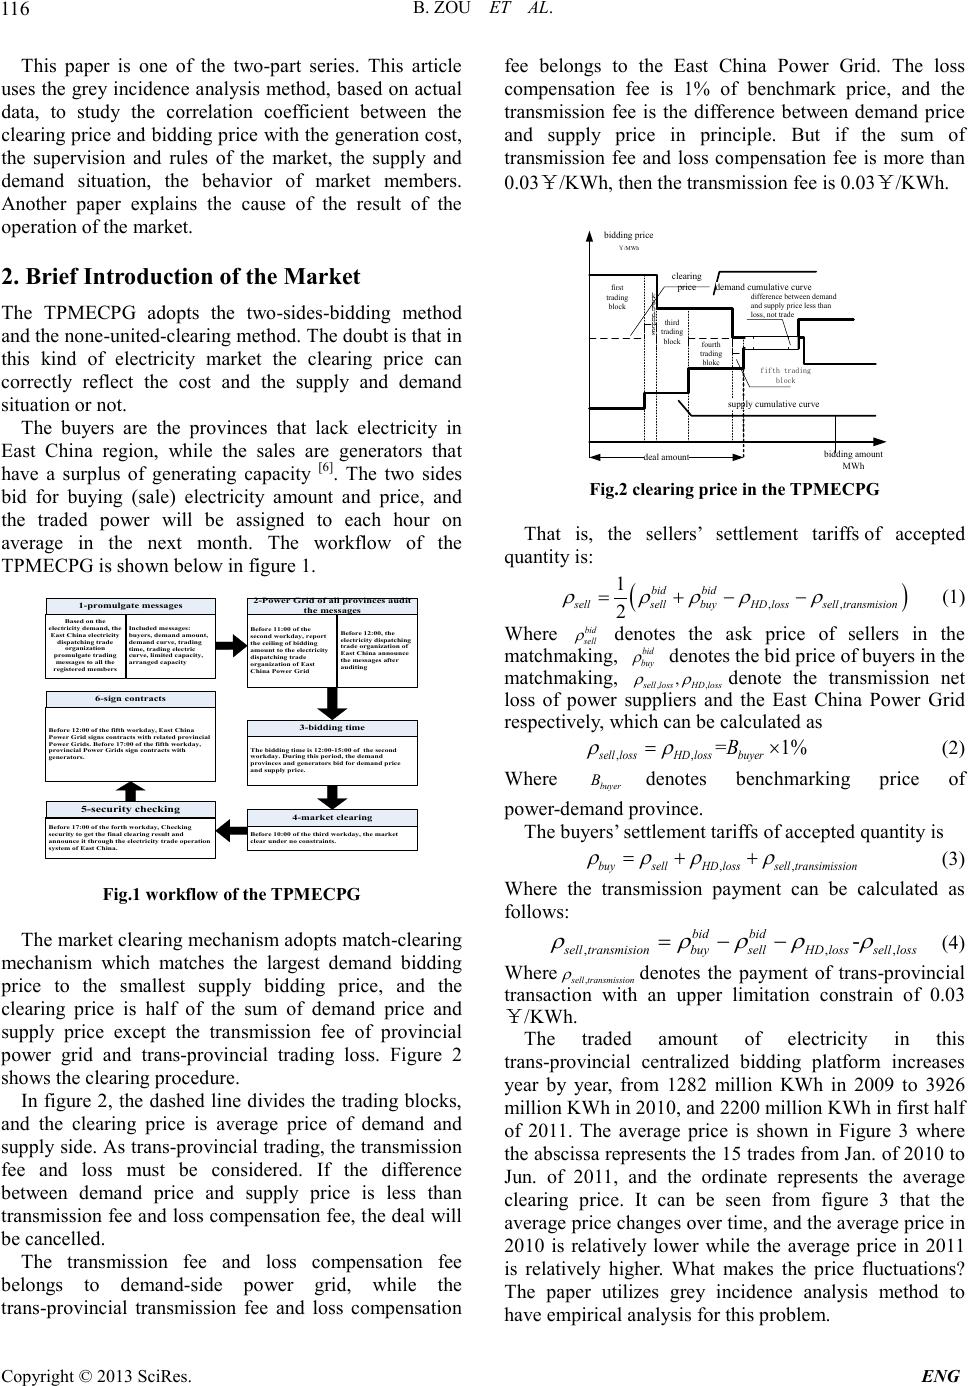 B. ZOU ET AL. Copyright © 2013 SciRes. ENG 11 6 This paper is one of the two-part series. This article uses the grey incidence analysis method, based on actual data, to study the correlation coefficient between the clearing price and bidding price with the generation cost, the supervision and rules of the market, the supply and demand situation, the behavior of market members. Another paper explains the cause of the result of the operation of the market. 2. Brief Introduction of the Market The TPMECPG adopts the two-sides-bidding method and the none-united-clearing method. The doubt is that in this kind of electricity market the clearing price can correctly reflect the cost and the supply and demand situation or not. The buyers are the provinces that lack electricity in East China region, while the sales are generators that have a surplus of generating capacity [6]. The two sides bid for buying (sale) electricity amount and price, and the traded power will be assigned to each hour on average in the next month. The workflow of the TPMECPG is shown below in figure 1. 1-promulgate messages Based on the electricity demand, the East China electricity dispatching trade organization promulgate trading messages to all the registered members Included messages: buyers, demand amount, demand curve, trading time, trading electric curve, limited capacity, arranged capacity 2-Power Grid of all provinces audit the messages Before 11:00 of the second workday, report the ceiling of bidding amount to the electricity dispatching trade organization of East China Power Grid Before 12:00, the electricity dispatching trade organization of East China announce the messages after auditing 3-bidding time The bidding time is 12:00-15:00 of the second workday. During this period, the demand provinces and generators bid for demand price and supply price. 4-market clearing Before 10:00 of the third workday, the market clear under no constraints. 5-security checking Before 17:00 of the forth workday, Checking security to get the final clearing result and announce it through the electricity trade operation system of East China. 6-sign contracts Before 12:00 of the fifth workday, East China Power Grid signs contracts with related provincial Power Grids. Before 17:00 of the fifth workday, provincial Power Grids sign contracts with generators. Fig.1 workflow of the TPMEC PG The market clearing mechanism adopts match-clearing mechanism which matches the largest demand bidding price to the smallest supply bidding price, and the clearing price is half of the sum of demand price and supply price except the transmission fee of provincia l power grid and trans-provincial trading loss. Figure 2 shows the clearing procedure. In figure 2, the dashed line divides the trading blocks, and the clearing price is average price of demand and suppl y side. As t rans-pr ovinc ial tr ading, the tr ansmission fee and loss must be considered. If the difference between demand price and supply price is less than transmission fee and loss compensation fee, the deal will be cancelled. The transmission fee and loss compensation fee belongs to demand-side power grid, while the trans-provincial transmission fee and loss compensation fee belongs to the East China Power Grid. The loss compensation fee is 1% of benchmark price, and the transmission fee is the difference between demand price and supply price in principle. But if the sum of transmission fee and loss compensation fee is more than 0.03¥/KWh, then the transmission fee is 0.03¥/KWh. deal amount supply cumulative curve demand cumulative curve bidding price ¥/MWh bidding amount MWh clearing price first trading block s e c o n d b l o c k third trading block fourth trading blokc fifth trading block difference between demand and supply price less than loss, not trade Fig.2 clearing price in the TPMECPG That is, the sellers’ settlement tariffs of accepted quantity is: ( ) ,, 1 2 bid bid sellsellbuyHD losssell transmision ρρρρ ρ =+− − (1) Where bid sell ρ denotes the ask price of sellers in the matchmaking, bid buy ρ denotes the bid price of buyers in the matchmaking, ,, , sell lossHD loss ρρ denote the transmission net loss of power suppliers and the East China Power Grid respectively, which can be calculated as ,, = 1% sell lossHD lossbuyer B ρρ = × (2) Where buyer B denotes benchmarking price of p owe r-demand province. The bu yers’ settlement tariffs of accepted quantity is ,,buysellHD losssell transimission ρ ρρρ =++ (3) Where the transmission payment can be calculated as follows: , ,, - bid bid sell transmisionbuysellHDlosssell loss ρρρρ ρ =−− (4) Where ,sell transmission ρ denotes the payment of trans-provincial transaction with an upper limitation constrain of 0.03 ¥/KWh. The traded amount of electricity in this trans-provincial centralized bidding platform increases year by year, from 1282 million KWh in 2009 to 3926 million KWh in 2010, and 2200 million KWh in first half of 2011. The average price is shown in Figure 3 where the absci ssa represents the 15 trades from Jan. of 2010 to Jun. of 2011, and the ordinate represents the average clearing price. It can be seen from figure 3 that the average price changes over ti me , and the average price in 2010 is relatively lower while the average price in 2011 is relatively higher. What makes the price fluctuations? The paper utilizes grey incidence analysis method to have empirical analysis for this prob lem. 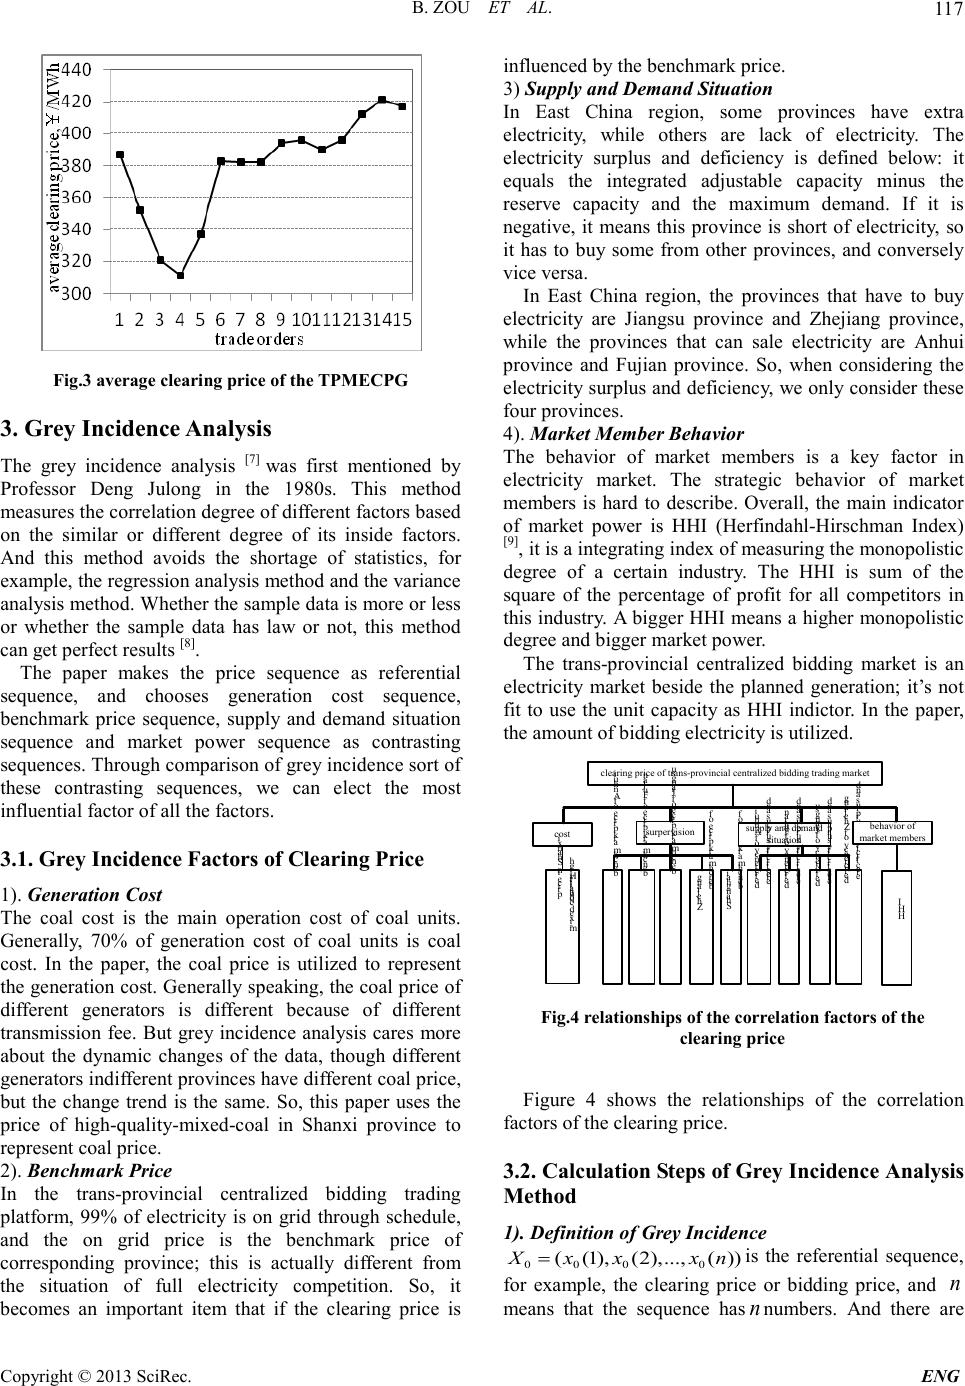 B. ZOU ET AL. Copyright © 2013 SciRec. ENG 11 7 Fig.3 average clearing price of the TPMECPG 3. Grey Incidence Analysis The grey incidence analysis [7] was first mentioned by Professor Deng Julong in the 1980s. This method measures the correlation degree of different factors based on the similar or different degree of its inside factors. And this method avoids the shortage of statistics, for example, the regre s sio n a na l ysis me t h o d and t he variance analysis met hod . Whether the sample data is mor e or l ess or whether the sample data has law or not, this method can get perfect results [8]. The paper makes the price sequence as referential sequence, and chooses generation cost sequence, benchmark price sequence, supply and dema n d situation sequence and market power sequence as contrasting sequences. Thr o ugh c ompari s on o f grey incid ence sort of these contrasting sequences, we can elect the most influential factor of all the factors. 3.1. Grey Incide nce Factors of Clearing Price 1). Generation Cost The coal cost is the main operation cost of coal units. Generally, 70% of generation cost of coal units is coal cost. In the paper, the coal price is utilized to represent the ge nerati on cost . Generally speaking, the coal price of different generators is different because of different transmission fee. But grey incidence analysis cares more about the dynamic changes of the data, though different generators indifferent provinces have different coal price, but the change trend is the same. So, this paper uses the price of high-quality-mixed -coal in Shanxi province to represent coal price. 2). Benchmark Price In the trans-provincial centralized bidding trading platform, 99% of electricity is on grid through schedule, and the on grid price is the benchmark price of corresponding province; this is actually different from the situation of full electricity competition. So, it becomes an important item that if the clearing price is influenced by the benchmark price. 3) Supply and Dem and Situation In East China region, some provinces have extra electricity, while others are lack of electricity. The electricity surplus and deficiency is defined below: it equals the integrated adjustable capacity minus the reserve capacity and the maximum demand. If it is negative, it means this province is short of electricity, so it has to buy some from other provinces, and conversely vice versa. In East China region, the provinces that have to buy electricity are Jiangsu province and Zhejiang province, while the provinces that can sale electricity are Anhui province and Fujian province. So, when considering the electricit y surp lus and deficienc y, we only consider these four provinces. 4). Market Member Behavior The behavior of market members is a key factor in electricity market. The strategic behavior of market members is hard to describe. Overall, the main indicator of market power is HHI (Herfindahl-Hirschman Index) [9], it is a integrat ing i ndex of measurin g the monopo listic degree of a certain industry. The HHI is sum of the square of the percentage of profit for all competitors in this i ndustr y. A bigger HHI mea ns a higher mo nopoli stic degree and bigger market power. The trans-provincial centralized bidding market is an electricity market beside the planned generation; it’s not fit to use the unit capacity as HHI indictor. In the paper, the amount of bidding electricity is utiliz e d. Figure 4 shows the relationships of the correlation factors of the clearing price. 3.2. Calculation Steps of Grey Incidence Analysis Method 1). Definition of Grey Incidenc e 000 0 ((1), (2),..., ())Xx xxn= is the referential sequence, for example, the clearing price or bidding price, and n means that the sequence has n numbers. And there are clearing price of trans-provincial centralized bidding trading market surpervision b e n c h m a r k p r i c e o f A n h u i b e n c h m a r k p r i c e o f F u j i a n b e n c h m a r k p r i c e o f J i a n g s u b e n c h m a r k p r i c e o f Z h e j i a n gb e n c h m a r k p r i c e o f S h a n g h a i supply and demand situation e l e c t r i c i t y s u r p l u s a n d d e f i c i e n c y o f A n h u i e l e c t r i c i t y s u r p l u s a n d d e f i c i e n c y o f F u j i a n e l e c t r i c i t y s u r p l u s a n d d e f i c i e n c y o f J i a n g s u e l e c t r i c i t y o f s u r p l u s a n d d e f i c i e n c y o f Z h e j i a n g cost H i g h - q u a l i t y - m i x e d c o a l p r i c e i n S h a n x ibehavior of market members H H I Fig.4 relationships of t he correlation factors of the clearing price  B. ZOU ET AL. Copyright © 2013 SciRes. ENG 11 8 m correlation factors, ((1), (2),..., (),),1,2,..., iii i Xxxxn im= = , which also named contrasting sequences. Then the grey incidence of the k-th data of i X and 0 X is defined as below: 00 000 minmin|( )( )|maxmax|( )( )| ((),( ))| ()()|maxmax| ()()| ii ik ik iii ik xk xkxk xk xk xkxk xkxk xk ρ ξρ − +×− =− +×− (1) ρ is the differential coefficient, and [0,1] ρ ∈ . In the paper, 0.5 ρ = . The grey i ncidence of i X and 0 X is defined belo w: 00 1 1 (,)((),( )) n ii k XXxk xk n γξ = = ∑ (2) Usually, 0 (,) i XX γ is also written as 0i γ , and 0 (( ),( )) i xk xk ξ is also writte n as 0i ξ . 2). Calculatio n Steps Step 1: Unitary operation for all data. That is, every data in a certain sequence is divided by the maximum data of this seque nce. 'max ' '' /((1), (2),..., ());0,1,2,..., i iiiii XXXxxxn im= == (3) max i X is the maxi mum da ta of i X . Step 2: get the difference sequences. The m contrasting sequences mi nus t he ref erenti al seque nce to get the difference sequences. '' 0 () |()()| ((1), (2),..., ());1,2,..., ii iii i kxk xk ni m ∆= − ∆=∆ ∆∆= (4) Step 3: get the maximum and minimum difference. max max() i ik Max k= ∆ (5) min min() i ik Min k= ∆ (6) Step 4: get the incidence coefficient. According to (1), (5) and (6) 0 0.5 ( );1,2,...,;1,2,..., ( )0.5 i i Min Max kkni m k Max ξ +× == = ∆ +× (7) Step 5: get the grey incidence. According to (2) and (6) 00 1 1( );1,2,..., n ii k ki m n γξ = = = ∑ (8) 3). Data Initializatio n Before calculating the grey incidence, there must be initialization to getting rid of the da ta . a) Some sequences may be much bigger than the others, it’s necessary to have unitary operation before calculation. In the paper, all the data in a certain sequence is divided by the maximum value of this sequence. b) Due to the use of absolute value of difference between referential sequence and contrasting sequence in defini tion of gre y incidence, it must guarantee that if the contrasting sequence becomes bigger, the referential sequence must also become bigger, and this is called positive ope r a tion. The d e ta ils are shown as belo w. Higher coal price turns to higher clearing price, and higher b enc h ma rk p r ic e t ur ns to hi gher clearing price, so, they have already met the positive relationship. Bigger electricity surplus and deficiency fo r generators in suppl y provinces means a more enough supply which results to a lower clearing price, it must have positive operation before calculating, so the recipro cal of electricity surplus and deficiency is used. The electricity surplus and deficiency in demand provinces is negative, if the absolute value of this negative value is bigger, then it means the demand amount is bigger, and then the Tab.1 data of clearing price, bidding price, coal price, electricity surplus and deficiency and HHI year month clearing price(¥/MWh) bidding price (¥/MWh) coal pric e (¥/ton) electricity surplus and deficiency(104KWh) HHI Zhejiang Jiangsu Anhui Fujian 2010 Jan. 387 - 795 -283.8 -91.0 72.0 84.0 0.212 Mar. 325 299 679 -21.6 402.0 59.0 90.0 0.156 Apr.(1) 321 311 684 -10.0 511.0 155.0 251.0 0.285 Apr.(2) 311 277 684 -10.0 511.0 155.0 251.0 0.327 May 337 233 745 97.2 319.0 150.0 269.0 0.102 Jul. 383 370 748 -282.9 -179.0 87.0 390.0 0.170 Aug. 382 370 725 -196.3 -194.0 82.0 311.0 0.153 Dec. 382 375 789 -191.1 381.0 147.0 257.0 0.174 2011 Jan. 394 385 774 -258.0 -462.0 77.0 195.0 0.095 Jan.-Feb. 396 - 775 -305.0 -566.0 97.0 334.0 0.250 Feb. 390 373 765 -305.0 -566.0 97.0 334.0 0.103 Mar. 396 385 761 -151.0 -613.0 9.0 99.0 0.098 Apr. 412 - 780 -332.0 -163.0 88.0 97.0 0.167 May 421 - 817 -181.0 -57.0 20.0 53.0 0.167 Jun. 417 396 838 -9.0 -222.0 20.0 248.0 0.094 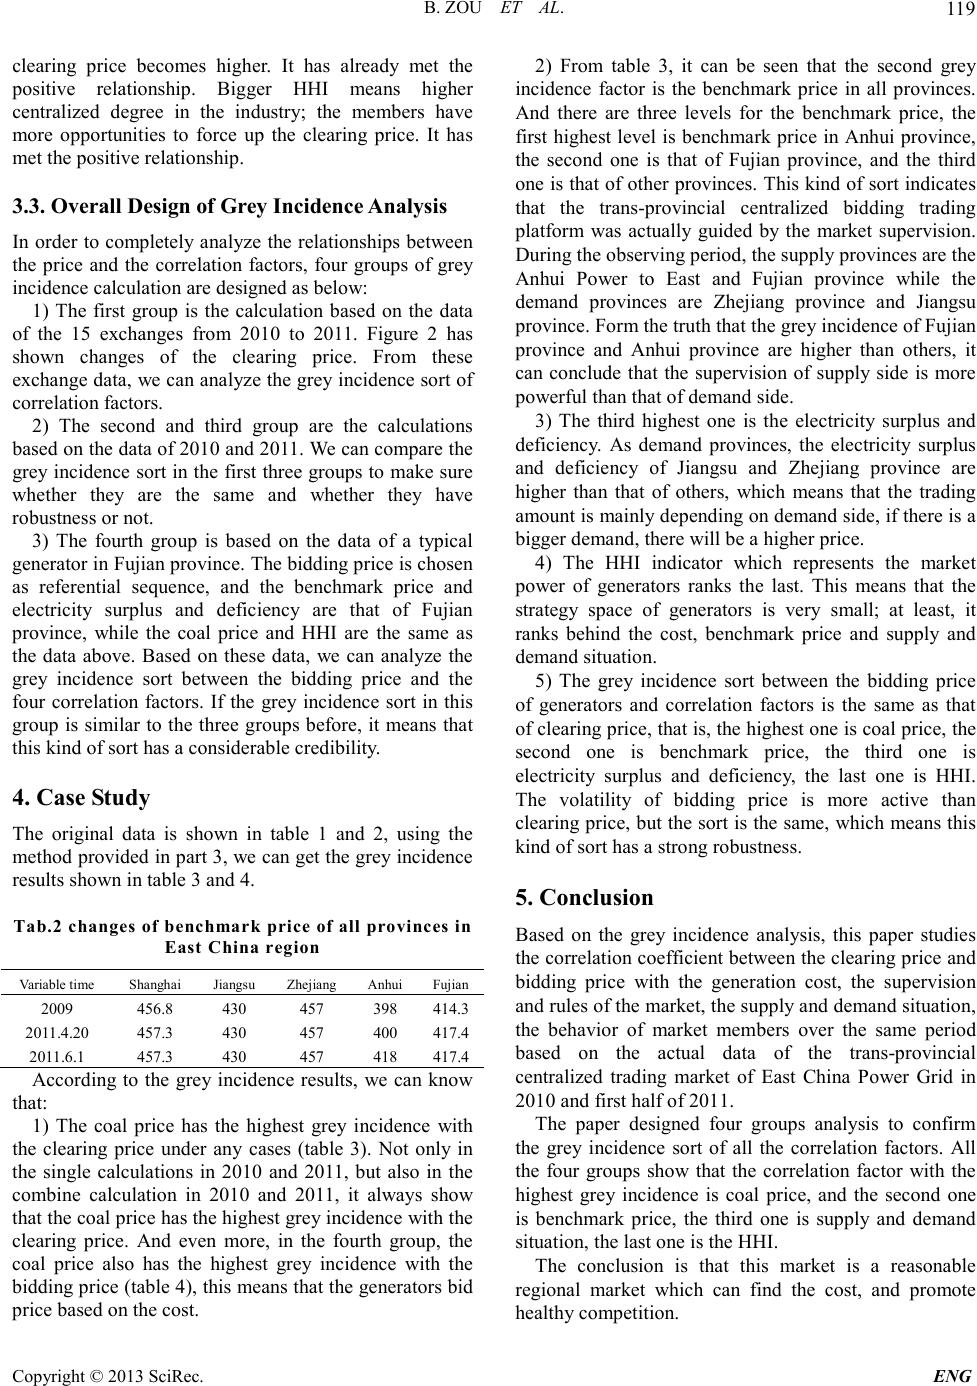 B. ZOU ET AL. Copyright © 2013 SciRec. ENG 11 9 clearing price becomes higher. It has already met the positive relationship. Bigger HHI means higher centralized degree in the industry; the members have more opportunities to force up the clearing price. It has met the positive relationship. 3.3. Overall Design of Grey Incidence Analysis In order to completely analyze the relationships between the price and the correlation factors, four groups of grey incidence calculatio n are designed as below: 1) The first group is the calculation based on the data of the 15 exchanges from 2010 to 2011. Figure 2 has shown changes of the clearing price. From these exchange data, we can analyze the grey incidence sort of correlation factors. 2) The second and third group are the calculations based on the data of 2010 and 2011. We can compare the grey incidence sort in the first three gr oups to make sur e whether they are the same and whether they have robustness or not. 3) The fourth group is based on the data of a typical gener ato r i n F uj i an p r ovi nc e . T he b id d ing price is cho sen as referential sequence, and the benchmark price and electricity surplus and deficiency are that of Fujian province, while the coal price and HHI are the same as the data above. Based on these data, we can analyze the grey incidence sort between the bidding price and the four correlation factors. If the grey incidence sort in this group is similar to the three groups before, it means that this kind o f sort has a considerable credibility. 4. Case Study The original data is shown in table 1 and 2, using the method provided in part 3, we can get the grey incidence resul ts shown in table 3 and 4. Tab. 2 cha nges of benc hmar k price of all provi nces i n East China reg ion Variable ti me S hanghai Jiangsu Zhejiang Anhui Fujian 2009 456.8 430 457 398 414.3 2011.4.20 457.3 430 457 400 417.4 2011.6.1 457.3 430 457 418 417.4 According to the grey incidence results, we can know that: 1) The coal price has the highest grey incidence with the clearing price under any cases (table 3). Not only in the single calculations in 2010 and 2011, but also in the combine calculation in 2010 and 2011, it always show that the coal price has the highest grey incidence with the clearing price. And even more, in the fourth group, the coal price also has the highest grey incidence with the bidding pric e (table 4 ), this means that t he generator s bid price based on the cost. 2) From table 3, it can be seen that the second grey incidence factor is the benchmark price in all provinces. And there are three levels for the benchmark price, the first highest level is benchmark price in Anhui province, the second one is that of Fujian province, and the third one is that of other p rovinces. This kind of sort indicate s that the trans-provincial centralized bidding trading platform was actually guided by the market supervision. During the observing period, the supply provinces are the Anhui Power to East and Fujian province while the demand provinces are Zhejiang province and Jiangsu province. F orm the truth that the gre y incidence o f Fuj ian province and Anhui province are higher than others, it can conclude that the supervision of supply side is more powerful than that of demand s ide. 3) The third highest one is the electricity surplus and deficiency. As demand provinces, the electricity surplus and deficiency of Jiangsu and Zhejiang province are higher than that of others, which means that the trading amount is mainly depending on demand side, if there is a bigger demand, there will be a higher price. 4) The HHI indicator which represents the market power of generators ranks the last. This means that the strategy space of generators is very small; at least, it ranks behind the cost, benchmark price and supply and dema nd situatio n. 5) The grey incidence sort between the bidding price of generators and correlation factors is the same as that of clearing price, that is, the highest one is coal p rice, the second one is benchmark price, the third one is electricity surplus and deficiency, the last one is HHI. The volatility of bidding price is more active than clearing price, but the sort is the same, which means this kind of sor t has a strong robustness. 5. Conclusion Based on the grey incidence analysis, this paper studies the correlation coefficient between the clearing price and bidding price with the generation cost, the supervision and r ule s o f t he mar ket , the su p p ly a nd demand s it ua tion, the behavior of market members over the same period based on the actual data of the trans-provincial centralized trading market of East China Power Grid in 2010 and first half of 2011. The paper designed four groups analysis to confirm the grey incidence sort of all the correlation factors. All the four groups show that the correlation factor with the highest grey incidence is coal price, and the second one is benchmark price, the third one is supply and demand situation, the la st o ne is the HHI. The conclusion is that this market is a reasonable regional market which can find the cost, and promote healthy competition.  B. ZOU ET AL. Copyright © 2013 SciRes. ENG 120 REFERENCES [1] Barkovich, B. R., “Electric Power Deregulation-End of Monopoly,” Cement Industry. Technical Conference, 1996, 4:315-321. [2] Sand er H., Schwab J., Muh r M. , “The Deregulation of the Electricity Market in the View of a Regional Austrian Utility,” Electricity Distribution, 200 1, 6(6):5. [3] Littlechild, S. C., Privatization, “Competition and Regulation in the British Electricity Industry,” Advances in Power System Control, Operation and Management, 2000, 11(1):10. [4] Key Moon, “Power Plants Separated from Electric Network and Electric Power market,” Electric Economy, 2000(12). [5] East China Electricity Regulatory Commission,“East China Trans-provincial Centralized Auction Power Market Achieved Remarkable Success on Energy Saving and Emission Reduction[R],” 2010(in Chinese). http://www.serc.gov.cn/jgdt/pcjg/2010004/t20100402_12 861.htm. [6] National Electricity Regulatory Commission, “The Instruction that Accelerating the Development of the Trans-provincial Centralized Bidding Transactions in East China[R],” 2009(in Chinese). http://www.ecerb.gov.cn/publicJsp/detail.JSP?inforId=85 86. [7] Cheng Cheng, Li Chun-jie, “Application of Grey Incidence Analysis in Regional Electricity Market Efficiency Evaluation,” Journal of North China Electric Power University (Social Sciences), No. 3, 2010, pp. 10-13. [8] Liu Si -feng, Dang Zhi-guo, Fa ng Z h i-geng. “Gre y s ystem theory and application,” Science Press, Beijing, 20 04. [9] Kanagala A, Sahni M, Sharma S, Gou B, Yu J., “A Probabilistic Approach of Hirschman–Herfindahl index (HHI) to Determine Possibility of Market Power Acquisition,” In: IEEE C onference, 2004. Tab.3 grey incidence results of c learing price in 2010 and first hal f of 2011 correlat ion factors all data 2010 2011 grey incidence sort grey incidence sort grey incidence sort high-quality-mixe d coal pr ice in Shanxi 0.93 1 0.92 1 0.96 1 benc hm a rk price in A n hui 0.89 2 0.85 3-7 0.96 2 benc hm a rk price in F uji a n 0.85 3 0.85 0.93 3 benc hm a rk price in Sh angha i 0.84 4-6 0.85 0.92 4-6 benc hm a rk price in Ji ang su 0.84 0.85 0.92 benc hm a rk price in Zhejiang 0.84 0.85 0.92 electricity surplus and deficiency in Jiangsu 0.66 7 0.58 9-10 0.68 8 electricity surplus and deficiency in Zhejiang 0.65 8 0.58 0.71 7 electricity surplus and deficiency in Fujian 0.61 9 0.84 8 0.52 10 electricity surplus and def iciency in Anh ui 0.59 10 0.88 2 0.47 11 HHI 0.56 11 0.47 11 0.56 9 Tab.4 grey incide nce orders of bidding price of ge nerators correlation factors all d ata 2010 2011 grey incidence sort grey incidence grey incidence sort grey incidence high-quality-mixed coal price in Shanxi 0.89 1 0.78 0.89 1 0.78 benc hm a rk price in F uji a n 0.83 2 0.71 0.83 2 0.71 electricity surplus and deficiency in Fujian 0.63 3 0.66 0.63 3 0.66 HHI 0.58 4 0.47 0.58 4 0.47 |