 J. Biomedical Science and Engineering, 2010, 3, 868-883 doi:10.4236/jbise.2010.39117 Published Online September 2010 (http://www.SciRP.org/journal/jbise/ JBiSE ). Published Online September 2010 in SciRes. http://www.scirp.org/journal/jbise Identification of the interactive region by the homology of the sequence spectrum Masatoshi Nakahara1, Masaharu Takeda2* 1Department of Computer and Information Sciences, Sojo University, Ikeda, Kumamoto, Japan; 2Department of Materials and Biological Engineering,Tsuruoka National College of Technology, Tsuruoka, Yamagata, Japan. Email: mtakeda@tsuruoka-nct.ac.jp Received 4 June 2010; revised 9 July 2010; accepted 12 July 2010 ABSTRACT The base sequence in genome was governed by some fundamental principles such as reverse-complement symmetry, multiple fractality and so on, and the anal- ytical method of the genome structure, the “Sequence Spectrum Method (SSM )”, based on the struct ural f ea - tures of genomic DNA faithfully visualized these prin- ciples. This paper reported that the sequence spec- trum in SSM closely reflected the biological phe- nomena of protein and DNA, and SSM could identify the interactive region of protein-protein and DNA- protein uniformly. In order to investigate the effec- tiveness of SSM we analyzed the several protein- protein and DNA-protein interaction published pri- marily in the genome of Saccharomyces cerevisiae. The method proposed here was based on the homology of sequence spectrum, and it advantageously and sur- prisingly used only base sequence of genome and did not require any other information, even information about the amino-acid sequence of protein. Eventually it was concluded that the fundamental principles in genome governed not only the static base sequence but also the dynamic function of protein and DNA. Keywords: Spectrum of Genome Base Sequence; Ho- moology of Sequence Spectrum; Interactive Region; Reversese-Complement Symmetry; Multiple Fractality; Analytical Method Of Genome 1. INTRODUCTION As described in the previously [1,2], it was very impor- tant to investigate the structure of the entire genome be- cause the four bases should be arranged in a sophisti- cated fashion in the genome, and essentially the base sequences might reflect the conformations of protein, RNA and DNA. DNA sequences were deeply affected by the adjoining sequences. In other words, the non-cod- ing sequences might play some important roles to express each gene (the coding sequences) in genome. That is, not only the coding region, but also the non-coding region might be necessary to transmit and to transform the bio- logical information precisely, rapidly, and stably. There- fore, if we would find meaningful structure in the ge- nome, we might also obtain important information about the functions of protein, RNA and DNA from their structure. Previously, we showed that the four bases in genomic DNA were organized based on the generation-rules in all organisms by analyzing the appearance frequency of the bases, and we proposed three generation-rules of the base sequences in a single-strand of DNA: 1) reverse-com- plement symmetry of the 1 ~ 9 successive base sequen- ces, 2) multiple fractality of each base distribution de- pending on the distance, and 3) bias of four bases, A, T, G and C. These rules were universally observed regard- less species [1]. Further we also defined the sequence spectrum by the appearance frequency of the base se- quence in genome, and we have developed the powerful method “Sequence Spectrum Method (SSM)” in order to visualize and analyze the generation-rules in entire geno- me explained above. As one of important results, we re- vealed by using SSM that there was the remarkable ho- mology of sequence spectrum between proteins and tR- NAs [2]. This fact suggested the sequence spectrum could be closely associated with the function of protein, and the homology of sequence spectrum could be related to the mutual interactive region. Identification of mutual interactive region of protein, RNA and DNA was defi- nitely important to figure out their functions, and usually the homology of base sequence or amino-acid sequence was used for it. To investigate the effectiveness of SSM, in this paper, we showed that SSM could identify the interactive region of the protein-protein and the protein-DNA by the ho- mology of the sequence spectra. The advantages of the proposed method were as follows. 1) It used only base sequence of genome and did not  M. Nakahara et al. / J. Biomedical Science and Engineering 3 (2010) 868-883 Copyright © 2010 SciRes. JBiSE 869 require any other information, even information about amino-acid sequence of protein. As SSM faithfully re- flected the biological information, the conservation of the bases sequences of genomic DNA was also conserved in the translated amino acids sequence of the protein se- quence [1,2]. 2) It could identify the interactive region of both pro- tein-protein and protein-DNA in completely the same manner. 3) It could be executed fully on a personal computer and did not require a special high performance computer. Moreover the identification was done in a few seconds. 2. MATERIALS AND METHODS 2.1. Sequence Spectrum Method (SSM) SSM was carried out in the same way as the published procedures [2]. The outline of the proposed method was as follows. The base sequence of interest was sectioned by a small number of bases from the top (5’-end). The key sequences of the nine successive base sequences (d = 9) was 262,144 sequences (= 49, Reference [2]). The appearance frequency of the key sequence was counted in the entire genome, and was plotted at the position of the first base of the key sequence as described in the next paragraph. These procedures were carried out for the entire base sequence of interest with one base shift (p = 1). The next step was to average the appearance fre- quencies so that a recognizable pattern of appearance frequency was obtained for the base sequence. This pat- tern of the averaged appearance frequency was called the “sequence spectrum”. Finally, the homology factor be- tween two sequence spectra was calculated to determine the degree of homology. The exact procedure was ex- plained below in a mathematical way. Let S be an entire set of base sequences, and B = [bi] be a partial set of interest in S. A base element was deno- ted by bi (i = 1..M), and M was the base sequence size of B. The base element bi become A (adenine), T (thymine), G (guanine) or C (cytosine). The key sequence ki and the appearance frequency fi were defined for bi as follows. Key sequence ki : base sequence comprised of sequen- tial base elements bi~bi+d-1 (d : base size of the key se- quence). Appearance frequency fi : appearance count of ki in S. The key sequence ki was compared with the base se- quence of the entire set S, and the appearance frequency fi was increased by one every time the key sequence ki matches the partial base sequence of the entire set S. This procedure was iterated for all key sequences ki to obtain fi (i = 1..M). In practice all fi were counted and tabulated in advance by scanning all base sequence in S. Consequently, the appearance frequency vector F = [fi] (i = 1..M) was determined (actually, the appearance fre- quencies for the last (d-1) base elements of B could not be calculated; however, this was neglected because M >> d-1). Next, the appearance frequency fi was averaged as follows: j mi mij si f m f 12 1 where the parameter m was average width. This aver- aged appearance frequency Fs = [fsi] (i = 1..M) was called the “sequence spectrum”. The next step was to calculate the homology factor to determine the degree of homology. The homology factor determines the homologous region of a target base se- quence with respect to a reference base sequence. In order to derive the homology factor, the mutual correlation function MF within the window width of homology was calculated as w k kjj w k kii jkjj w k kjj iki w k ikii j w k kjiki ji ij fst w fst fsr w fsr fstfstfstfstFst fsrfsrfsrfsrFsr fstfstfsrfsr FstFsr FstFsrMF 1 1 1 1 1 1 1 )(*)( )(*)( )(*)( 1 ),( where Fsr— sequence spectrum of the reference base se- quence Fst— sequence spectrum of the target base sequence w— window width of homology The mutual correlation function MF ranges from -1 to 1, and then the homology factor HF was defined as [%]100* 2 )1( ),( ij ij MF FstFsrHF The higher the homology factor, the more similar the sequence spectra were. The similar regions of the target base sequence with respect to the reference base se- quence were obtained by calculating the homology fac- tors HFij for all i (i = 0..Mr-w, Mr: size of reference se- quence) and j (j = 0..Mt-w, Mt: size of target sequence). When the base sequence was very large, elements of the sequence spectrum were skipped by the size factor p  M. Nakahara et al. / J. Biomedical Science and Engineering 3 (2010) 868-883 Copyright © 2010 SciRes. 870 (http://www. yeastgenome.org/). to reduce the size as follows. NCBI genome data base. (2010) (http://www.ncbi.nlm. nih.gov/sites/entrez?db=genome). 1*)1( pii fsfs For instance, when p = 2 ...,,...,,531321 fsfsfsfsfsfs 2.2. Appearance Frequencies of Bases This operation reduced the size to 1/p. For nine successive bases, the appearance frequency was counted for the entire genome by matching from the start of the base sequence in a genome with one base shift (p = 1) as follows. The base sequences of the genomes were obtained from the databases listed below. Saccharomyce Genome Database. (2010) Ex. Nine successive bases: AATAAAGAA AATA AAGAA (one base shift) Base Sequence: 5’-ATCGAATAAAGAACCGTTCGGTAAGTCGAATAAAGAAT-CTGGCATTT-3’ 1 2 Count of AATAAAGAA: 2 In the case of the genome composed of the plural chr- omosomes such as S. cerevisiae, we have calculated the sum of the base frequencies of the 16 chromosomes (in numeric order) plus mtDNA [1]. 2.3. The Parameters “d”-, “m”- , “p”-, and “w”-Values of SSM Analysis for the Interaction JBiSE Controllable parameters in the sequence spectrum were the base size “d” of the key sequence, the average width “m”, the skip base number (the size factor) “p” and the window width “w” of homology. The parameter “d” de- termined the highest resolution for extracting the structural feature of the base sequence. Therefore this parameter should be chosen to be as a large value as possible to extract the exact feature. The large “m” values were usu- ally used to obtain the overall features of the structure, and smaller “m” values were applied to investigate the structure in detail. The value of “m” normally ranges from 1/10 to 1/100 of the base sequence size [2]. This parame- ter was adjusted to the base sequence size especially when the homology factor between a small reference and a large target was calculated [2]. The window width of homology, “w” determined the width of similar region to identify. In this paper the values of “d”, “m”, “p” and “w” were 9, 10, 1 and 200, respectively, to identify the interactive region of protein and DNA. In figures of the sequence spectrum the horizontal pa- rameter was the base size of sequence, M of each gene or genomic DNA, and the vertical parameter was the se- quence spectrum. These parameters were appropriately scaled to show the similar region clearly. 2.4. Procedure of Identification of the Interactive Region by SSM To simplify the procedure, it was assumed that the inter- active region of one protein was given (shown in pur- ple-blue), and SSM identified the interactive region of the other protein (shown in red). The procedure to iden- tify the interactive regions of two proteins by SSM was as follows. In the following procedure one of two pro- teins was replaced by DNA when the protein-DNA in- teraction was investigated. [Step 1] One protein with the given interactive region (shown in purple-blue) was designated as a reference protein, and the other protein with the interactive region (shown in red) which SSM identified was designated as a target protein. [Step 2] The sequence spectra of both the reference and target proteins were calculated. [Step 3] The similar regions between the sequence spec- tra of the reference and target proteins were calculated. [Step 4] The pair of similar regions (red/purple-blue) with the highest homology factor (HF) was selected as a candidate of interactive regions. [Step 5] The base sequence of the reference protein was converted to be the reverse complementary and the steps [2-4] were repeated because of the reverse-com- plement rule in genome. [Step 6] In two candidates obtained in steps [4] and [5], the similar region of the target protein with higher HF was called first identified region, and the other was called second identified region. 3. RESULTS AND DISCUSSION This section demonstrates that the homology of the se- quence spectrum was closely associated with the mutual interaction of proteins or DNA. The identified interac- tive regions of the proteins were all the first identified regions in the examples below. We showed some of the interactive regions analyzed by SSM in this section. 3.1. Mutual Interaction of Protein-Protein 1) MAS1 and MAS2  M. Nakahara et al. / J. Biomedical Science and Engineering 3 (2010) 868-883 Copyright © 2010 SciRes. JBiSE 871 Figure 1 showed the interactive region (in purple-blue) of MAS1 [Mas1p (β-MPP), Reference [3]] - MAS2 [Mas- 2p (α-MPP), Reference [4]]. These proteins formed a complex to cleave the mitochondrial targeting signal of precursors. In Figure 1(a) the active region (in pur- ple-blue) around the key amino acid E73 of MAS1 (Mas1p) was the reference, and the whole coding region of MAS 2 (Mas2p) was the target (Figure 1(b)). Previous reports proposed a model in which the glycine-rich re- gion of MAS2 (Mas2p, in red) cooperated with the active region of MAS1 (Ma- s1p, in purple-blue). Our results strongly supported this model because the most similar region of MAS2 (in red; HF = 90.5%) with the active region of MAS1 (in purple-blue) was completely identi- cal to the reported glycine-rich region [5,6, in red]. Moreover, the positions of the key amino acids in both proteins (E73 in Mas1p and K296 in Mas2p) were also identical. Figure 1. Sequence spectra of MAS1 and MAS2 (d = 9, m = 10,p = 1). (a) Coding region of MAS1 (Mas1p, M = 1,386). The active region of MAS1 (Ma- s1p, reference: M = 200, in purple-blue). This region (corresponding to E46 – E106) carries the characteristic metal-binding motif associated with the cata- lytic activity (5, 6). (b) Coding region of MAS2 (Mas2p) containing the 5’- and 3’- non-coding region (target: M = 1,446). The region most similar to the reference is shown in red (HF = 90.5%). The most similar region is gly- cine-rich and closely related to the catalytic function (I261 – G327 of Mas2p). E73 (shown in red letter) of Mas1p presumably interacts with K296 (shown in red letter) of Mas2p (position of arrowhead). The scales of the axes for the sequence spectra of the similar regions were the same. The amino acid se- quences of Mas1p and Mas2p neighboring the interactive regions were shown in figures, respectively.  M. Nakahara et al. / J. Biomedical Science and Engineering 3 (2010) 868-883 Copyright © 2010 SciRes. JBiSE 872 2) PHO4 and PHO80 Figure 2 showed the sequence spectra of PHO4 (a, Pho4p, reference: the interactive region around the key amino acid P174, in purple-blue) and PHO80 (b, Pho80p, target: the whole coding region). PHO4 (Pho4p) was a transcription factor, and PHO80 (Pho80p) inhibited the transcriptional function of PHO4 (Pho4p). Ogawa & Os- hima [7] and Okada & Toh-e [8] reported that there was interaction between P174 in Pho4p and M42 in Pho80p, respectively. The red region in (b) in which M42 (Figure 2(b), arrow head) of Pho80p was located was the region most similar to the reference region of Pho4p, in which P174 (Figure 2(a), arrow head) was located (HF = 89.1%). The interactive regions between Pho4p and Ph- o80p were also discussed in the Pho2p results (6) later. 3) RPB2 and RPB12 Figure 3 showed the sequence spectra of RPB2 and RPB12. The RPB protein family forms DNA-directed RNA polymerase II [9]. RPB2 (Rpb2p encoding gene) and RPB12 (Rpb12p) were members of the family, and RBP12 (Rpb12p) combined with RPB2 (Rpb2p). Rpb12p was a very small protein with 70 amino acids whereas Figure 2. Sequence spectra of PHO4 and PHO80 (d = 9, m = 10, p = 1). (a) Cod- ing region of PHO4 (Pho4p, M = 936, the active region was shown in purple-blue). (b) Coding region of PHO80 (Pho80p, target: M = 880). The region most similar to the reference is shown in red (HF = 89.1%). It has been shown that P174 (shown in red letter) of Pho4p interacts with M42 (shown in red letter) of Pho80p [7, 8]. The arrowhead in each spectrum respectively indicates the position of the amino acid P174 of Pho4p, and M42 of Pho80p. The scales of axes in (a) and (b) are the same. The amino acid sequences of Pho4p and Pho80p neighboring the interactive re- gions were shown in figures, respectively. The red letter indicated to report as a functional amino acid. 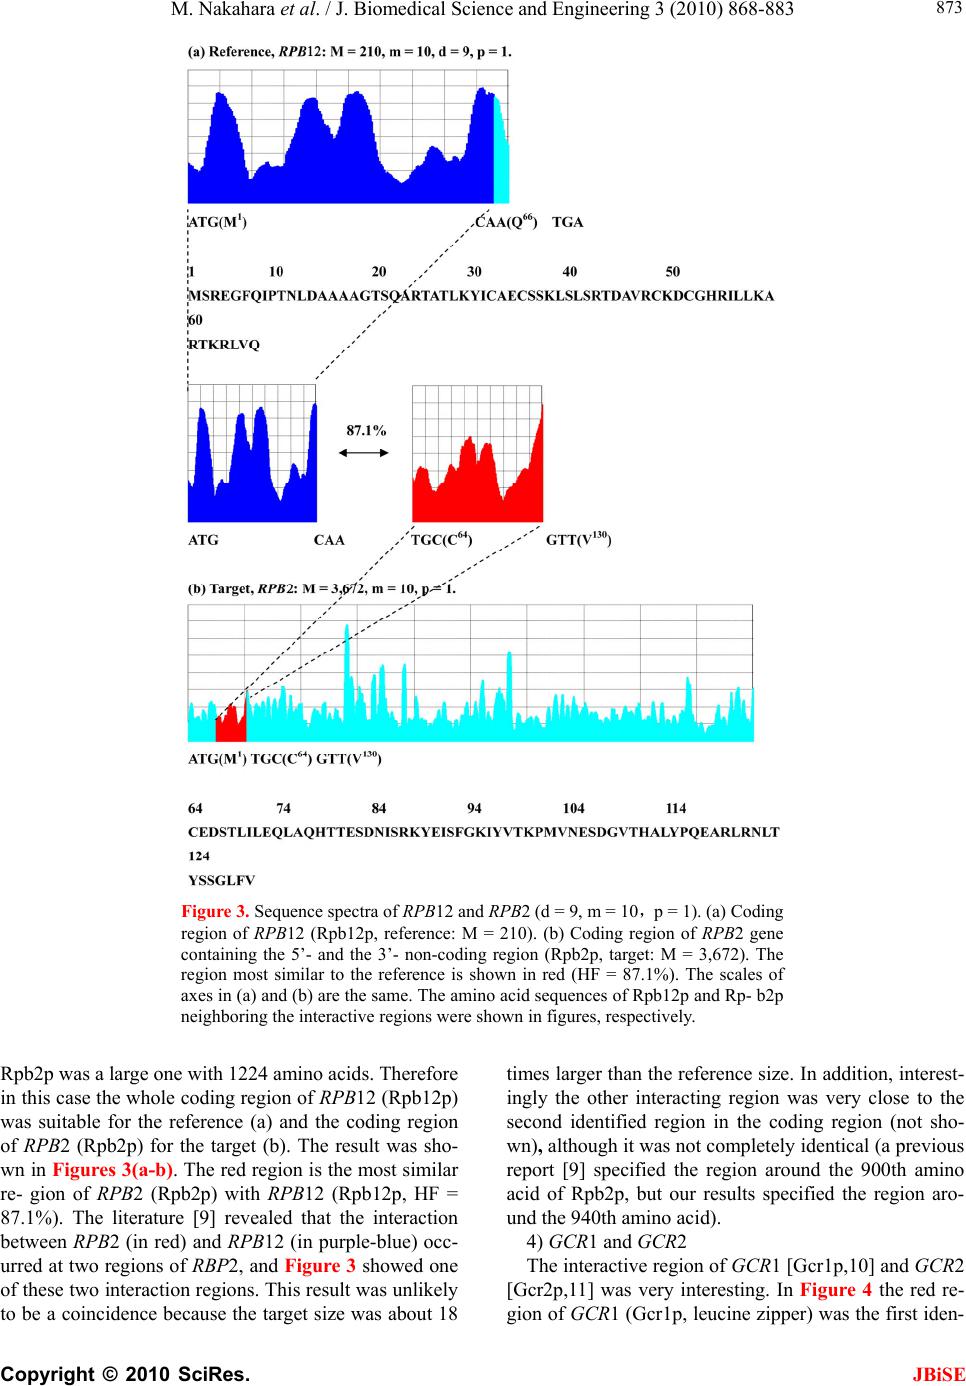 M. Nakahara et al. / J. Biomedical Science and Engineering 3 (2010) 868-883 Copyright © 2010 SciRes. JBiSE 873 Figure 3. Sequence spectra of RPB12 and RPB2 (d = 9, m = 10,p = 1). (a) Coding region of RPB12 (Rpb12p, reference: M = 210). (b) Coding region of RPB2 gene containing the 5’- and the 3’- non-coding region (Rpb2p, target: M = 3,672). The region most similar to the reference is shown in red (HF = 87.1%). The scales of axes in (a) and (b) are the same. The amino acid sequences of Rpb12p and Rp- b2p neighboring the interactive regions were shown in figures, respectively. Rpb2p was a large one with 1224 amino acids. Therefore in this case the whole coding region of RPB12 (Rpb12p) was suitable for the reference (a) and the coding region of RPB2 (Rpb2p) for the target (b). The result was sho- wn in Figures 3(a-b). The red region is the most similar re- gion of RPB2 (Rpb2p) with RPB12 (Rpb12p, HF = 87.1%). The literature [9] revealed that the interaction between RPB2 (in red) and RPB12 (in purple-blue) occ- urred at two regions of RBP2, and Figure 3 showed one of these two interaction regions. This result was unlikely to be a coincidence because the target size was about 18 times larger than the reference size. In addition, interest- ingly the other interacting region was very close to the second identified region in the coding region (not sho- wn), although it was not completely identical (a previous report [9] specified the region around the 900th amino acid of Rpb2p, but our results specified the region aro- und the 940th amino acid). 4) GCR1 and GCR2 The interactive region of GCR1 [Gcr1p,10] and GCR2 [Gcr2p,11] was very interesting. In Figure 4 the red re- gion of GCR1 (Gcr1p, leucine zipper) was the first iden- 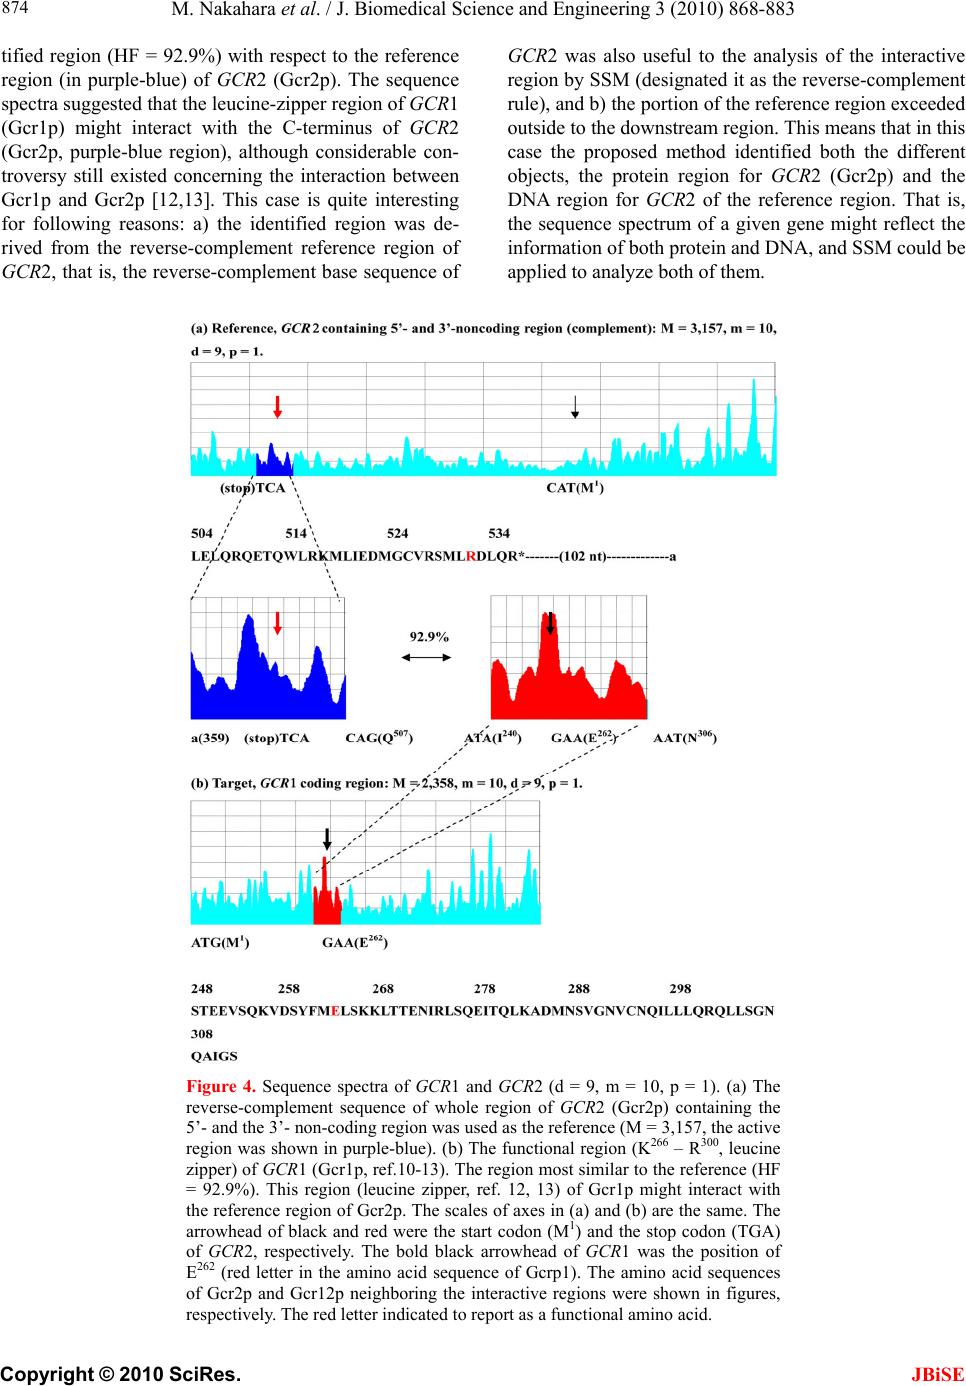 M. Nakahara et al. / J. Biomedical Science and Engineering 3 (2010) 868-883 Copyright © 2010 SciRes. JBiSE 874 tified region (HF = 92.9%) with respect to the reference region (in purple-blue) of GCR2 (Gcr2p). The sequence spectra suggested that the leucine-zipper region of GCR1 (Gcr1p) might interact with the C-terminus of GCR2 (Gcr2p, purple-blue region), although considerable con- troversy still existed concerning the interaction between Gcr1p and Gcr2p [12,13]. This case is quite interesting for following reasons: a) the identified region was de- rived from the reverse-complement reference region of GCR2, that is, the reverse-complement base sequence of GCR2 was also useful to the analysis of the interactive region by SSM (designated it as the reverse-complement rule), and b) the portion of the reference region exceeded outside to the downstream region. This means that in this case the proposed method identified both the different objects, the protein region for GCR2 (Gcr2p) and the DNA region for GCR2 of the reference region. That is, the sequence spectrum of a given gene might reflect the information of both protein and DNA, and SSM could be applied to analyze both of them. Figure 4. Sequence spectra of GCR1 and GCR2 (d = 9, m = 10, p = 1). (a) The reverse-complement sequence of whole region of GCR2 (Gcr2p) containing the 5’- and the 3’- non-coding region was used as the reference (M = 3,157, the active region was shown in purple-blue). (b) The functional region (K266 – R300, leucine zipper) of GCR1 (Gcr1p, ref.10-13). The region most similar to the reference (HF = 92.9%). This region (leucine zipper, ref. 12, 13) of Gcr1p might interact with the reference region of Gcr2p. The scales of axes in (a) and (b) are the same. The arrowhead of black and red were the start codon (M1) and the stop codon (TGA) of GCR2, respectively. The bold black arrowhead of GCR1 was the position of E262 (red letter in the amino acid sequence of Gcrp1). The amino acid sequences of Gcr2p and Gcr12p neighboring the interactive regions were shown in figures, respectively. The red letter indicated to report as a functional amino acid. 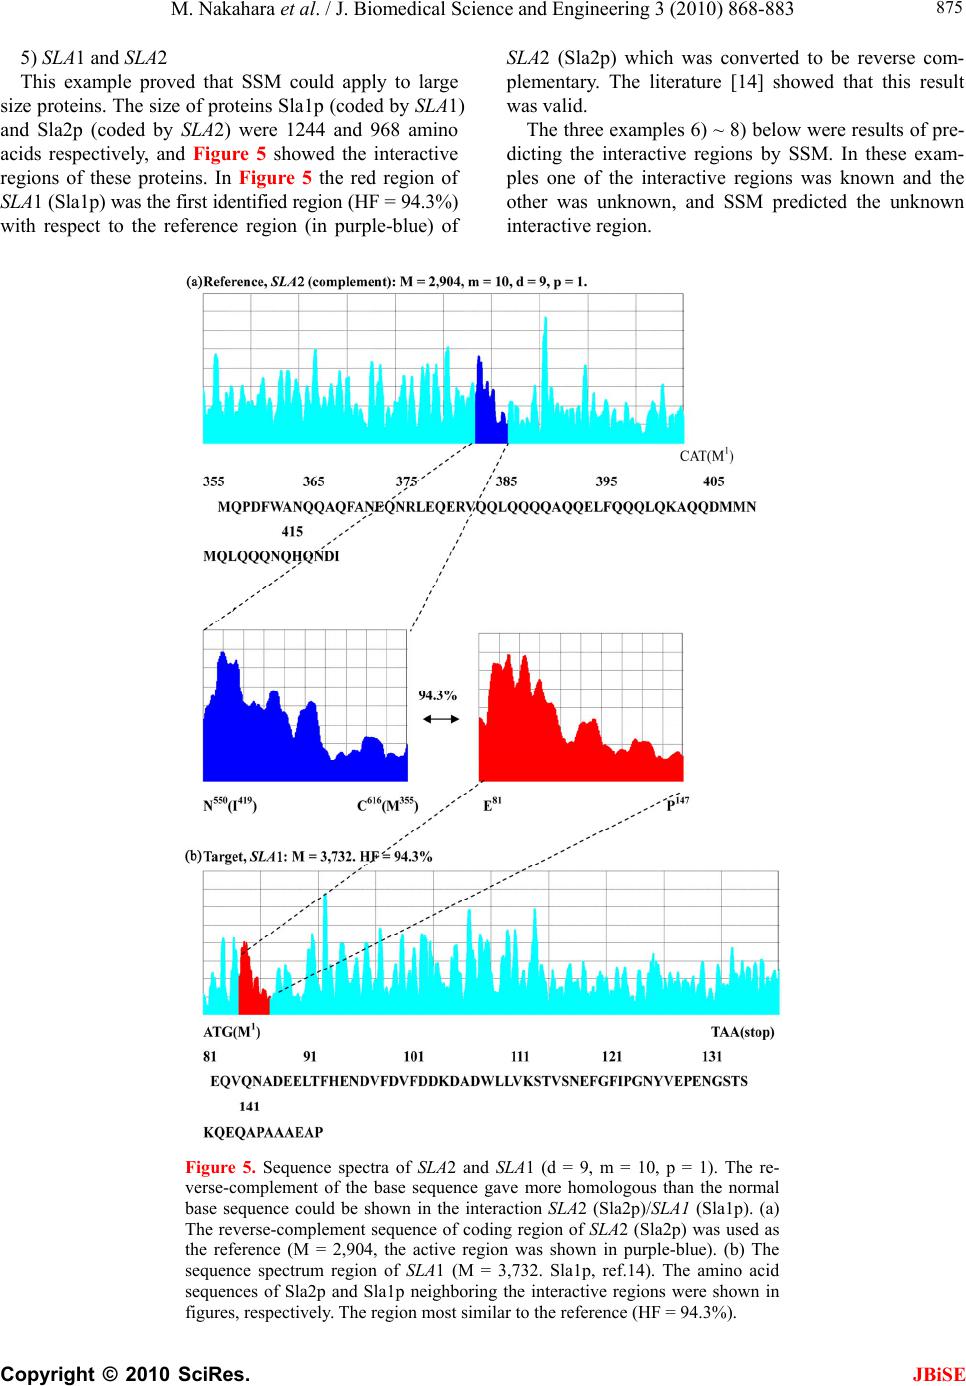 M. Nakahara et al. / J. Biomedical Science and Engineering 3 (2010) 868-883 Copyright © 2010 SciRes. JBiSE 875 5) SLA1 and SLA2 This example proved that SSM could apply to large size proteins. The size of proteins Sla1p (coded by SLA1) and Sla2p (coded by SLA2) were 1244 and 968 amino acids respectively, and Figure 5 showed the interactive regions of these proteins. In Figure 5 the red region of SLA1 (Sla1p) was the first identified region (HF = 94.3%) with respect to the reference region (in purple-blue) of SLA2 (Sla2p) which was converted to be reverse com- plementary. The literature [14] showed that this result was valid. The three examples 6) ~ 8) below were results of pre- dicting the interactive regions by SSM. In these exam- ples one of the interactive regions was known and the other was unknown, and SSM predicted the unknown interactive region. Figure 5. Sequence spectra of SLA2 and SLA1 (d = 9, m = 10, p = 1). The re- verse-complement of the base sequence gave more homologous than the normal base sequence could be shown in the interaction SLA2 (Sla2p)/SLA1 (Sla1p). (a) The reverse-complement sequence of coding region of SLA2 (Sla2p) was used as the reference (M = 2,904, the active region was shown in purple-blue). (b) The sequence spectrum region of SLA1 (M = 3,732. Sla1p, ref.14). The amino acid sequences of Sla2p and Sla1p neighboring the interactive regions were shown in figures, respectively. The region most similar to the reference (HF = 94.3%). 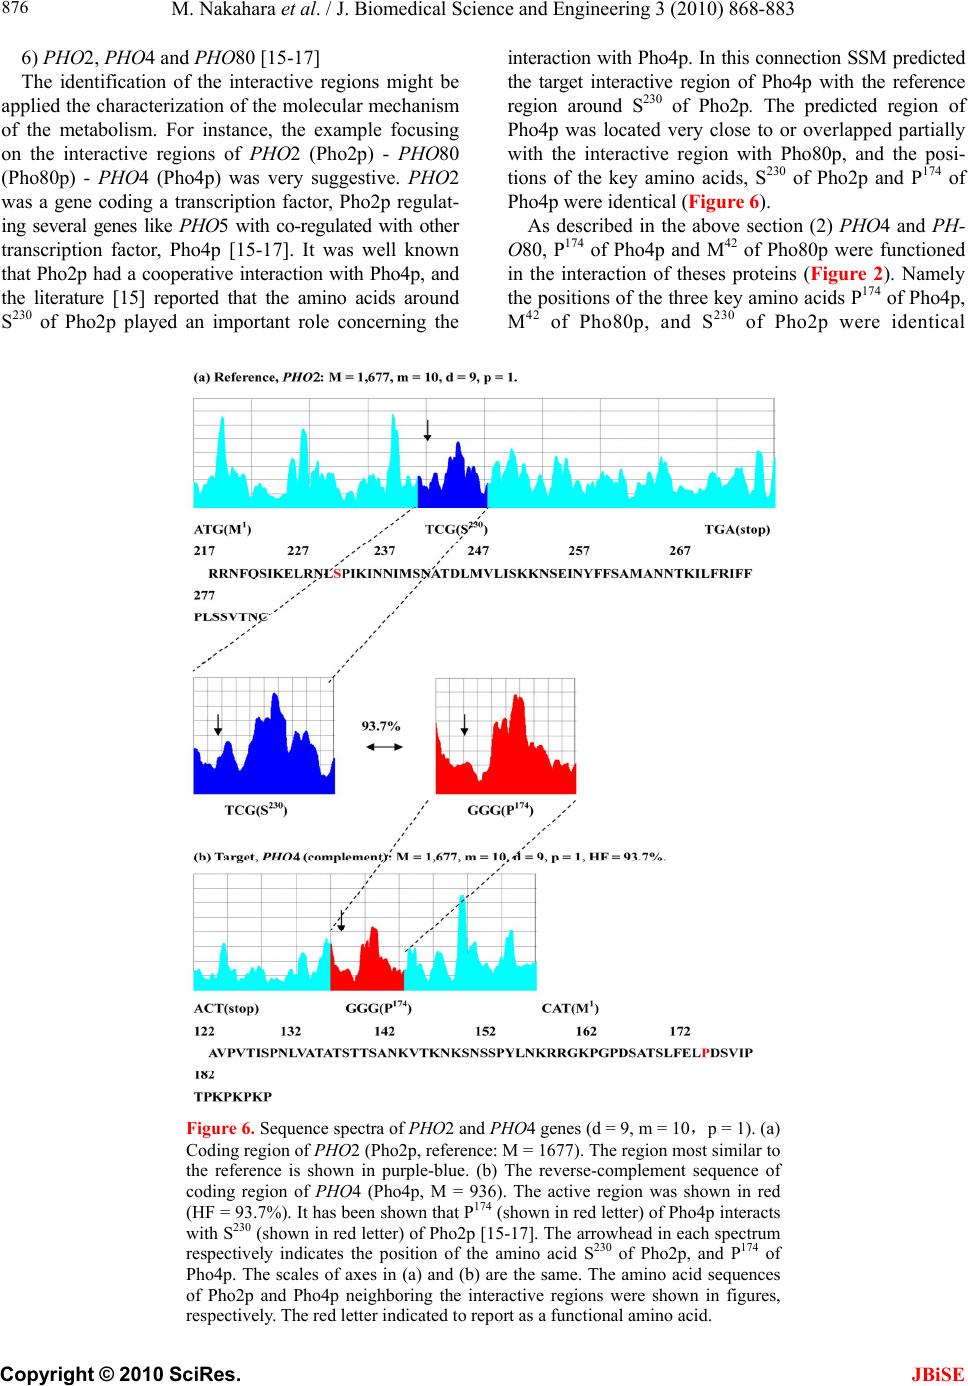 M. Nakahara et al. / J. Biomedical Science and Engineering 3 (2010) 868-883 Copyright © 2010 SciRes. JBiSE 876 6) PHO2, PHO4 and PHO80 [15-17] The identification of the interactive regions might be applied the characterization of the molecular mechanism of the metabolism. For instance, the example focusing on the interactive regions of PHO2 (Pho2p) - PHO80 (Pho80p) - PHO4 (Pho4p) was very suggestive. PHO2 was a gene coding a transcription factor, Pho2p regulat- ing several genes like PHO5 with co-regulated with other transcription factor, Pho4p [15-17]. It was well known that Pho2p had a cooperative interaction with Pho4p, and the literature [15] reported that the amino acids around S230 of Pho2p played an important role concerning the interaction with Pho4p. In this connection SSM predicted the target interactive region of Pho4p with the reference region around S230 of Pho2p. The predicted region of Pho4p was located very close to or overlapped partially with the interactive region with Pho80p, and the posi- tions of the key amino acids, S230 of Pho2p and P174 of Pho4p were identical (Figure 6). As described in the above section (2) PHO4 and PH- O80, P174 of Pho4p and M42 of Pho80p were functioned in the interaction of theses proteins (Figure 2). Namely the positions of the three key amino acids P174 of Pho4p, M42 of Pho80p, and S230 of Pho2p were identical Figure 6. Sequence spectra of PHO2 and PHO4 genes (d = 9, m = 10,p = 1). (a) Coding region of PHO2 (Pho2p, reference: M = 1677). The region most similar to the reference is shown in purple-blue. (b) The reverse-complement sequence of coding region of PHO4 (Pho4p, M = 936). The active region was shown in red (HF = 93.7%). It has been shown that P174 (shown in red letter) of Pho4p interacts with S230 (shown in red letter) of Pho2p [15-17]. The arrowhead in each spectrum respectively indicates the position of the amino acid S230 of Pho2p, and P174 of Pho4p. The scales of axes in (a) and (b) are the same. The amino acid sequences of Pho2p and Pho4p neighboring the interactive regions were shown in figures, respectively. The red letter indicated to report as a functional amino acid. 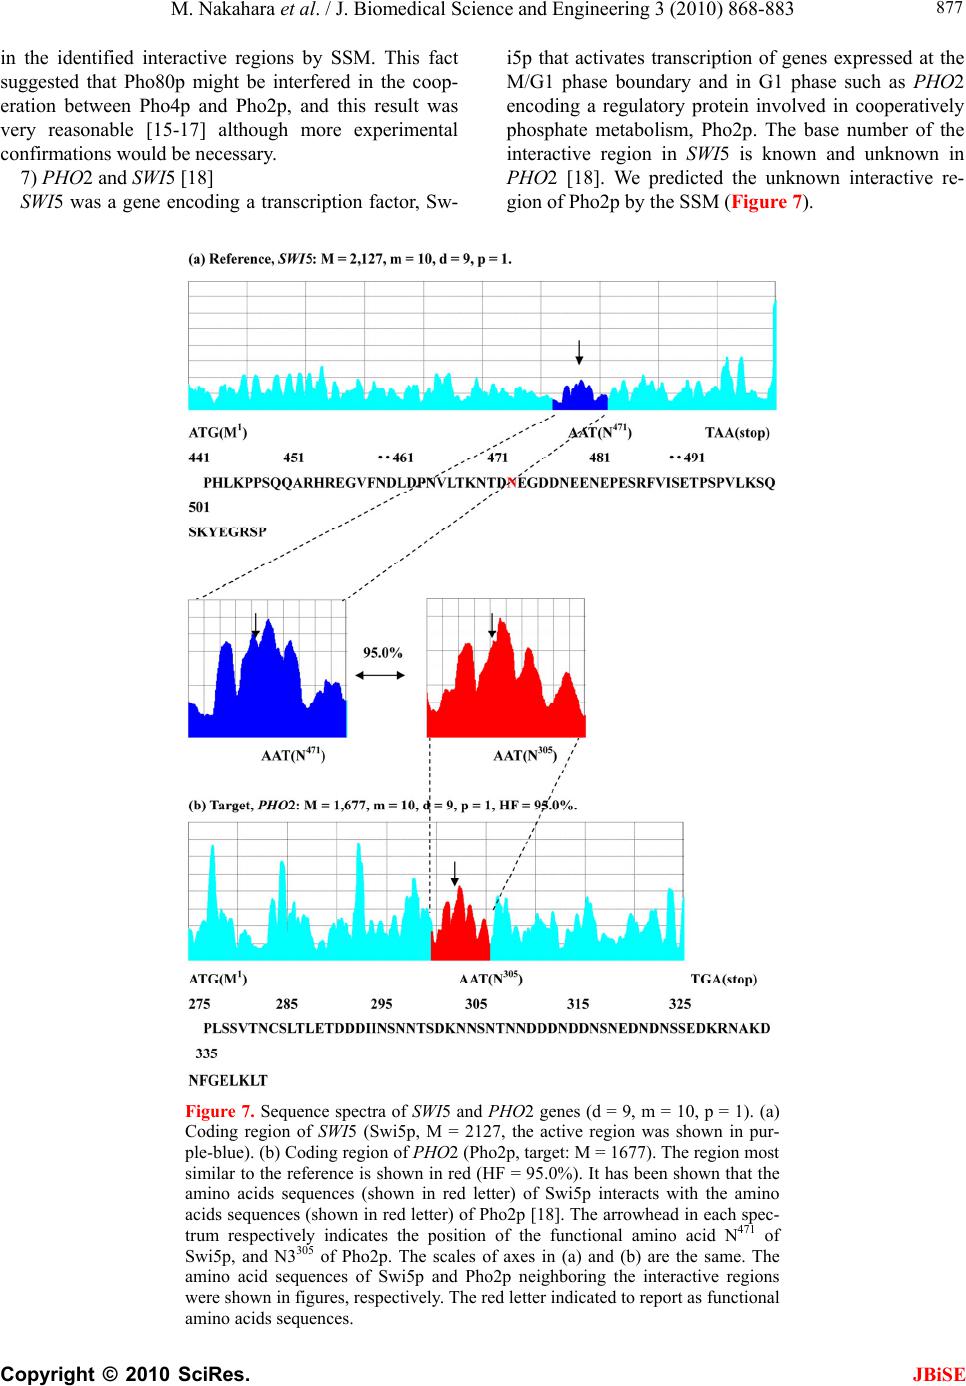 M. Nakahara et al. / J. Biomedical Science and Engineering 3 (2010) 868-883 Copyright © 2010 SciRes. JBiSE 877 in the identified interactive regions by SSM. This fact suggested that Pho80p might be interfered in the coop- eration between Pho4p and Pho2p, and this result was very reasonable [15-17] although more experimental confirmations would be necessary. 7) PHO2 and SWI5 [18] SWI5 was a gene encoding a transcription factor, Sw- i5p that activates transcription of genes expressed at the M/G1 phase boundary and in G1 phase such as PHO2 encoding a regulatory protein involved in cooperatively phosphate metabolism, Pho2p. The base number of the interactive region in SWI5 is known and unknown in PHO2 [18]. We predicted the unknown interactive re- gion of Pho2p by the SSM (Figure 7). Figure 7. Sequence spectra of SWI5 and PHO2 genes (d = 9, m = 10, p = 1). (a) Coding region of SWI5 (Swi5p, M = 2127, the active region was shown in pur- ple-blue). (b) Coding region of PHO2 (Pho2p, target: M = 1677). The region most similar to the reference is shown in red (HF = 95.0%). It has been shown that the amino acids sequences (shown in red letter) of Swi5p interacts with the amino acids sequences (shown in red letter) of Pho2p [18]. The arrowhead in each spec- trum respectively indicates the position of the functional amino acid N471 of Swi5p, and N3305 of Pho2p. The scales of axes in (a) and (b) are the same. The amino acid sequences of Swi5p and Pho2p neighboring the interactive regions were shown in figures, respectively. The red letter indicated to report as functional amino acids sequences.  M. Nakahara et al. / J. Biomedical Science and Engineering 3 (2010) 868-883 Copyright © 2010 SciRes. JBiSE 878 8) AT P 3 and AT P15 [19-21] AT P 3 and AT P15 were genes encoding F1F0-ATPase complex γ and ε subunits respectively, which partici- pated in a rotation of the complex [19-21]. In this exam- ple the interactive regions both of AT P 3 and AT P 15 were unknown. However we could choose the entire coding region of ATP15 as the reference because the genome size of ATP15 was small (186 nt). Therefore, we used as w = 186 by SSM in this case. Other values, m, d, and p were the same, 10, 9, and 1, respectively as before. In addition, the reverse-complement base sequence of AT P 15 was used because HF was higher in this analysis. We predicted the unknown interactive region of ATP 3 by the SSM (Figure 8). In x-ray crystallography of γ - ε complex of ATP syn- thase in E. coli and bovine, presumably, the 200th amino acid and the adjacent amino acids of γ - subunit (Atp3p) locating the foot-position could be interacted with ε - subunit (Atp15p) [19,20]. The prediction by SSM might be in accord with the results of these literatures for X-ray crystallography. The experiment to confirm the interac- tive regions of Atp15p and Atp3p analyzed by SSM is under the progress. SSM was the analytical method to identify the base numbers (position from 5’-ATG = the start codon) of the interactive regions (sites) of the reference- and the target- protein. However there were not many examples where the interactive regions with the base numbers were identi- fied for the reference and target proteins in the yeast genome databases such as SGD etc. Therefore we could not select many examples for the SSM analyses and showed all examples we have in this manuscript. Figure 8. Sequence spectra of ATP15 and ATP3 genes (d = 9, m = 10,p = 1). The reverse-complement of the base sequence gave more homologous than the normal base sequence could be shown in the interaction ATP15 (Atp15p)/AT P3 (Atp3p). (a) Coding region of ATP15 (Atp15p, M = 186, the active region was shown in purple-blue). (b) Coding region of ATP3 (Atp3p, target: M = 933). The region most similar to the reference is shown in red (HF = 88.6%). It has been shown that the amino acids sequences (shown in red letter) of Atp15p interacts with the amino acids sequences (shown in red re- gion) of Atp3p [19-21]. The scales of axes in (a) and (b) are the same. The amino acid sequences of Atp15p and Atp3p neighboring the interactive re- gions were shown in figures, respectively. The arrowhead and the red letter amino acid residue, N200 of Atp3p might be interacted with Atp15 from X-ray crystallography [19,20].  M. Nakahara et al. / J. Biomedical Science and Engineering 3 (2010) 868-883 Copyright © 2010 SciRes. JBiSE 879 The results in this paper could be sufficient to confirm the validity of SSM method because the probability to iden- tify the interactive regions was very small by coincidence. For instance, in the case of MAS1 (Mas1p)/MAS2 (Mas2p), MAS2 was composed of about 1,400 nt, which meant that the identification probability by coincidence was lower than 1/7 (= 200 / 1400) under the condition of the homology window width w = 200 nt. The probabili- ties of other examples in this manuscript were following. PHO4/PHO80, lower than 2/9 (= 200/900); RPB12/RPB2, 1/20 (= 200/4000); GCR2/GCR1, 1/15 (= 200/3000); SLA2/SLA1, 1/20 (= 200/4000); PHO2/PHO4, 1/15 (= 200/3000); PHO2/SWI5, 1/10 (= 200/2000); AT P 15/ATP3, 1/5 (= 200/1000); GAL1/GA4, 1/15 (= 200/3000); GAL4/GAL10, 2/7 (= 200/700); GAL4/GAL2, 1/7 (= 200/1000); GAL4/GAL7, 1/4 (= 200/800); Therefore the results in this paper made sense statisti- cally to confirm the validity of the proposed method. In addition the positions of the key amino acids were iden- tical in the identified interactive regions in case of the examples of MAS and PHO proteins. This fact definitely reinforced the proposed method. Finally we predicted the interactive regions of many proteins which were chosen randomly from 16 different chromosomes of S. cerevisiae [22], and summarize the prediction results in Table 1 to demonstrate the effec- tiveness of SSM. For the examples in Tab le 1 we used the same analytical conditions, m = 10, d = 9, p = 1 and w = 200, and predicted the interactive regions both of the reference and target proteins. However the proposed method in this paper was based on the condition that the interactive region of the reference protein was known and that of the target protein was unknown. Therefore some of these prediction results might be revised in our future work because the identification ability of SSM was not strong at present when the interactive regions both of the reference and target proteins were unknown. We are improving SSM to apply these cases now. Table 1. Possible interactive region. The upper column indicated the 1st, and the lower column indicated the 2nd interactive region, respectively. *1) Conditions, m = 10, d = 9, p = 1, w = 200; *2) Reference gene; *3) Chromosome located the reference gene; *4) Amino acid residues of the reference protein; *5) Interactive region of the reference protein predicted by SSM; *6) Target gene; *7) Chromosome located the target gene; *8) Amino acid residues of the target protein; *9) Interactive region of the target protein; *10) Homology factor between the target to the reference protein; *11) Either protein was used as the reverse-complement base sequence. Reference*2 Chromosome*3 Amino acids*4 Interactive reagion*5 Target*6Chromosome*7Amino Acids*8Interactive region*9 HF (%)*10 Complement*11 GDH3 1 457 272-338 GDH115 454 116-182 93.7 52-118 52-118 92.3 CDC24 1 854 183-249 ACT16 478 83-149 94.7 234-300 94-160 94.2 ○ PHO11 1 467 374-440 PHO52 467 374-440 94.3 88-154 144-210 93 ○ ATP2 10 511 170-236 ATP32 311 57-123 93.1 ○ 300-366 20-86 92.6 SUP45 2 437 311-377 RPS1215 143 4-70 92.1 188-254 (-7)-59 91.3 YDJ1 14 409 292-358 PRD13 712 508-574 94 67-133 552-618 93.6 ○ GCD2 7 651 550-616 GCD712 381 274-341 94.9 ○ 221-287 (-21)-45 91.4 PHO87 3 923 433-499 SPL2 8 148 24-90 92.1 564-630 60-126 92 ○ HXT15 4 567 323-389 GAL212 574 52-118 96.9 ○ 483-549 399-465 96.8 ○ NAB2 7 525 69-135 SNF34 884 480-544 95.4 243-309 175-241 95.2 ○ ECM10 5 644 140-206 SSA11 642 237-303 94 70-136 395-461 93.4 ○ HEM1 4 548 16-82 LCB24 561 296-362 95 ○ 269-335 447-513 94.1 ○ POL4 3 582 169-235 CCA15 546 218-284 97 ○ 67-133 103-169 93.9 GUT1 8 709 99-165 XKS17 600 24-90 94.5 649-(715) (-12)-54 93.7 YAP1 13 650 335-401 CAD14 409 96-162 93.9 531-597 217-283 93.3  M. Nakahara et al. / J. Biomedical Science and Engineering 3 (2010) 868-883 Copyright © 2010 SciRes. JBiSE 880 3.2. Mutual Interaction of Protein-DNA This section clarified that the homology of sequence sp- ectra was also related to the mutual interaction between protein and DNA. The interactions of the transcription factor GAL4 [23] and the promoters of GAL genes (UA- SGal signal, GAL1, GAL10, GAL2 and GAL7) [24-26] were taken as an example. Figure 9 showed the seque- nce spectra of the upstream region of GAL1 as the refer- ence (a) and the reverse-complement base sequence of the coding region of GAL4 as the target (b). We em- ployed the upstream region of GAL1 to demonstrate the effectiveness of the method although its base size was 668 wh- ich was a little large for the reference region. In Figure 9 the red region was the first identified region of GAL4. Surprisingly this red region is completely identi- cal to the DNA binding region of GAL4 with the zinc finger motif, and the purple-blue region is the promoter region of GA- L1. This means that in this case the pro- posed method perfectly identified both the interactive reference (in purple-blue) and target regions (in red) at the same time despite the different objects, the protein region for GAL4 and the DNA region for GAL1. Thus interactive analysis might be applied to other GAL genes, GAL10, GAL2, and GAL7, which their promoter regions were also interacted with the N-terminal DNA binding domain (zinc-finger domain) of GAL4 (Gal4p). Figure 10 showed all the promoter regions identified by SSM with the DNA binding region of the Gal4p (the reverse-complement base sequence) in Figure 9 as the reference region (in purple-blue). In this figure the ref- erence region of GAL4 was fixed to arrange the layout of Figure 9. Sequence spectra of GAL1 and GAL4 genes (d = 9, m = 10,p = 1). (a) Upstream region of GAL1 (668 nt) was used as the reference (in pur- ple-blue). The arrowheads were indicated several promoter sequences. (b) DNA binding region of GAL4 (reverse-complement sequence of GAL4 (Gal4p, M = 2,643) was useful in comparison with GAL1 gene. The first 107 amino acids at the N-terminus of Gal4p, which is involved in DNA binding (shown in red, ref. 23), were used as the target. The bold arrowhead of Gal4p was indi- cated the position of L64. 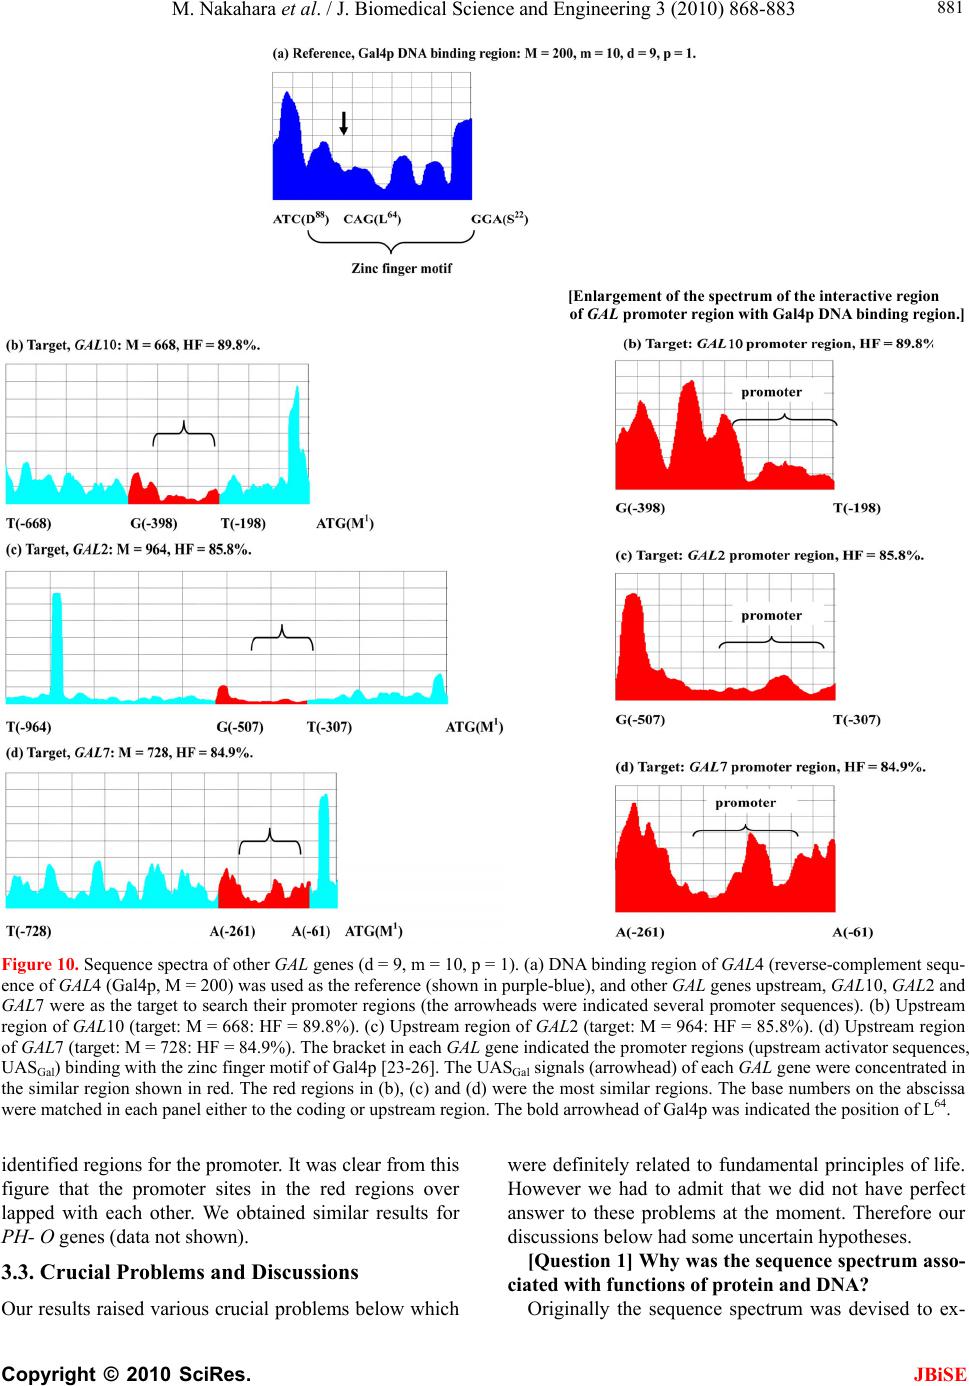 M. Nakahara et al. / J. Biomedical Science and Engineering 3 (2010) 868-883 Copyright © 2010 SciRes. JBiSE 881 [Enlargement of the spectrum of the interactive region of GAL promoter region with Gal4p DNA binding region.] Figure 10. Sequence spectra of other GAL genes (d = 9, m = 10, p = 1). (a) DNA binding region of GAL4 (reverse-complement sequ- ence of GAL4 (Gal4p, M = 200) was used as the reference (shown in purple-blue), and other GAL genes upstream, GAL10, GAL2 and GAL7 were as the target to search their promoter regions (the arrowheads were indicated several promoter sequences). (b) Upstream region of GAL10 (target: M = 668: HF = 89.8%). (c) Upstream region of GAL2 (target: M = 964: HF = 85.8%). (d) Upstream region of GAL7 (target: M = 728: HF = 84.9%). The bracket in each GAL gene indicated the promoter regions (upstream activator sequences, UASGal) binding with the zinc finger motif of Gal4p [23-26]. The UASGal signals (arrowhead) of each GAL gene were concentrated in the similar region shown in red. The red regions in (b), (c) and (d) were the most similar regions. The base numbers on the abscissa were matched in each panel either to the coding or upstream region. The bold arrowhead of Gal4p was indicated the position of L64. identified regions for the promoter. It was clear from this figure that the promoter sites in the red regions over lapped with each other. We obtained similar results for PH- O genes (data not shown). 3.3. Crucial Problems and Discussions Our results raised various crucial problems below which were definitely related to fundamental principles of life. However we had to admit that we did not have perfect answer to these problems at the moment. Therefore our discussions below had some uncertain hypotheses. [Question 1] Why was the sequence spectrum asso- ciated with functions of protein and DNA? Originally the sequence spectrum was devised to ex-  M. Nakahara et al. / J. Biomedical Science and Engineering 3 (2010) 868-883 Copyright © 2010 SciRes. JBiSE 882 amine the generation-rules in genome, and succeeded in visualizing the rules of reverse-complement symmetry, multiple fractality and so on. Therefore the fact that the sequence spectrum was associated with the functions of protein and DNA led to the fact that the generation-rules could govern not only the static base sequence in ge- nome as the blueprint of life but also the dynamic phe- nomena of proteins and DNAs as the principle of life mechanism. [Question 2] Why was the homology of sequence sp- ectrum closely associated with the interaction of pro- teins? A possible answer to this problem was that the se- quence spectrum could reflect the higher order structure of proteins. The interacting region was considered to consist of the specific sequence of amino acids. This specificity of the amino acid sequence could be reflected to the appearance frequency of the base sequence corre- sponding to the amino acid sequence. The homology of the sequence spectrum could be interpreted to be an af- finity of the interactive regions of the proteins. [Question 3] Why was the homology of sequence spectrum closely associated with the interaction of protein and DNA? Similarly to the problem [Question 2], a possible answer to this problem was that the sequence spectrum could reflect the higher order structure of protein and DNA. However, this fact would raise another crucial problem. Why could the sequence spectrum reflect the higher or- der of both protein and DNA in the same manner which was totally different objects? In order to answer this problem, it was definitely necessary to examine the rela- tion between the higher order structures of protein and DNA (or RNA). Our results implied that there could exist a close structural relation between them. For in- stance, it was well known that a domain of EF-G factor protein emulated amino acyl-tRNA [26]. It could be even possible that the structure of protein could inherit the structure of its original DNA in genome because in- heritance could be most simple answer for this problem. SSM basically could detect the interacting regions of gene DNAs through the homology of the sequence spec- trum, and this automatically could lead to detect the in- teracting regions of proteins translated from the gene DNAs through the structure inheritance. We suspected that tRNA and codon table gave an important clue on this issue because tRNA were directly associated with the amino acid of protein and the triplet codon of DNA. Moreover the sequence spectrums of tRNA and protein possess the similar relation. For instance the GTP bind- ing protein RAS2 [27,28] and Gly(GGG)-tRNA which were both related to guanine(G) in common were similar in the sequence spectrum [2]. 4. CONCLUSIONS The conclusions obtained in this study were summarized as follows. 1) The homology of the sequence spectrum was clo- sely associated with the interaction of protein and DNA. 2) The SSM was a suitable prediction method to iden- tify interacting regions regardless of the biological mac- romolecules: DNA, RNA and protein. 3) The SSM was so fast and useful that it did not re- quire a super computer but rather a personal computer. 4) The generation-rules in genome could govern not only the static base sequence in genome but also the dy- namic phenomena of proteins and DNAs. 5) The sequence spectrum could reflect the higher or- der structure of protein and DNA. 6) There could be a close relation between the struc- tures of protein and DNA. The proposed method by SSM should be improved to identify or predict both the reference and target regions at the same time in any cases. This project is now ongo- ing in our laboratory and we will report on this subject in the next paper. REFERENCES [1] Takeda, M. and Nakahara, M. (2009) Structural features of the nucleotide sequences of genomes. Journal of Com- puter Aided Chemistry, 10, 38-52. [2] Nakahara, M. and Takeda, M. (2010) Characterization of the sequence spectrum of DNA based on the appearance frequency of the nucleotide sequences of the genome-A new method for analysis of genome structure. Journal Biomedical Science and Engineering, 3, 340-350. [3] Geli, V., Yang, M., Suda, K., Lustig, A. and Schatz, G. (1990) The MAS-encoded processing protease of yeast mitochondria. Overproduction and characterization of its two nonidentical subunits. Journal of Biological Chem- istry, 265(31), 19216-19222. [4] West, A.H., Clark, D.J., Martin, J., Neupert, W., Hartl, F.U. and Horwich, A.L. (1992) Two related genes enco- ding extremely hydrophobic proteins suppress a lethal mutation in the yeast mitochondrial processing enhanc- ing protein. Journal of Biological Chemistry, 267(34), 24625-24633. [5] Ito, A. (1999) Mitochondrial processing peptidase: mul- tiple-site recognition of precursor proteins. Biochemical and Biophysical Research Communication, 265(3), 611- 616. [6] Nagao, Y., Kitada, S., Kojima, K., Toh, H., Kuhara, S., Ogishima, T. and Ito, A. (2000) Glycine-rich region of mitochondrial processing peptidase α-subunit is essential for binding and cleavage of the precursor proteins. Jour- nal of Biological Chemistry, 275, 34552-34556. [7] Ogawa, N. and Oshima, Y. (1990) Functional domains of a positive regulatory protein, PHO4, for transcriptional control of the phosphatase region in Saccharomyces cer-  M. Nakahara et al. / J. Biomedical Science and Engineering 3 (2010) 868-883 Copyright © 2010 SciRes. 883 JBiSE evisiae. Molecular and Cellular Biology, 10(5), 2224- 2236. [8] Okada, H. and Toh-e, A. (1992) A novel mutation occur- ring in the PHO80 gene suppresses the PHO4c mutations of Saccharomyces cerevisiae. Current Genetics, 21(2), 95- 99. [9] Cramer, P., Bushnell, D.A. and Kornberg, R.D. (2001) Structural basis of transcription: RNA polymerase II at 2.8 Angstrom resolution. Science 292(5523), 1863-1876. [10] Baker, H.V. (1991) GCR1 of Saccharomyces cerevisiae encodes a DNA binding protein whose binding is abol- ished by mutations in the CTTCC sequence motif. Proce- eding National Academy of Sciences of the United States of America, 88(21), 9443-9447. [11] Uemura, H. and Jigami, Y. (1992) Role of GCR2 in tran- scriptional activation of yeast glycolytic genes. Molecu- lar and Cellular Biology, 12(9), 3834-3842. [12] Deminoff, S.J., Tornow, J. and Santangelo, G.M. (1995) Unigenic evolution: A novel genetic method localizes a putative leucine zipper that mediate dimerization of the Saccharomyces cerevisiae regulator Gcr1p. Genetics, 141(4), 1263-1274. [13] Deminoff, S.J. and Santangelo, G.M. (2001) Rap1p req- uires Gcr1p and Gcr2p homodimers to activate ribosomal protein and glycolytic genes, respectively. Genetics, 158(1), 133-143. [14] Gourlay, C.W., Dewar, H., Warren, D.T., Costa, R., Sat- ish, N. and Ayscough, K.R. (2003) An interaction be- tween Sla1p and Sla2p plays a role in regulating actin dyn- amics and endocytosis in budding yeast. Journal of Cell Science, 116(12), 2551-2564. [15] Liu, C., Yang, Z., Yang, J., Xia, Z., and Ao, S. (2000) Re- gulation of the yeast transcription factor PHO2 activity by phosphorylation. Journal of Biological Chemistry, 275(41), 31972-31978. [16] Yang, J. and Ao, S.Z. (1996) Interaction of the yeast PHO2 protein or its mutants with the PHO5 UAS in vitro. Sheng Wu Hua Xue Yu Sheng Wu Li Xue Bao (Shanhai) 28(3), 316-320. [17] Shimizu, T., Toumoto, A., Ihara, K., Shimizu, M., Kyo- goku, Y., Ogawa, N., Oshima, Y. and Hakoshima, T. (1997) Crystal structure of PHO4 bHLH domain-DNA complex: Flanking base recognition. EMBO Journal, 16(15), 4689-4697. [18] Bhoite, L.T. and Stillman, D.J. (1998) Residues in the Swi5 zinc finger protein that mediate cooperative DNA binding with the Pho2 homeodomain protein. Molecular and Cellular Biology, 18(11), 6436-6446. [19] Rodgers, A.J. and Wilse, M.C. (2000) Structure of the gamma-epsilon complex of ATP synthase. Nature Struc- tural Biology, 7(2000), 1051-1054. [20] Montgomery, G.C., Lesile, A.G. and Walker, J.E. (2000) The structure of the central stalk in bovine F(1)-ATPase at 2.4 A resolution. Nature Structural Biology, 7(11 ), 1055- 1061. [21] Tsumuraya, M., Furuike, S., Adachi, K., Kinoshita, K. jr. and Yoshida, M. (2009) Effect of ε subunit on the rota- tion of thermophilic Bacillus F1-ATPase. FEBS Letters, 583(7), 1121-1126. [22] Saccharomyce G.D (2010) (http://www.yeastgenome.org/). [23] Ding, W.V. and Johnston, S.A. (1997) The DNA binding and activation domains of Gal4p are sufficient for con- veying its regulatory signals. Molecular and Cellular Bi- ology, 17(5), 2538-2549. [24] Johnston, M. and Davis, R.W. (1984) Sequences that regulate the divergent GAL1-GAL10 promoter in Sac- charomyces cerevisiae. Molecular and Cellular Biology, 4(11), 1440-1448. [25] Lorch, Y. and Kornberg, R.D. (1985) A region flanking the GAL7 gene and binding site for GAL4 protein as up- stream activating sequences in yeast. Journal of Molecu- lar Biology, 186(4), 821-824. [26] Tajima, M., Nogi, Y. and Fukazawa, T. (1986) Duplicate upstream activating sequences in the promoter region of the Saccharomyces cerevisiae GAL7 gene. Molecular and Cellular Biology, 6(1), 246-256. [27] Nissen, P., Kjeldgaard, M., Thirup, S., Polekhina, G., Re- shetnikova, L., Clark, B.F. and Nyborg, J. (1995) Crystal structure of the ternary complex of Phe-tRNAPhe, EF-Tu, and a GTP analog. Science, 270(5241), 1464-1472. [28] Kataoka, T., Powers, S., McGill, C., Fasano, O., Strath- ern, J., Broach, J. and Wigler, M. (1984) Genetic analysis of yeast RAS1 and RAS2 genes. Cell, 37(2), 437- 445. [29] Mabuchi, T., Ichimura, Y., Takeda, M. and Douglas, M.G. (2000) ASC1/RAS2 suppresses the growth defect on glycerol caused by the atp1-2 mutation in the yeast Sac- charomyces cerevisiae. Journal of Biological Chemistry, 275(14), 10492-10497.
|