Paper Menu >>
Journal Menu >>
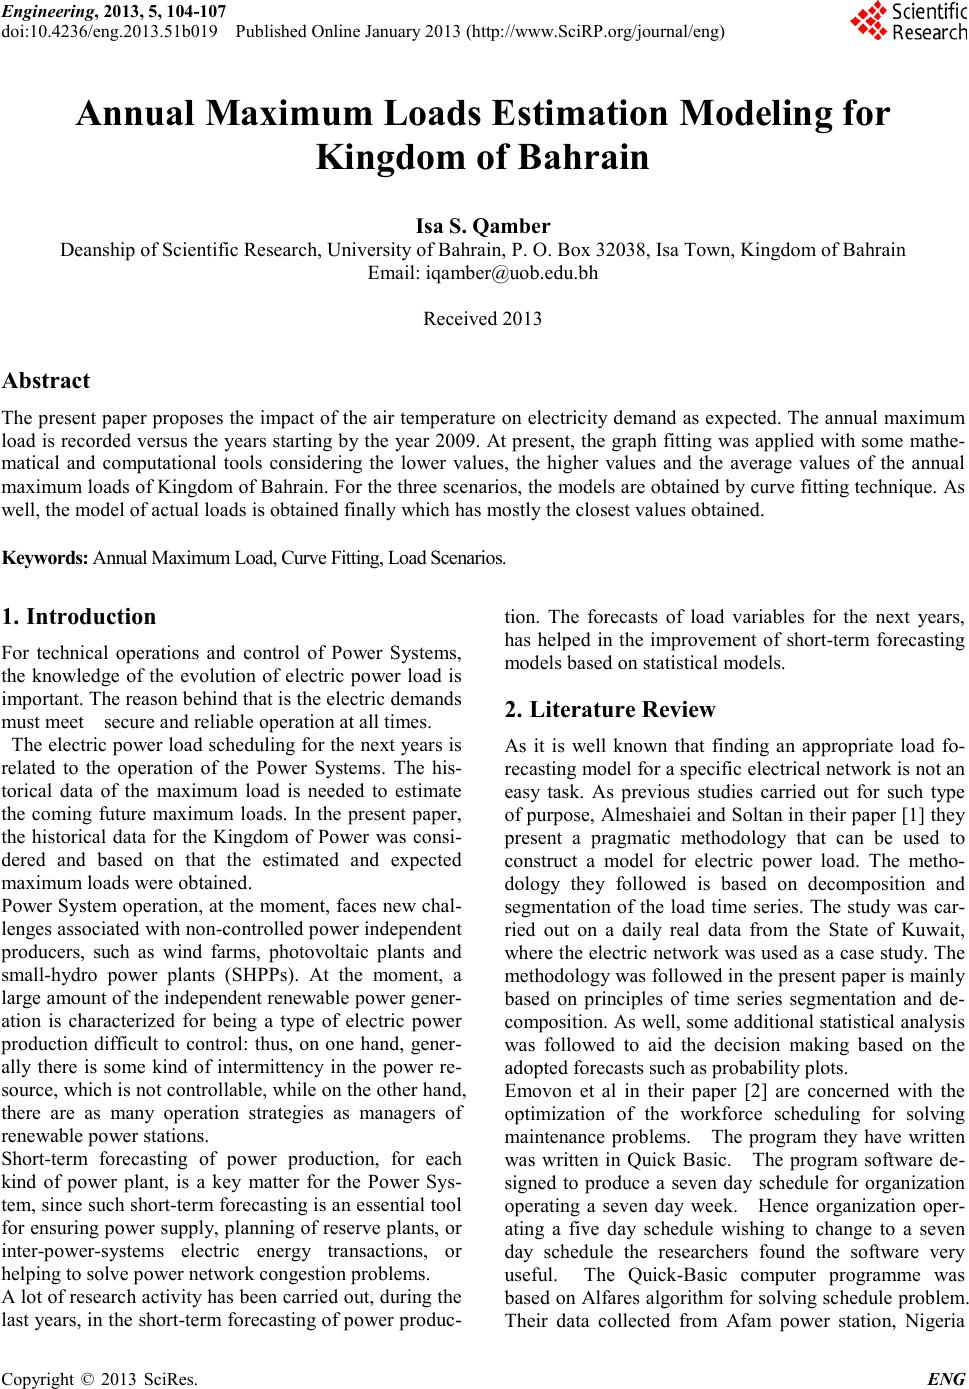 Engineering, 2013, 5, 104-107 doi:10.4236/eng.2013.51b019 Published Online January 2013 (http://www.SciRP.org/journal/eng) Copyright © 2013 SciRes. ENG Annual Maximum Loads Estimation Modeling for Kingdom of Bahrain Isa S. Qamber Deanship of Scientific Research, Univer s ity of Bahrain, P. O . Box 32038, Isa Town, Kingdom of Bahrain Email: iqamber@uob.edu.bh Received 2013 Abstract The present paper proposes the impact of the air temperature on electricity demand as expected. The annual maximum load is recorded versus the years starting by the year 2009 . At present, t he graph fittin g was ap plied with some mathe- matical and computational tools considering the lower values, the higher values and the average values of the annual maximum loads of Kingdom of Bahrain. For the three scenarios, the models are obtained by curve fitting technique. As well, the model of actual load s is obtained finally which has mostly the closest values obtained. Keywords: An nual Maximum Load, Cu rve Fittin g, Load S cenarios. 1. Introduction For technical operations and control of Power Systems, the knowledge of the evolution of electric power load is impo rt ant . The r e aso n b e hi nd t hat is t he electric de mands must meet secure and reliable operation at all times. The electric power load scheduling for the next years is related to the operation of the Power Systems. The his- torical data of the maximum load is needed to estimate the coming future maximum loads. In the present paper, the historical data for the Kingdom of Power was consi- dered and based on that the estimated and expected maximum loads were obtained. Power System operation, at the moment, faces new chal- lenges associated with non-controlled power independent producers, such as wind farms, photovoltaic plants and small-hydro power plants (SHPPs). At the moment, a large amount of the independent renewable po wer gener- ation is characterized for being a type of electric power production difficult to control: thus, on one hand, gener- ally there is some kind of intermittency in the power re- sourc e, which is no t c o ntr ol la bl e, while on t he o the r ha nd , there are as many operation strategies as managers of renewable power stations. Short-term forecasting of power production, for each kind of power plant, is a key matter for the Power Sys- tem, si nce such s hor t-ter m forecasting is an esse ntial tool for e nsuri ng po wer sup ply, p lanni ng of reser ve pla nts, or inter-power-systems electric energy transactions, or helping to solve power network congestion problems. A lot of research activity has been carried out, during the last year s, i n the sho rt -term forecasting of power produc- tion. The forecasts of load variables for the next years, has helped in the improvement of short-term forecasting models based on statistical models. 2. Literature Review As it is well known that finding an appropriate load fo- recasting model for a specific electrical network is not an easy task. As previous studies carried out for such type of purpose, Almeshaiei and Soltan in their paper [1] they present a pragmatic methodology that can be used to construct a model for electric power load. The metho- dology they followed is based on decomposition and segmentation of the load time series. T he study was car- ried out on a daily real data from the State of Kuwait, where the electric network was used as a case stud y. The methodology was followed in the present paper is mainly based on principles of time series segmentation and de- composition. As well, some additio nal statistical a nalysis was followed to aid the decision making based on the adopted forecasts such as probability plots. Emovon et al in their paper [2] are concerned with the optimization of the workforce scheduling for solving mai ntenance problems. The program they have written was written in Quick Basic. The program software de- signed to produce a seven day schedule for organization operating a seven day week. Hence organization oper- ating a five day schedule wishing to change to a seven day schedule the researchers found the software very useful. The Quick-Basic computer programme was based on Alfares algorithm for solving schedule problem. Their data collected from Afam power station, Nigeria 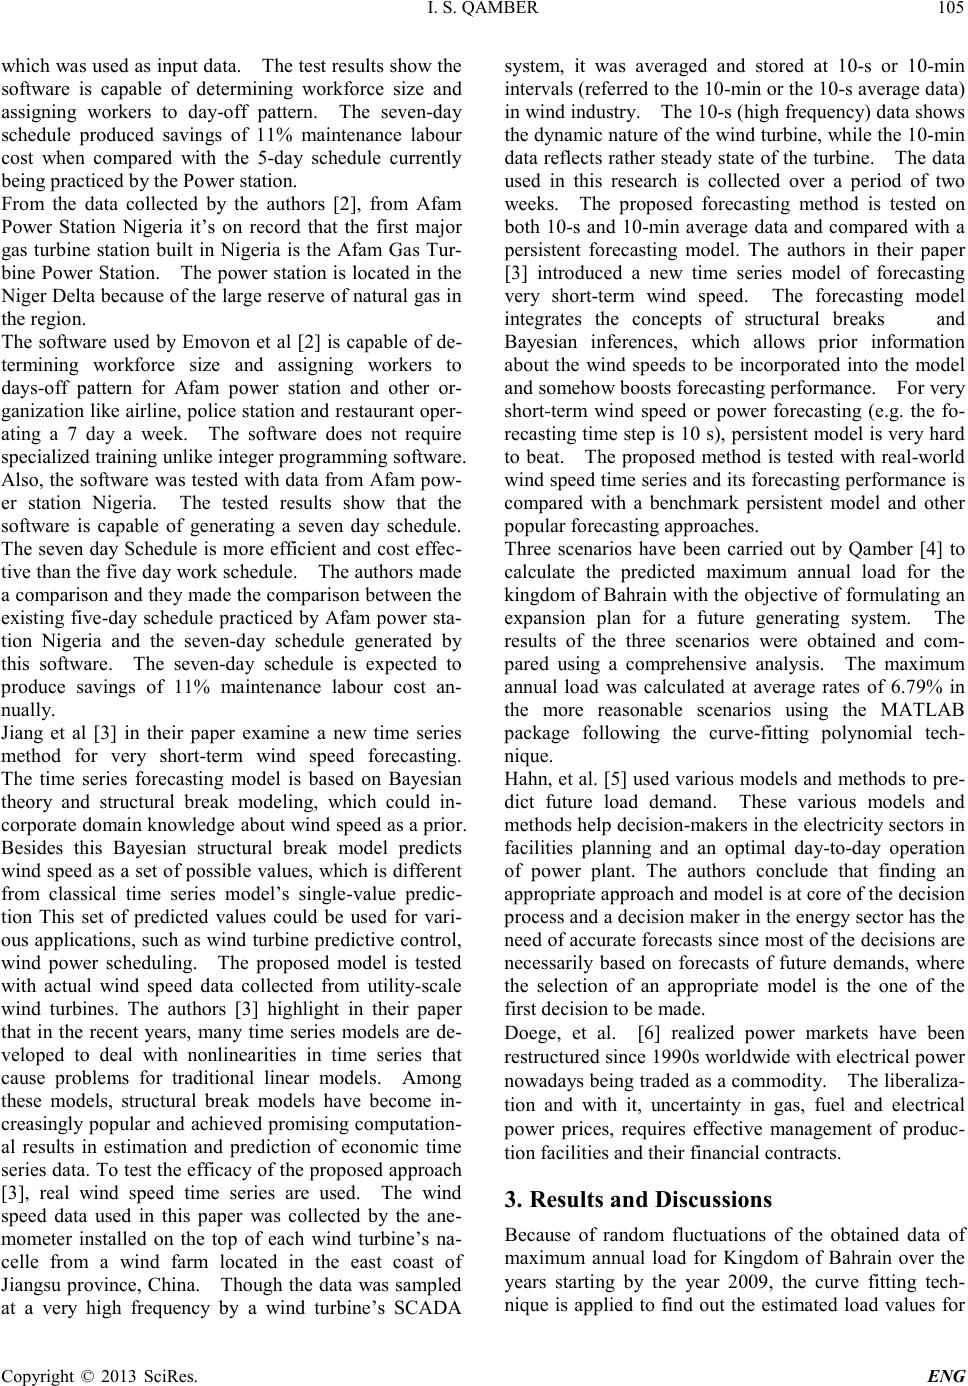 I. S. QAMBER Copyright © 2013 SciRes. ENG 105 which was used as input data. The test result s s how t he software is capable of determining workforce size and assigning workers to day-off pattern. The seven-day schedule produced savings of 11% maintenance labour cost when compared with the 5-day schedule currently being practiced by the Power station. From the data collected by the authors [2], from Afam Power Station Nigeria it’s on record that the first major gas turbine station built in Nigeria is the Afam Ga s Tur- bine Po wer Statio n. T he power station is located in the Niger Delta because of the large reserve of natural gas in the region. The software used by Emovon et al [2] is capable of de- termining workforce size and assigning workers to days-off pattern for Afam power station and other or- ganization like airli ne, police station and resta urant o per- ating a 7 day a week. The software does not require spec ia liz ed t ra ini ng u nli ke i nt e ger p ro gr a mmin g so ftware. Also, the so ftware was tes ted with data from Afa m pow- er station Nigeria. The tested results show that the software is capable of generating a seven day schedule. The seven day Schedule is more efficient and cost effec- tive t ha n the f ive d a y wor k sc he d ule . The aut ho r s made a comparison and they made the comparison between the existing fi ve-day schedule practiced by Afam power sta- tion Nigeria and the seven-day schedule generated by this software. The seven-day schedule is expected to produce savings of 11% maintenance labour cost an- nually. Jiang et al [3] in their paper examine a new time series method for very short-term wind speed forecasting. The time series forecasting model is based on Bayesian theory and structural break modeling, which could in- corporate domain knowledge about wind speed as a prior. Besides this Bayesian structural break model predicts wind speed as a set of possible values, which is different from classical time series model’s single-value predic- tion This set of predicted values could be used for vari- ous applicatio ns, such as wind turb ine predictive control, wind power scheduling. The proposed model is tested with actual wind speed data collected from utility-scale wind turbines. The authors [3] highlight in their paper that in the recent years, many time series models are de- veloped to deal with nonlinearities in time series that cause problems for traditional linear models. Among these models, structural break models have become in- creasingly popular and achieved promising computation- al results in estimation and prediction of economic time series data. To test the efficacy of the proposed approach [3], real wind speed time series are used. The wind speed data used in this paper was collected by the ane- mometer installed on the top of each wind turbine’s na- celle from a wind farm located in the east coast of Jiangs u provinc e, China. Thoug h the data was sa mpled at a very high frequency by a wind turbine’s SCADA system, it was averaged and stored at 10-s or 10-min intervals (referr ed to the 10-min o r the 1 0 -s average data) in wi nd ind us tr y. The 10 -s ( hi g h fr eq uenc y) d at a s hows the d ynamic nat ur e o f the win d tur b ine , while the 10-min data reflects rather steady state of the turbine. The data used in this research is collected over a period of two weeks. The proposed forecasting method is tested on both 10-s and 10-min average data and compared with a persistent forecasting model. The authors in their paper [3] introduced a new time series model of forecasting very short-term wind speed. The forecasting model integrates the concepts of structural breaks and Bayesian inferences, which allows prior information about the wind speeds to be incorporated into the model and somehow boosts forecasting performance. For very short-term wind speed or power forecasting (e.g. the fo- recasting ti me step is 10 s), persistent model is ver y hard to beat. The proposed method is tested with real-world wind speed time series and its forecasting performance is compared with a benchmark persistent model and other popular forecasting approaches. Three scenarios have been carried out by Qamber [4] to calculate the predicted maximum annual load for the kingd om of B ahrai n wi th the obje ctive o f for mulatin g an expansion plan for a future generating system. The results of the three scenarios were obtained and com- pared using a comprehensive analysis. The maximum annual load was calculated at average rates of 6.79% in the more reasonable scenarios using the MATLAB package following the curve-fitting polynomial tech- nique. Hahn, et al. [5] used various models and methods to pre- dict future load demand. These various models and methods help decision-makers in the electricity sectors in facilities planning and an optimal day-to-day operation of power plant. The authors conclude that finding an appropriate approach and model is at core of the decision process and a decision maker in the energy sector has the need of accurate forecasts since most of the decisions are necessarily based on forecasts of future demands, where the selection of an appropriate model is the one of the first decision to be made. Doege, et al. [6] realized power markets have been restructured since 1990s worldwide with electrical power nowadays being traded as a commodity. T he liberaliza- tion and with it, uncertainty in gas, fuel and electrical power prices, requires effective management of produc- tion facilities a nd their financia l c ontracts. 3. Results and Discussions Because of random fluctuations of the obtained data of maximum annual load for Kingdom of Bahrain over the years starting by the year 2009, the curve fitting tech- nique is applied to find out the estimated load values for 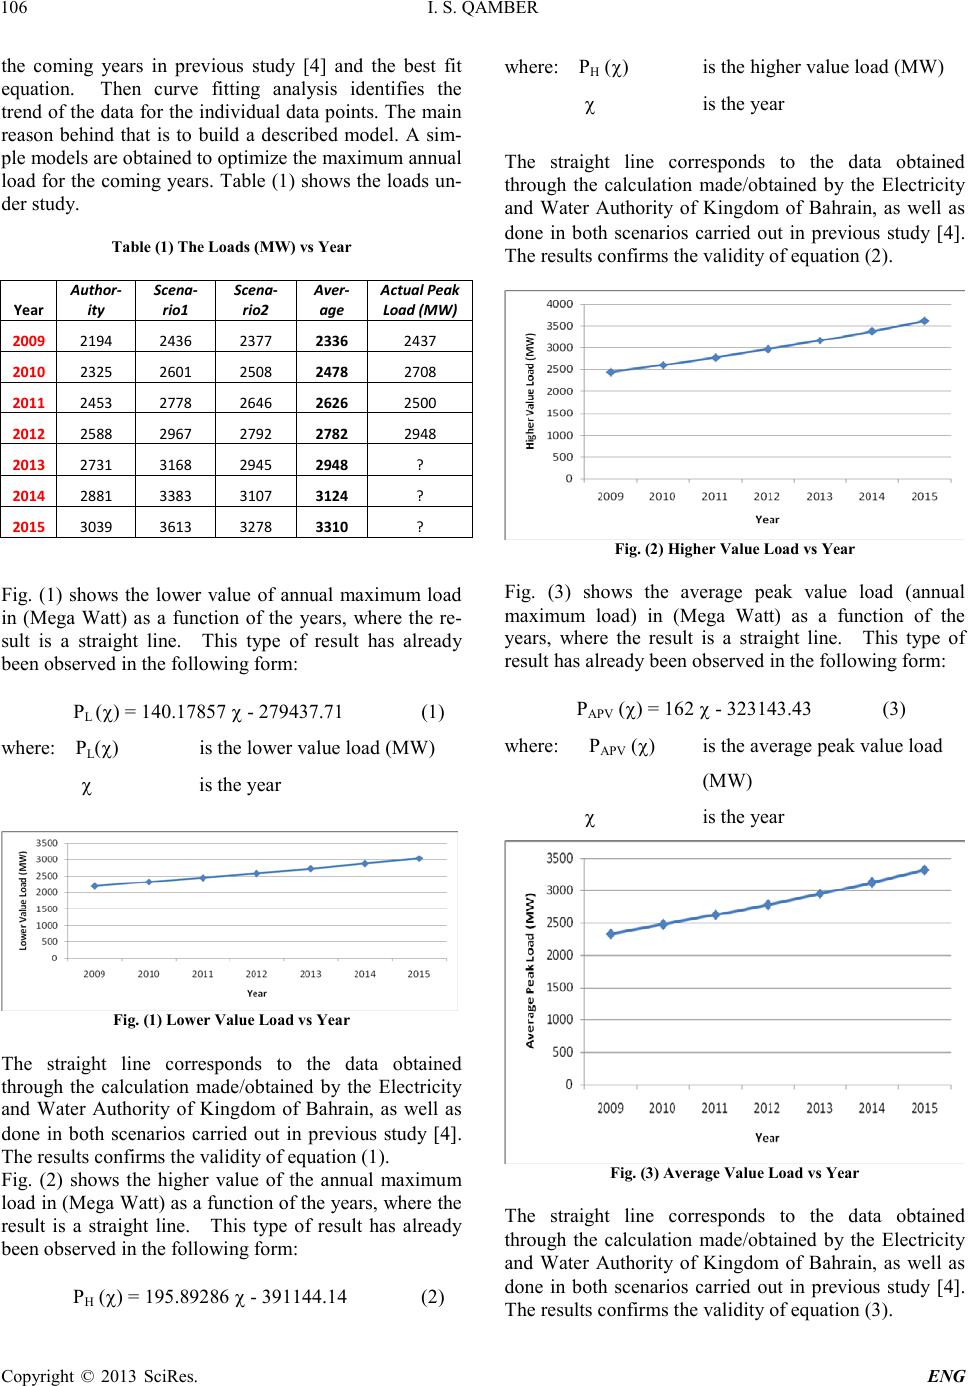 I. S. QAMBER Copyright © 2013 SciRes. ENG 106 the coming years in previous study [4] and the best fit equation. Then curve fitting analysis identifies the trend of the data for the individual data points. The main reason behind that is to build a described model. A sim- ple models are obtained to optimize the maximum annual load for the coming years. Table (1) shows the loads un- der study. Table (1) The Loads (MW) vs Year Year Author- ity Scena- rio1 Scena- rio2 Aver- age Actual Peak Load (MW) 2009 2194 2436 2377 2336 2437 2010 2325 2601 2508 2478 2708 2011 2453 2778 2646 2626 2500 2012 2588 2967 2792 2782 2948 2013 2731 3168 2945 2948 ? 2014 2881 3383 3107 3124 ? 2015 3039 3613 3278 3310 ? Fig. (1) shows the lower value of annual maximum load in (Mega Watt) as a function of the years, where the re- sult is a straight line. This type of result has already been observed in the following form: PL (χ) = 140.17857 χ - 279437.71 (1) where: PL(χ) is the lower value load (MW) χ is the year Fig. (1) Lower Val ue Load vs Year The straight line corresponds to the data obtained through the calculation made/obtained by the Electricity and Water Authority of Kingdom of Bahrain, as well as done in both scenarios carried out in previous study [4]. The results confirms the validity of equation (1). Fig. (2) shows the higher value of the annual maximum load in (Mega Watt) as a function of the years, where the result is a straight line. This type of result has already been observed in the following form: PH (χ) = 195.89286 χ - 391144.14 (2) where: PH (χ) is the higher value load (MW) χ is the year The straight line corresponds to the data obtained through the calculation made/obtained by the Electricity and Water Authority of Kingdom of Bahrain, as well as done in both scenarios carried out in previous study [4]. The results confirms the validity of equation (2). Fig. (2) Higher Value Load vs Year Fig. (3) shows the average peak value load (annual maximum load) in (Mega Watt) as a function of the years, where the result is a straight line. This type of result has already been observe d in the following form: PAPV (χ) = 162 χ - 323143.43 (3) where: PAPV (χ) is the average peak value load (MW) χ is the year Fig. (3) Average Valu e Loa d vs Y ear The straight line corresponds to the data obtained through the calculation made/obtained by the Electricity and Water Authority of Kingdom of Bahrain, as well as done in both scenarios carried out in previous study [4]. The results confirms the validity of equation (3). 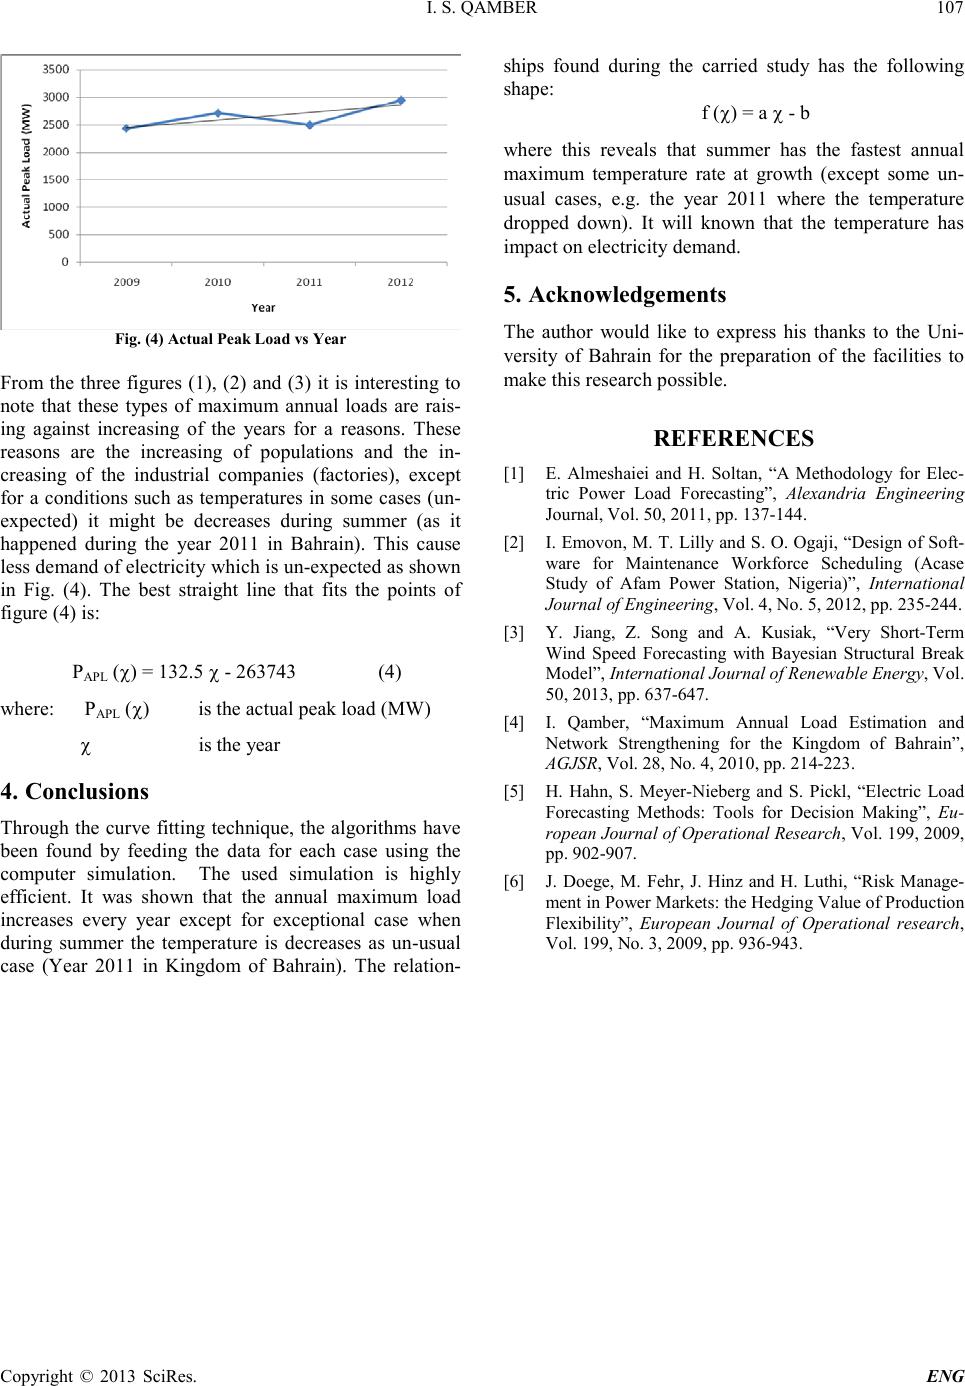 I. S. QAMBER Copyright © 2013 SciRes. ENG 107 Fig. (4) Actual Peak Load vs Year From the three figures (1), (2) and (3) it is interesting to note that these types of maximum annual loads are rais- ing against increasing of the years for a reasons. These reasons are the increasing of populations and the in- creasing of the industrial companies (factories), except for a conditions such as temperatures in some cases (un- expected) it might be decreases during summer (as it happened during the year 2011 in Bahrain). This cause less demand o f electricit y whi ch is un-expected as shown in Fig. (4). The best straight line that fits the points of figure (4) is: PAPL (χ) = 132.5 χ - 263743 (4) where: PAPL (χ) is the actual peak load (MW) χ is the year 4. Conclusions Through the curve fitting technique, t he algorithms have been found by feeding the data for each case using the computer simulation. The used simulation is highly efficient. It was shown that the annual maximum load increases every year except for exceptional case when during summer the temperature is decreases as un-usual case (Year 2011 in Kingdom of Bahrain). The relation- ships found during the carried study has the following shape: f (χ) = a χ - b where this reveals that summer has the fastest annual maximum temperature rate at growth (except some un- usual cases, e.g. the year 2011 where the temperature dropped down). It will known that the temperature has impact on electricity demand. 5. Acknowledgemen ts The author would like to express his thanks to the Uni- versity of Bahrain for the preparation of the facilities to make this research possible. REFERENCES [1] E. Almeshaiei and H. Soltan, “A Methodology for Elec- tric Power Load Forecasting”, Alexandria Engineering Journal , Vol. 50, 2011, pp. 13 7-144. [2] I. Emovon, M. T. Lilly and S. O. Ogaji, “Design of Soft- ware for Maintenance Workforce Scheduling (Acase Study of Afam Power Station, Nigeria)”, International Journal of Engineering, Vol. 4, No. 5, 2012, pp. 235-244. [3] Y. Jiang, Z. Song and A. Kusiak, “Very Short-Term Wind Speed Forecasting with Bayesian Structural Break Model”, Inter na t ional Journal of Renewable Energy, Vol. 50, 2013 , pp. 63 7-647. [4] I. Qamber, “Maximum Annual Load Estimation and Network Strengthening for the Kingdom of Bahrain”, AGJSR, Vol. 28, No. 4, 2010, pp. 214 -223. [5] H. Hahn, S. Meyer-Nieberg and S. Pickl, “Electric Load Forecasting Methods: Tools for Decision Making”, Eu- ropean Journal of Operational Research, Vol. 199, 2009, pp. 902-907. [6] J. Doege, M. Fehr, J. Hinz and H. Luthi, “Risk Manage- ment in Power Markets: the Hedging Value of Production Flexibility”, European Journal of Operational research, Vol. 199, No. 3, 2009, pp. 936-943. |