Paper Menu >>
Journal Menu >>
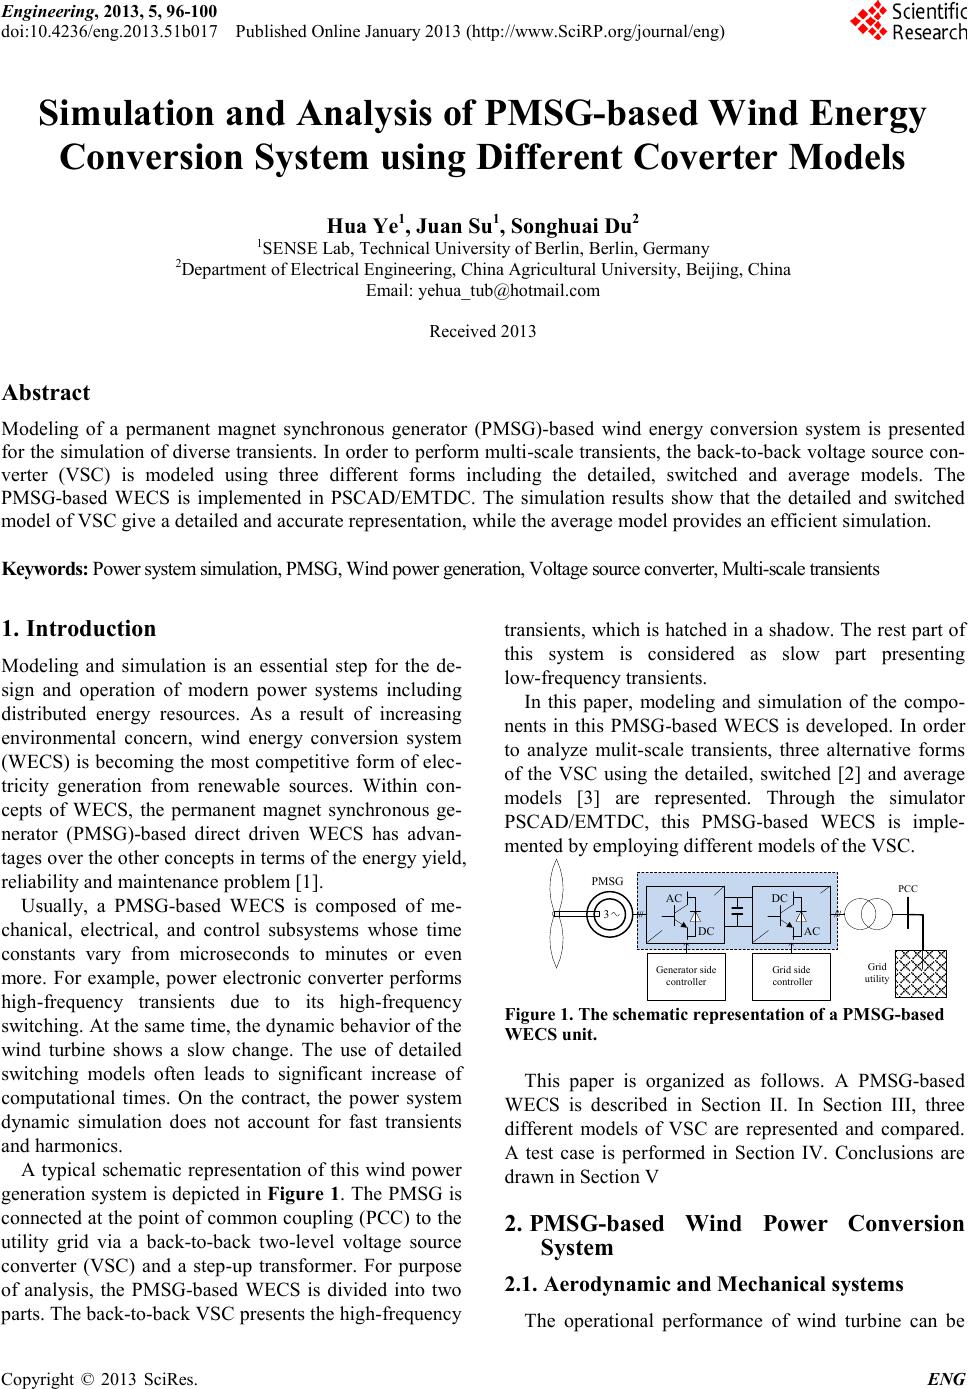 Engineering, 2013, 5, 96-100 doi:10.4236/eng.2013.51b017 Published Online January 2013 (http://www.SciRP.org/journal/eng) Copyright © 2013 SciRes. ENG Simulation and Analysis of PMSG-based Wind Energy Conversion S ystem using D if f eren t Covert er Mod els Hua Ye1, Juan Su1, Songhuai Du2 1SENSE Lab, Technical University of Berlin, Berlin, Germany 2Department of Electrical Engineering, China Agricultural University, Beijing, China Email: yehua_tub@hotmail.com Received 2013 Abstract Modeling of a permanent magnet synchronous generator (PMSG)-based wind energy conversion system is presented for the simulation of diverse transients. In order to perform multi-scale transients, the back-to-back voltage source con- verter (VSC) is modeled using three different forms including the detailed, switched and average models. The PMSG-based WECS is implemented in PSCAD/EMTDC. The simulation results show that the detailed and switched model of VSC give a detailed and accurate representation, while the average model pr ovides an efficient simulatio n. Keywords: Pow er system simulation, PMSG, Wind power generation, Voltage source converter, Multi-s cale transients 1. Introduction Modeling and simulation is an essential step for the de- sign and operation of modern power systems including distributed energy resources. As a result of increasing environmental concern, wind energy conversion system (WECS) is becoming the most competitive form o f e lec- tricity generation from renewable sources. Within con- cepts of WECS, the permanent magnet synchronous ge- nerator (PMSG)-based direct driven WECS has advan- tages over the other concepts in terms of the energy yield, reliability and ma i nte na nc e problem [1]. Usually, a PMSG-based WECS is composed of me- chanical, electrical, and control subsystems whose time constants vary from microseconds to minutes or even more. For example, power electronic converter performs high-frequency transients due to its high-frequency switc hi n g. At t he sa me t i me, t he dynamic behavior of the wind turbine shows a slow change. The use of detailed switching models often leads to significant increase of computatio nal times. On the contract, the power system dynamic simulation does not account for fast transients and ha rmonics. A typical schematic representation of this wind po wer generation s ystem is dep icted in Figure 1. The PMSG is conne cted a t the p oint o f co mmon co uplin g (PCC) to the utility grid via a back-to-back two-level voltage source converter (VSC) and a step-up transformer. For purpose of analysis, the PMSG-based WECS is divided into two parts. The back-to-back VSC p r es ents the hi g h-frequency transients, which is hatched in a shadow. The rest part of this system is considered as slow part presenting low-frequency tr ansi ents . In this paper, modeling and si mulation of the compo- nents in this PMSG-based WECS is developed. In order to analyze mulit-scale transients, three alternative forms of the VSC using the detaile d, switched [2] and average models [3] are represented. Through the simulator PSCAD/EMTDC, this PMSG-based WECS is imple- mented by employing different models of the VSC. PMSG 3 AC DC DC AC PCC Grid utility Generator side controller Grid side controller Figure 1. T he schematic represe ntation of a PMSG -based WECS unit. This paper is organized as follows. A PMSG-based WECS is described in Section II. In Section III, three different models of VSC are represented and compared. A test case is performed in Section IV. Conclusions are drawn in Section V 2. PMSG-based Wind Power Conversion Syste m 2.1. Aerodynamic and Mechanical s ystems The operational performance of wind turbine can be 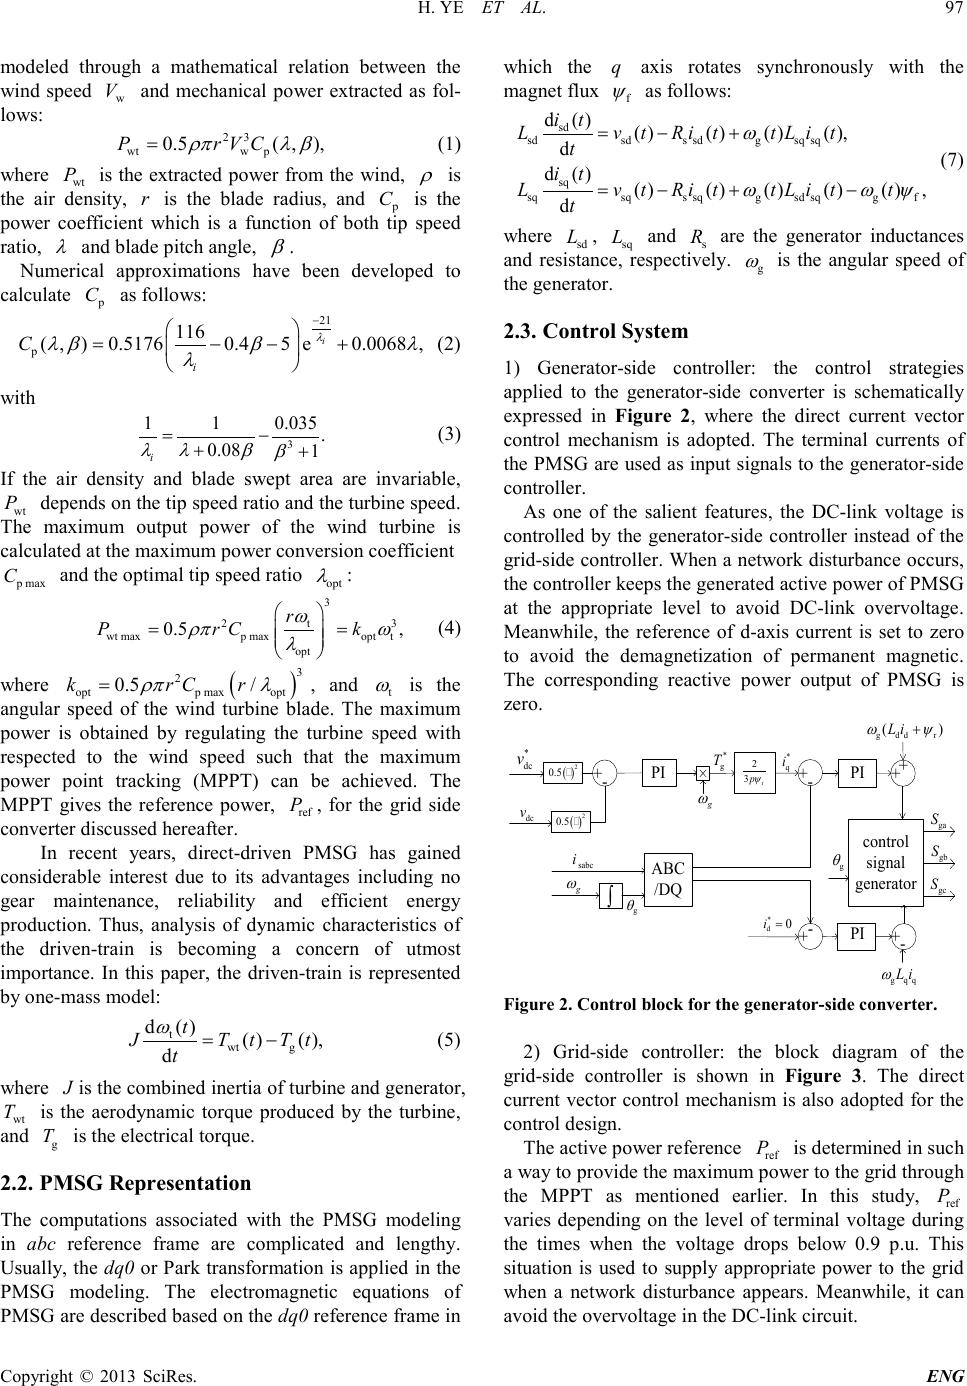 H. YE ET AL. Copyright © 2013 SciRes. ENG 97 modeled through a mathematical relation between the wind speed w V and mechanical power extracted as fol- lows: 23 wtw p 0.5( ,),P rVC ρπλ β = (1) where wt P is the extracted power from the wind, ρ is the air density, r is the blade radius, and p C is the power coefficient which is a function of both tip speed ratio, λ and blade pitch angle, β . Numerical approximations have been developed to calculate p C as follows: 21 p116 (,)0.51760.45 e0.0068 , i i C λ λββ λ λ − =−− + (2) with 3 110.035 . 0.08 1 i λλ β β = − ++ (3) If the air density and blade swept area are invariable, wt P depends on the tip speed ratio and the turbine speed. The maximum output power of the wind turbine is calculated at the maximum power conversion coefficient p max C and the optimal tip speed ratio opt λ : 3 23 t wt maxp maxoptt opt 0.5 , r P rCk ω ρπ ω λ = = (4) where ( ) 3 2 optp maxopt 0.5 /krC r ρπ λ = , and t ω is the angular speed of the wind turbine blade. The maximum power is obtained by regulating the turbine speed with respected to the wind speed such that the maximum power point tracking (MPPT) can be achieved. The MPPT gives the reference power, ref P , for the grid side converter discussed hereafter. In recent years, direct-driven PMSG has gained considerable interest due to its advantages including no gear maintenance, reliability and efficient energy production. Thus, analysis of dynamic characteristics of the driven-train is becoming a concern of utmost importance. In this paper, the driven-train is represented by one-mass mode l: twt g d ()() (), d t JT tTt t ω = − (5) where J is the combined inertia o f tur b ine a nd ge ne ra to r , wt T is the aerodynamic torque produced by the turbine, and g T is the electrical tor que. 2.2. PMSG Representation The computations associated with the PMSG modeling in abc reference frame are complicated and lengthy. Usually, the dq0 or Park transformation is applied in the PMSG modeling. The electromagnetic equations of PMSG are described based on the dq0 reference frame in which the q axis rotates synchronously with the magnet flux f ψ as follows: sd sdsds sdgsq sq sq sqsqs sqgsd sqgf d ()()() ()(), d d ()()()()()() , d it Lvt RittLit t it Lvt RittLitt t ω ω ωψ =−+ =−+ − (7) where sd L, sq L and s R are the generator inductances and resistance, respectively. g ω is the angular speed of the gener ator. 2.3. Control System 1) Generator-side controller: the control strategies applied to the generator-side converter is schematically expressed in Figure 2, where the direct current vector control mechanism is adopted. The terminal currents of the PMSG are used as input signals to the generator -side controller. As one of the salient features, the DC-link voltage is controlled by the generator-side controller instead of the grid-side controller. When a network disturbance occurs, the controller keeps the generated active po wer of PMSG at the appropriate level to avoid DC-link overvoltage. Meanwhile, the reference of d-axis current is set to zero to avoid the demagnetization of permanent magnetic. The corresponding reactive power output of PMSG is zero. ( ) 2 0.5 * dc v ( ) 2 0.5 dc v +- g ω * g T r 2 3p ψ +- * q i ++ g ddr ()Li ωψ + g ω ∫ ABC /DQ +-+- g qq Li ω * d0i= control signal generator g θ g θ PI sabc i PI PI ga S gb S gc S Figure 2. Cont rol bloc k for the generator-side converter. 2) Grid-side controller: the block diagram of the grid-side controller is shown in Figure 3. The direct current vector control mechanism is also adopted for the control desi gn. The active power reference ref P is de termined in such a way to provide the maximum power to the grid through the MPPT as mentioned earlier. In this study, ref P varies depending on the level of terminal voltage during the times when the voltage drops below 0.9 p.u. This situation is used to supply appropriate power to the grid when a network disturbance appears. Meanwhile, it can avoid the overvolt age in the DC-link circuit. 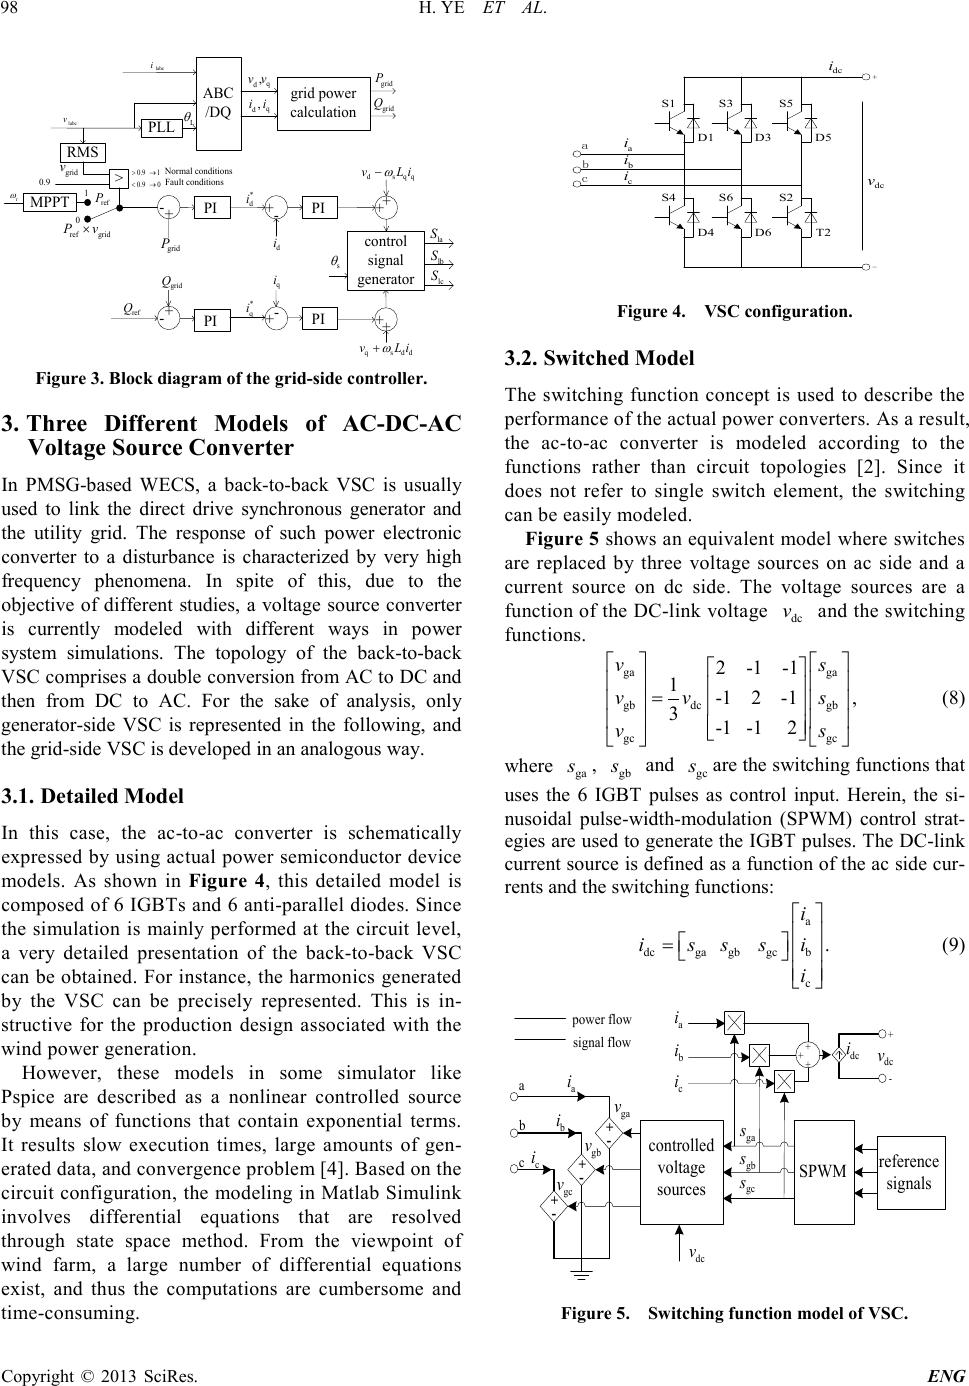 H. YE ET AL. Copyright © 2013 SciRes. ENG 98 ABC /DQ labc i labc v PLL L θ grid power calculation d ,i q i d,v q v grid Q grid P +- * d i ++ ds qq v Li ω − +-++ qs dd v Li ω + * q i control signal generator s θ q i -+ ref Q grid Q -+ d i grid P RMS > ref P r ω MPPT grid v 0.9 ref grid Pv× Fault conditions 0.9 1 0.9 0 >→ <→ 1 0 Normal conditions PI la S lb S lc S PI PI PI Figure 3. Block diagr am of the grid-side controller. 3. Three Different Models of AC-DC-AC Voltage Source Converter In PMSG-based WECS, a back-to-back VSC is usually used to link the direct drive synchronous generator and the utility grid. The response of such power electronic converter to a disturbance is characterized by very high frequency phenomena. In spite of this, due to the objective of different studies, a voltage source converter is currently modeled with different ways in power system simulations. The topology of the back-to-back VSC comprises a double conversion from AC to DC and then from DC to AC. For the sake of analysis, only generator-side VSC is represented in the following, and the gri d-side VSC is developed in an analogous way. 3.1. Detailed Mod el In this case, the ac-to-ac converter is schematically expressed by using actual power semiconductor device models. As shown in Figure 4, this detailed model is composed of 6 IGBTs and 6 anti-parallel diodes. Since the simulation is mainly performed at the circuit level, a very detailed presenta tion of the back-to-back VSC can be obtained. For instance, t he har monics generated by the VSC can be precisely represented. This is in- structive for the production design associated with the wind power generation. However, these models in some simulator like Pspice are described as a nonlinear controlled source by means of functions that contain exponential terms. It result s slow execution times, large amounts of gen- erated data, and co nverge nce pro blem [4]. Based on the circuit configuration, t he mo deling in Matlab Simulink involves differential equations that are resolved through state space method. From the viewpoint of wind farm, a large number of differential equations exist, and thus the computations are cumbersome and time-co nsuming. S1 D1 S3 D3 S5 D5 S4 D4 S6 D6 S2 T2 a b c dc v + - a i b i c i dc i Figure 4. VSC co nfiguration. 3.2. Switched Model The switching func tion concept is use d to describe the performance o f t he act ual po wer co n verter s. As a result, the ac-to-ac converter is modeled according to the functions rather than circuit topologie s [2]. Since it does not refer to single switch element, the s wi tching can be easily modeled. Figur e 5 sh ows an equivalent model where switches are replaced by three voltage sources on ac side and a current source on dc side. The voltage sources are a func tion o f the D C-link voltage dc v and the switching functi ons . ga ga gb dcgb gc gc 2 -1 -1 1-1 2 -1, 3-1 -1 2 vs vv s vs = (8) where ga s , gb s and gc s are the switching functions that uses the 6 IGBT pulses as control input. Herein, the si- nusoidal pulse-width-mod ulation (SP WM) control strat- egies are used to generate the IGBT pulses. The DC-link current source is defined as a function of the ac side cur- rents and the swi tchi ng functio ns: a dcga gbgcb c . i iss si i = (9) + - + - + - a b ccontrolled voltage sources ga v gb v gc v dc v SPWM ga s gb s gc s a i b i c i + ++ dc i dc v + - a i b i c i power flow signal flow reference signals Figure 5 . Sw itching functio n model of VSC. 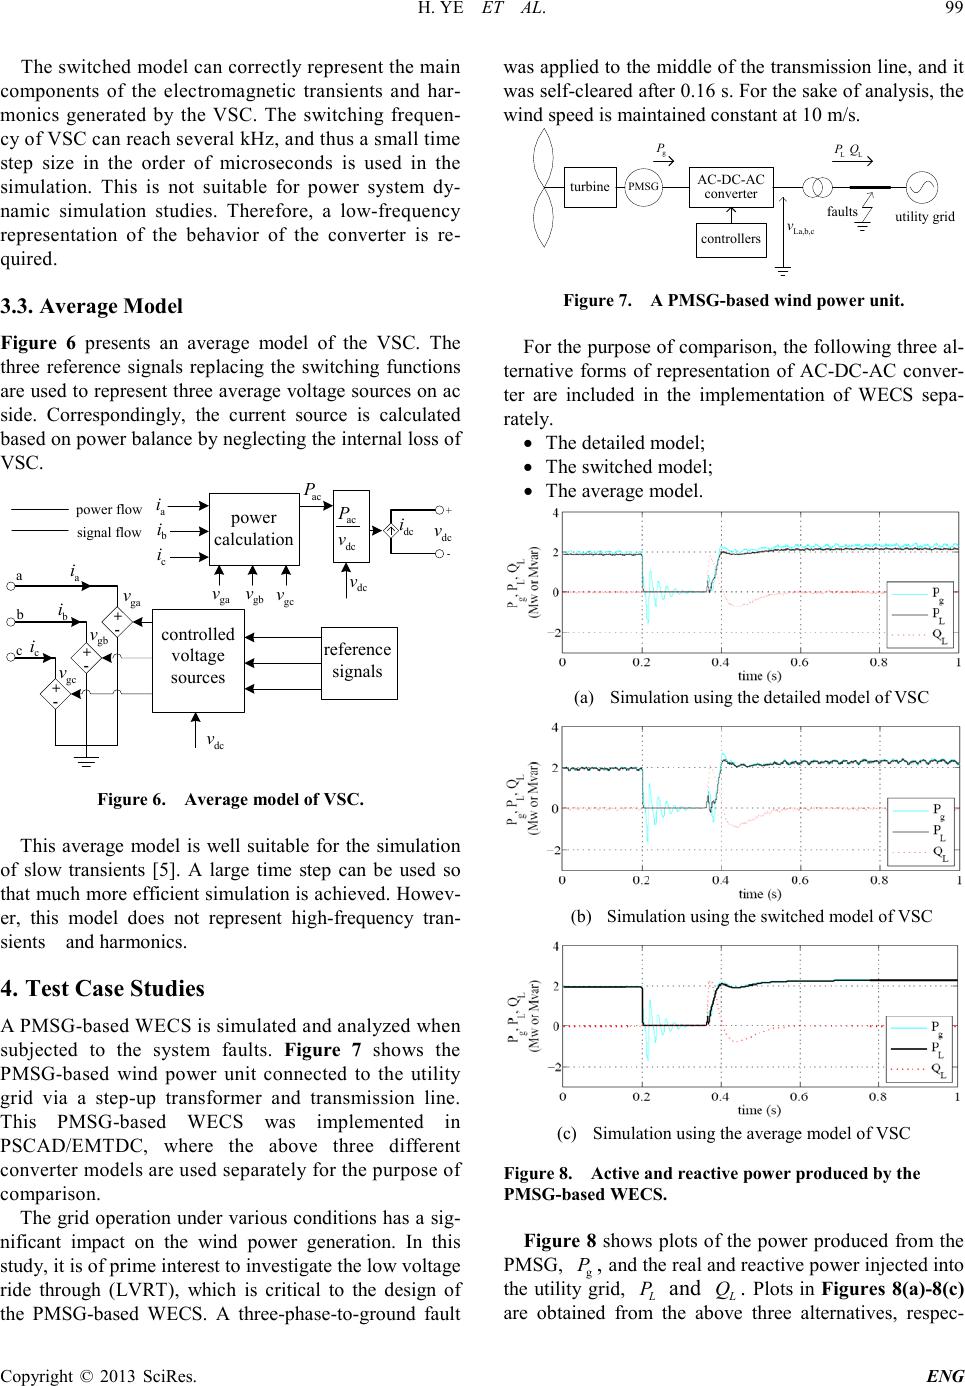 H. YE ET AL. Copyright © 2013 SciRes. ENG 99 The switched mode l can corr ectly represe nt the main components of the electromagnetic transients and har- monics generated by the VSC. The switching frequen- cy of VSC can reach several kHz, and t hu s a s mal l ti me step size in the order of microseconds is used in the simulation. This is not suitable for power system dy- namic simulation studies. Therefore, a low-frequency representation of the behavior of the converter is re- quired. 3.3. Average Model Figure 6 presents an average model of the VSC. The three reference signals replacing the switching functions are used to represent three average volta ge so urces o n ac side. Correspondingly, the current source is calculated based on power balance by negle ct i ng the i nte r na l lo ss of VSC. + - + - + - a b c controlled voltage sources ga v gb v gc v dc v a i b i c i dc i dc v + - a i b i c i power flow signal flow reference signals power calculation ga v gb v gc v dc v ac P ac dc P v Figure 6 . Averag e model of VS C. This average model is well suitable for the simulation of slow transients [5]. A large time step can be used so that much more efficie nt simulatio n is achie ved. Howev- er, this model does not represent high-frequency tran- sients and harmonics. 4. Test Case Studies A PMSG-based WECS is simulated and analyzed when subjected to the system faults. Figure 7 shows the PMSG-based wind power unit connected to the utility grid via a step-up transformer and transmission line. This PMSG-based WECS was implemented in PSCAD/EM T DC, where the above three different converter models are used se parately for the purpose of comparison. The grid operation under vario us condit ions ha s a sig- nificant impact on the wind power generation. In this study, it is o f prime interest to investigate the lo w voltage ride through (LVRT), which is critical to the design of the PMSG-based WECS. A three-phase-to- ground fault was applied to the middle of the trans mission line, and it was self -cleared after 0.16 s. For the sake o f anal ysis, the win d speed is maintained constant at 10 m/s. AC-DC-AC converter PMSG turbine faults utility grid L P L Q controllers La,b,c v g P Figure 7. A PMSG-base d wi nd power unit. For the purpose of comparison, the followi ng three al- ternative forms of representation of AC-DC-AC conver- ter are included in the implementation of WECS se pa- rately. • The detailed model; • The switched model; • The average model. (a) Simulation using the detailed model of VSC (b) Simula tion using the switched model of VSC (c) Simulation using the average model of VSC Figure 8. Active and reactive power produce d by the PMSG-based WEC S. Figure 8 shows plots of the power produced from the PMSG, g P , and the real and reactive power injected into the utility grid, L P and L Q . Plots in Figur es 8(a)-8(c) are obtained from the above three alternatives, respec- 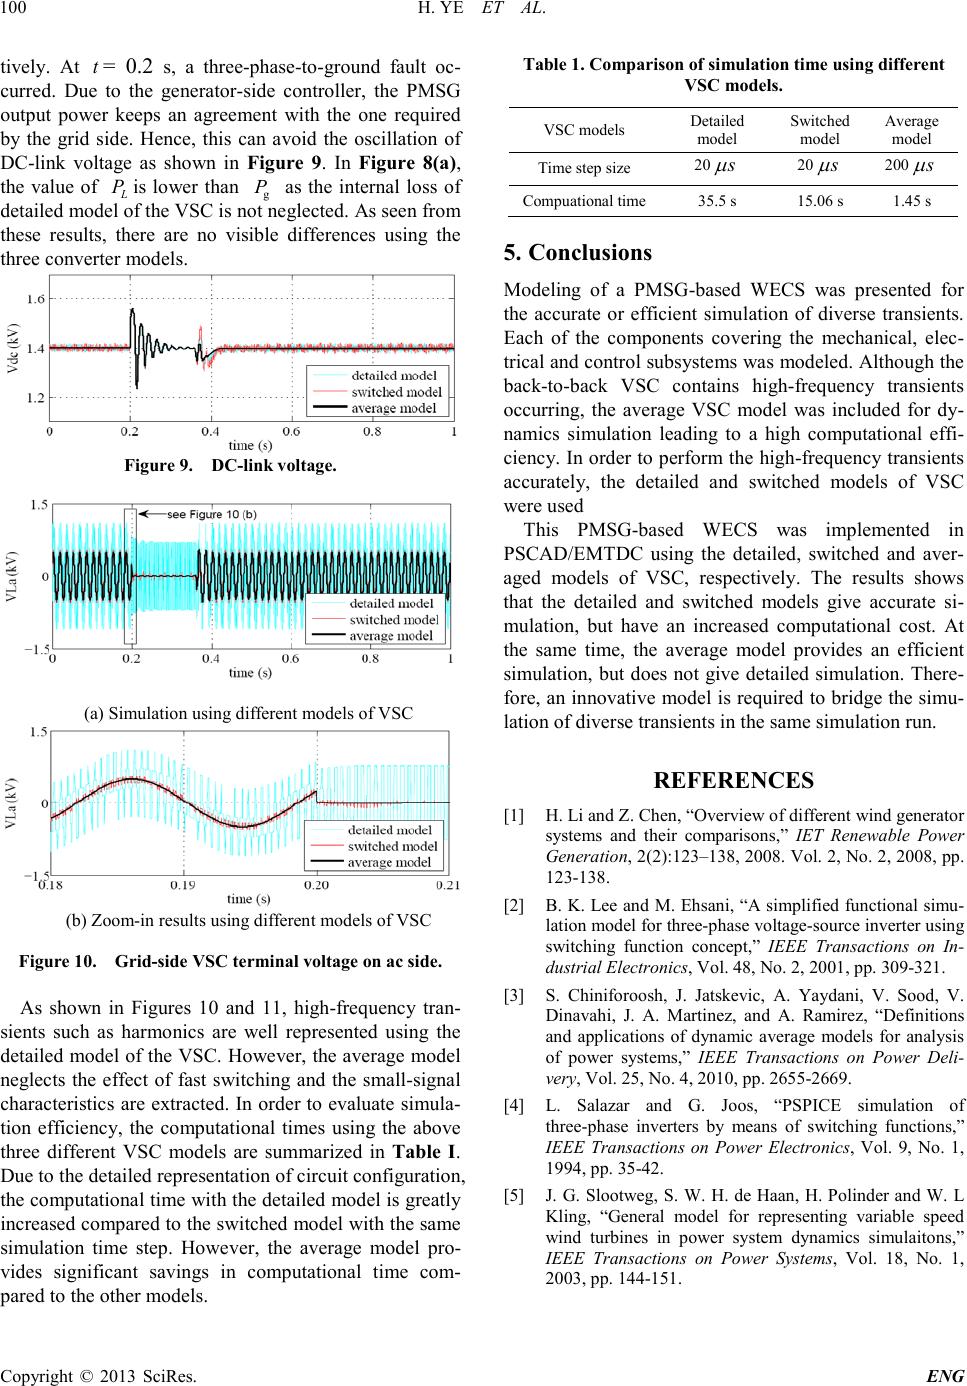 H. YE ET AL. Copyright © 2013 SciRes. ENG 100 tively. At t = 0.2 s, a three-phase-to-ground fault oc- curred. Due to the generator-side controller, the PMSG output power keeps an agreement with the one required by the grid side. Hence, this can avoid the oscillation of DC-link voltage as shown in Figure 9. In Figure 8(a), the value of L P is lower than g P as the internal loss of detailed model of the VSC is not neglec te d. As seen fr om these results, there are no visible differences using the three converter models. Figure 9. DC-link voltage. (a) Simulation using different models of VSC (b) Zoom-in results using different models of V SC Figure 10. Grid-side VSC terminal voltage on ac s ide. As shown in Figures 10 and 11, high-frequency tran- sients such as harmonics are well represented using the detailed model of the VSC. Ho wever, the average model neglects the effect of fast switching and the small-signal characteristics are extracted. In order to evaluate simula- tion efficiency, the computational times using the above three different VSC models are summarized in Table I. Due to the detailed representation of circuit configuration, the computatio nal time with the detailed model is greatly increased compared to the switched model with the same simulation time step. However, the average model pro- vides significant savings in computational time com- pared to the other models. Table 1. Comparison of simul ation time using different VSC models. VSC models Detail ed model Switched model Average model Time step size 20 s µ 20 s µ 200 s µ Compuational time 35. 5 s 15.06 s 1.45 s 5. Conclusions Modeling of a PMSG-based WECS was presented for the accurate or efficient simulation of diverse transients. Each of the components covering the mechanical, elec- trical and co ntrol subsystems was modeled. Although the back-to-back VSC contains high-frequency transients occurring, the average VSC model was included for dy- nami c s simula tion leading to a high computational effi- ciency. In order to perform the high-frequency transients accurately, the detailed and switched models of VSC were used This PMSG-based WECS was implemented in PSCAD/EMTDC using the detailed, switched and aver- aged models of VSC, respectively. The results shows that the detailed and switched models give accurate si- mulation, but have an increased computational cost. At the same time, the average model provides an efficient simulation, but does not give detailed si mulation. T here- fore, an innovative model is required to bridge the simu- lation of diverse transients in the same simulation run. REFERENCES [1] H. Li and Z. Chen, “Overview of different wind generator systems and their comparisons,” IET Renewable Power Generation, 2(2):123–138, 2008. Vol. 2, No . 2, 2008, pp. 123-138. [2] B. K. Lee and M. Ehsani, “A simplified functional simu- lation model for thr ee-ph ase voltage-source inverter using switching function concept,” IEEE Transactions on In- dustrial Electronics, Vol. 48, No. 2, 2001, pp. 309-321. [3] S. Chiniforoosh, J. Jatskevic, A. Yaydani, V. Sood, V. Dinavahi, J. A. Martinez, and A. Ramirez, “Definitions and applications of dynamic average models for analysis of power systems,” IEEE Transactions on Power Deli- very, Vol. 25, No. 4, 2010, pp. 2655-2669. [4] L. Salazar and G. Joos, “PSPICE simulation of three-phase inverters by means of switching functions,” IEEE Transactions on Power Electronics, Vol. 9, No. 1, 1994, pp. 35-42. [5] J. G. Slootweg, S. W. H. de Haan, H. Polinder and W. L Kling, “General model for representing variable speed wind turbines in power system dynamics simulaitons,” IEEE Transactions on Power Systems, Vol. 18, No. 1, 2003, pp. 144-151. |