 Journal of Cosmetics, Dermatological Sciences and Applications, 2013, 3, 28-35 http://dx.doi.org/10.4236/jcdsa.2013.31A006 Published Online January 2013 (http://www.scirp.org/journal/jcdsa) Automatic Facial Spots and Acnes Detection System Chuan-Yu Chang, Heng-Yi Liao Department of Computer Science and Information Engineering, National Yunlin University of Science and Technology, Yunlin, Taiwan. Email: chuanyu@yuntech.edu.tw Received November 13th, 2012; revised December 16th, 2012; accepted December 25th, 2012 ABSTRACT Recently medical cosmetic has attracted significant business opportunity. Micro cosmetic surgery usually involves in- vasive cosmetic procedures such as non-ablative laser procedure for skin rejuvenation. However, to select an appropri- ate treatment for skin relies on accurate preoperative evaluations. In this paper, an automatic facial skin defects detec- tion and recognition method is proposed. The system first locates the facial region from the input image. Then, the shapes of faces were recognized using a contour descriptor. The facial features are extracted to define regions of interest and an image segment method is used to extract potential defect. A support-vector-machine-based classifier is then used to classify the potential defects into spots, acnes and normal skin. Experimental results demonstrate effectiveness of the proposed method. Keywords: Medical Image Analysis; Texture Recognition; Skin Disease Identification; Spot and Acne Detection 1. Introduction Recently medical cosmetology has a great development. It usually involves invasive cosmetic procedures or op- eration such as non-ablative laser procedure for skin re- juvenation and filling injection to relieve wrinkles [1,2]. Most conventional skin analysis instruments are contact- based. A physician has to visually inspect the target re- gion and applies a contact test probe to magnify the tar- get region for inspection. This contact testing procedure may be unsanitary. Non-contact inspections analyze pa- tients’ facial skin conditions by a camera directly. Doc- tors and patients are not necessary to be face to face. Furthermore, remote defect detection for consultation before cosmetology is possible. VISIA is a widely used commercial instrument for skin analysis in cosmetic surgery. The skin condition is analyzed by multispectral images [3]. However, the cost is high and physicians should manual outline regions of interest (ROIs) during inspection. With gradually higher resolution in digital cameras, many digital imaging methods have been proposed to analyze skin conditions [4-7]. These investigations ap- plied various color quantization methods to distinguish whether the ROI is a spot or not. However, using pure color information to detect spots is difficult because shadow of facial organs (eyes, nose, mouth, or ears) may be misjudged as spots. In addition, most skin analysis systems require manu- ally outlining the regions of interest (ROIs) [3-5]. How- ever, manual ROI outlining is commonly known as a time-consuming and non-repeatable process. In our prior work, an automatic facial skin defect de- tection system was proposed [7]. However, the facial view was restricted to front. Hence, a novel skin condi- tions evaluation system, which integrates a multi-view image acquisition device and automatic facial skin defect detection, is proposed in this paper. A facial features de- tection approach is applied to obtain positions of the fa- cial features which are further applied to extract the ROI. A special color space and an adaptive threshold based on probability distribution are used to characterize potential defects from the ROI. Finally some significant texture features are extracted and applied to a specific designed classifier to classify potential defects into normal skin, spots and acnes. The rest of this paper is organized as follows. Section 2 introduces details of the proposed skin defects detec- tion and recognition system including definition of ROI, potential defect extraction and texture features used for classification. Section 3 demonstrates the experimental result. Conclusions and possible research topics in the future are given in Section 4. 2. The Proposed System In this paper, an automatic facial skin defects detection and recognition system is proposed. When the facial im- ages are captured by a high definition camera, the skin defects are detected and recognized automatically. Fig- Copyright © 2013 SciRes. JCDSA 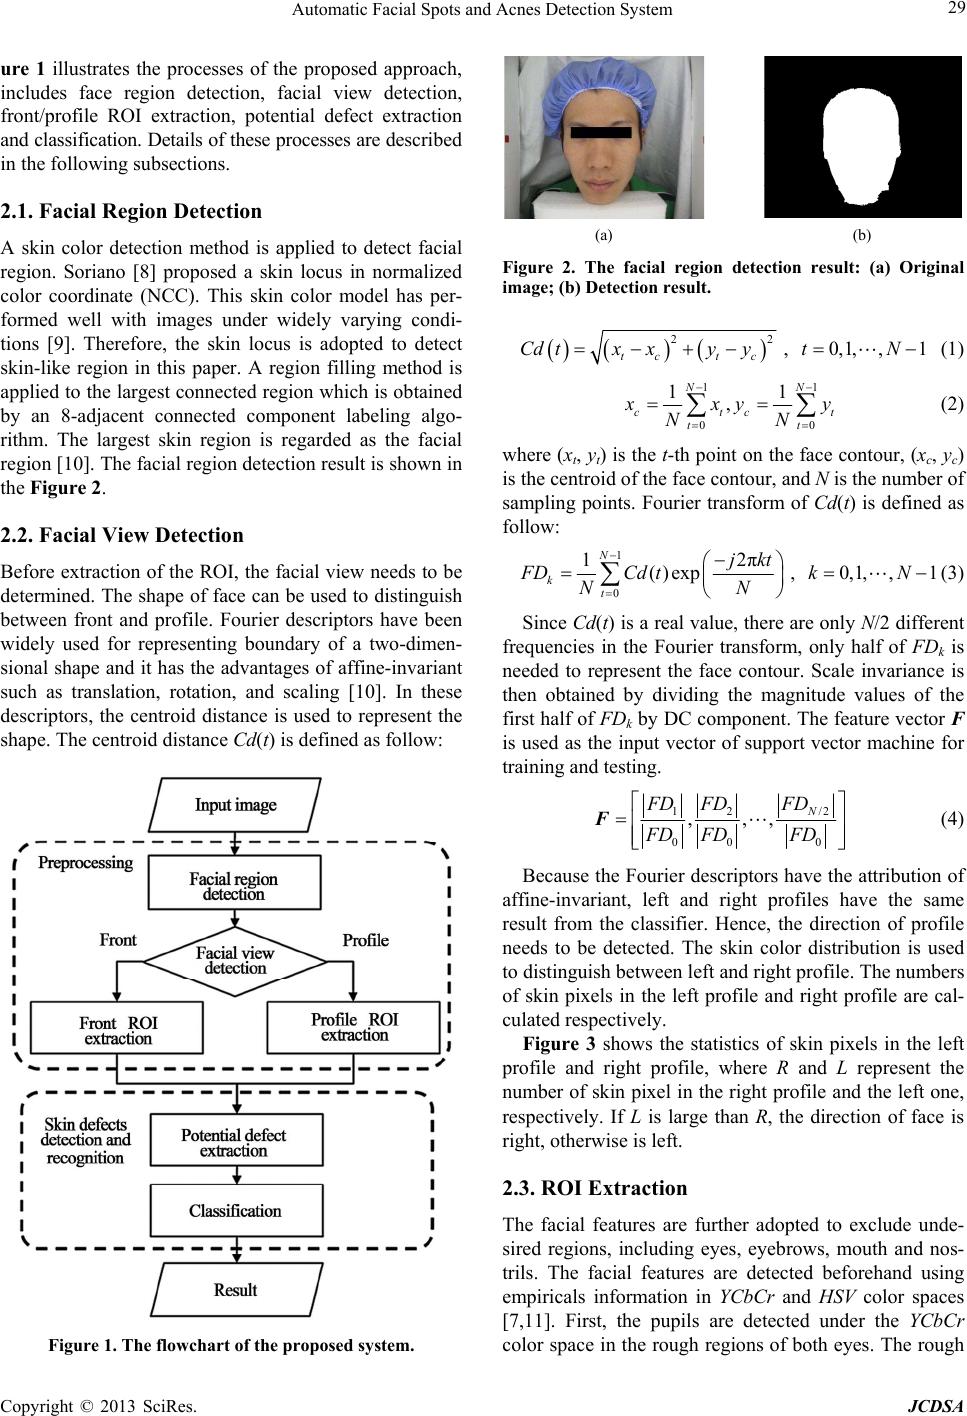 Automatic Facial Spots and Acnes Detection System 29 ure 1 illustrates the processes of the proposed approach, includes face region detection, facial view detection, front/profile ROI extraction, potential defect extraction and classification. Details of these processes are described in the following subsections. 2.1. Facial Region Detection A skin color detection method is applied to detect facial region. Soriano [8] proposed a skin locus in normalized color coordinate (NCC). This skin color model has per- formed well with images under widely varying condi- tions [9]. Therefore, the skin locus is adopted to detect skin-like region in this paper. A region filling method is applied to the largest connected region which is obtained by an 8-adjacent connected component labeling algo- rithm. The largest skin region is regarded as the facial region [10]. The facial region detection result is shown in the Figure 2. 2.2. Facial View Detection Before extraction of the ROI, the facial view needs to be determined. The shape of face can be used to distinguish between front and profile. Fourier descriptors have been widely used for representing boundary of a two-dimen- sional shape and it has the advantages of affine-invariant such as translation, rotation, and scaling [10]. In these descriptors, the centroid distance is used to represent the shape. The centroid distance Cd(t) is defined as follow: Figure 1. The flowchart of the proposed system. (a) (b) Figure 2. The facial region detection result: (a) Original image; (b) Detection result. 22 , 0,1,,1 tc tc Cd txxyytN (1) 11 00 11 , NN ctc tt t xy y NN (2) where (xt, yt) is the t-th point on the face contour, (xc, yc) is the centroid of the face contour, and N is the number of sampling points. Fourier transform of Cd(t) is defined as follow: 1 0 12π ()exp , 0,1,,1 N k t jkt FDCd tkN NN (3) Since Cd(t) is a real value, there are only N/2 different frequencies in the Fourier transform, only half of FDk is needed to represent the face contour. Scale invariance is then obtained by dividing the magnitude values of the first half of FDk by DC component. The feature vector F is used as the input vector of support vector machine for training and testing. /212 00 0 ,,, N FDFD FD FD FDFD F (4) Because the Fourier descriptors have the attribution of affine-invariant, left and right profiles have the same result from the classifier. Hence, the direction of profile needs to be detected. The skin color distribution is used to distinguish between left and right profile. The numbers of skin pixels in the left profile and right profile are cal- culated respectively. Figure 3 shows the statistics of skin pixels in the left profile and right profile, where R and L represent the number of skin pixel in the right profile and the left one, respectively. If L is large than R, the direction of face is right, otherwise is left. 2.3. ROI Extraction The facial features are further adopted to exclude unde- sired regions, including eyes, eyebrows, mouth and nos- trils. The facial features are detected beforehand using empiricals information in YCbCr and HSV color spaces [7,11]. First, the pupils are detected under the YCbCr color space in the rough regions of both eyes. The rough Copyright © 2013 SciRes. JCDSA 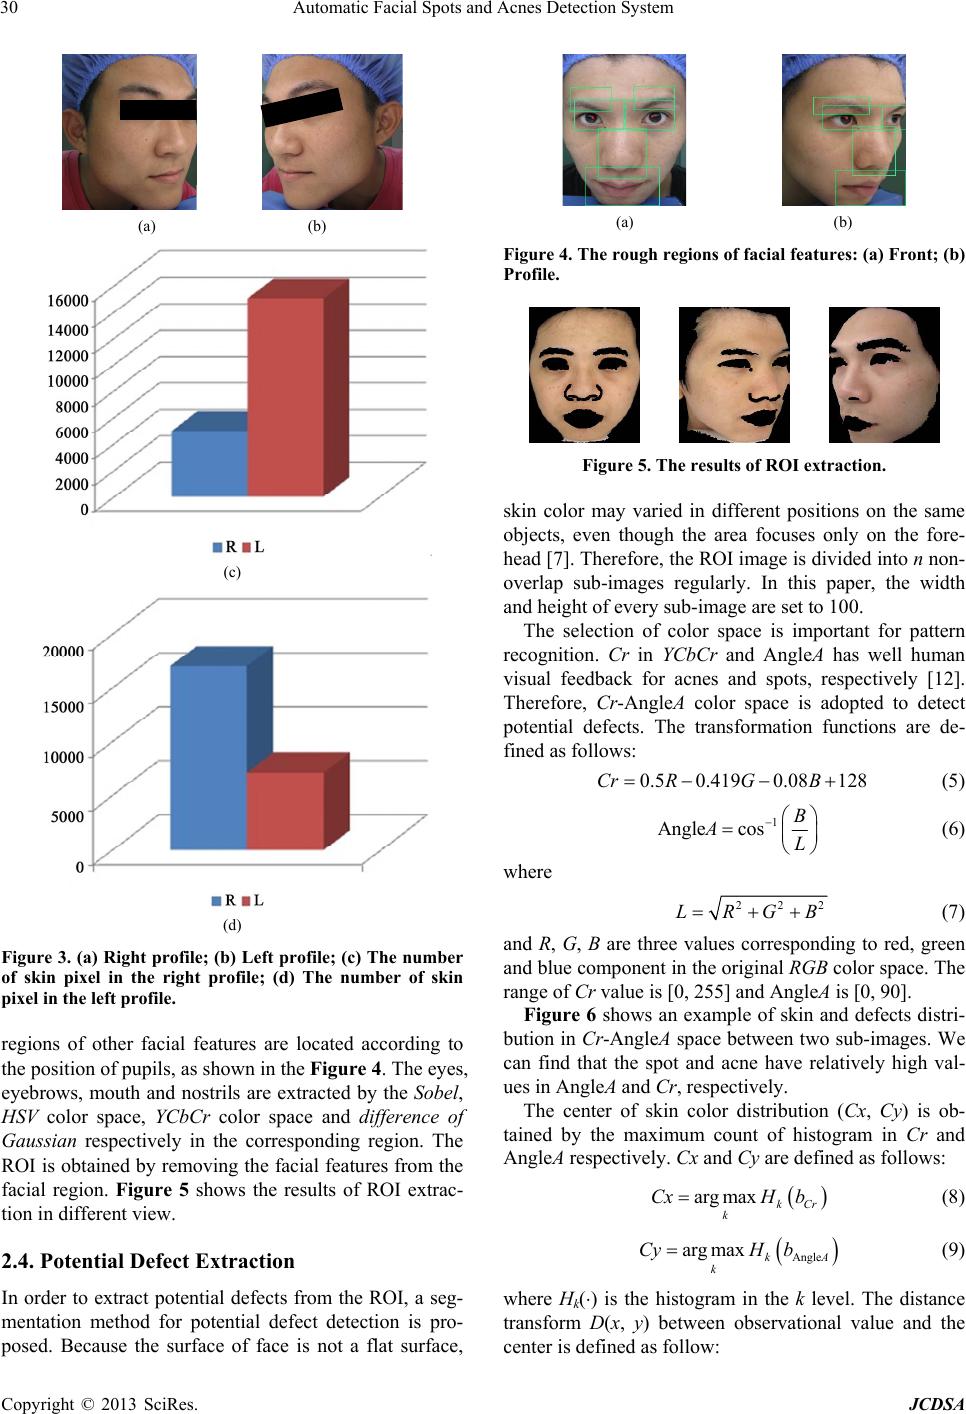 Automatic Facial Spots and Acnes Detection System 30 (a) (b) (c) (d) Figure 3. (a) Right profile; (b) Left profile; (c) The number of skin pixel in the right profile; (d) The number of skin pixel in the left profile. regions of other facial features are located according to the position of pupils, as shown in the Figure 4. The eyes, eyebrows, mouth and nostrils are extracted by the Sobel, HSV color space, YCbCr color space and difference of Gaussian respectively in the corresponding region. The ROI is obtained by removing the facial features from the facial region. Figure 5 shows the results of ROI extrac- tion in different view. 2.4. Potential Defect Extraction In order to extract potential defects from the ROI, a seg- mentation method for potential defect detection is pro- posed. Because the surface of face is not a flat surface, (a) (b) Figure 4. The rough regions of facial features: (a) Front; (b) Profile. Figure 5. The results of ROI extraction. skin color may varied in different positions on the same objects, even though the area focuses only on the fore- head [7]. Therefore, the ROI image is divided into n non- overlap sub-images regularly. In this paper, the width and height of every sub-image are set to 100. The selection of color space is important for pattern recognition. Cr in YCbCr and AngleA has well human visual feedback for acnes and spots, respectively [12]. Therefore, Cr -AngleA color space is adopted to detect potential defects. The transformation functions are de- fined as follows: 0.50.4190.08 128Cr RGB (5) 1 Anglecos B AL (6) where 22 LRGB 2 A (7) and R, G, B are three values corresponding to red, green and blue component in the original RGB color space. The range of Cr value is [0, 255] and AngleA is [0, 90]. Figure 6 shows an example of skin and defects distri- bution in Cr-AngleA space between two sub-images. We can find that the spot and acne have relatively high val- ues in AngleA and Cr, respectively. The center of skin color distribution (Cx, Cy) is ob- tained by the maximum count of histogram in Cr and AngleA respectively. Cx and Cy are defined as follows: arg maxkCr k CxH b (8) Angle arg maxk k CyH b (9) where Hk() is the histogram in the k level. The distance transform D(x, y) between observational value and the center is defined as follow: Copyright © 2013 SciRes. JCDSA 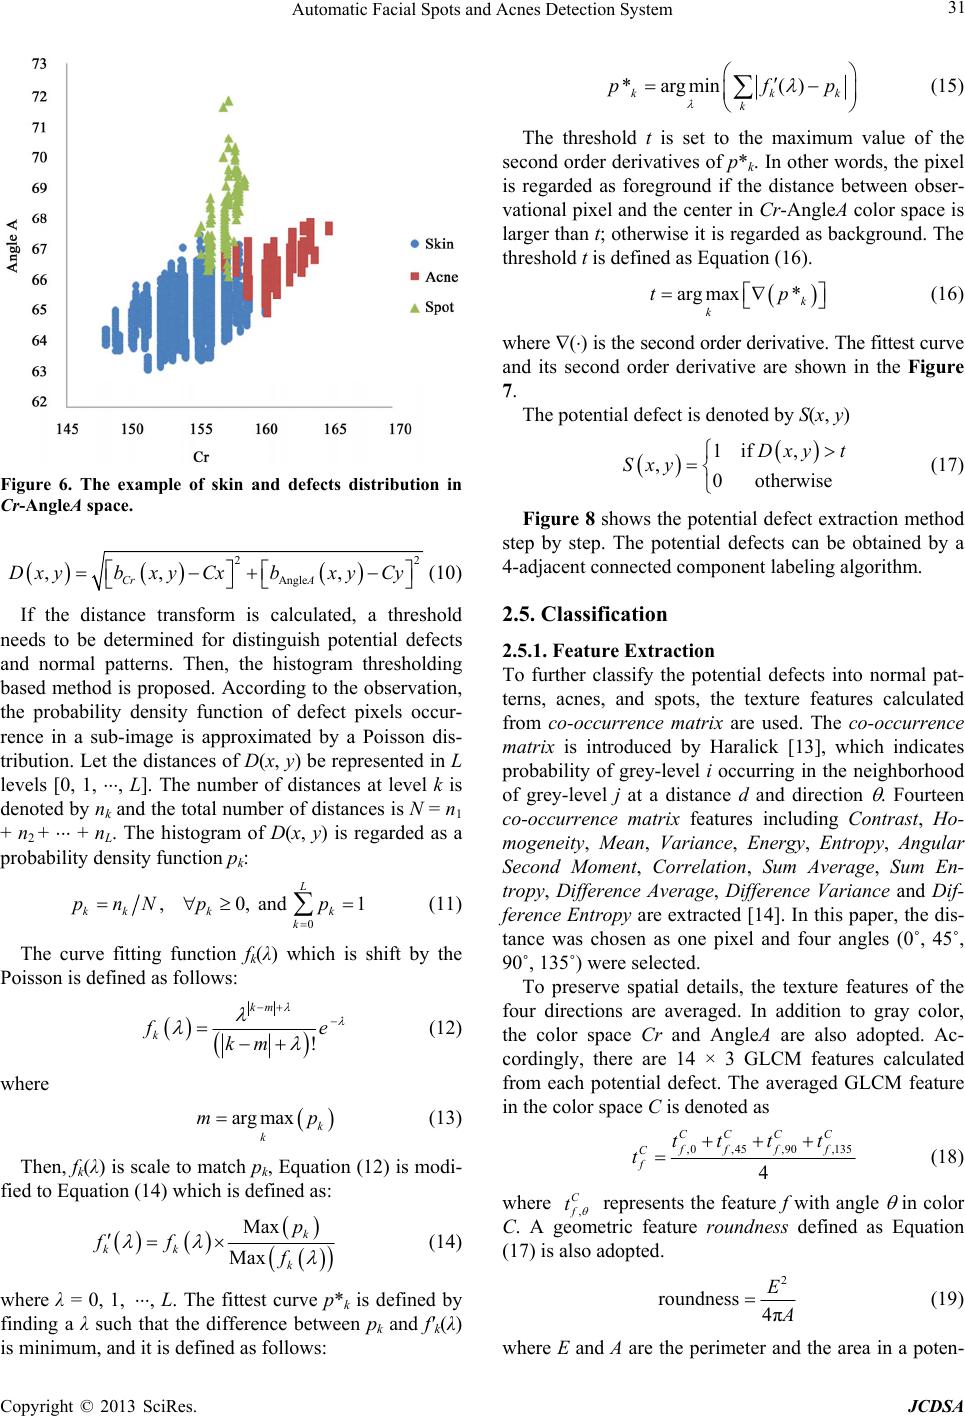 Automatic Facial Spots and Acnes Detection System 31 Figure 6. The example of skin and defects distribution in Cr-AngleA space. 2 Angle ,, , Cr A Dxybxy Cxbxy Cy 2 (10) If the distance transform is calculated, a threshold needs to be determined for distinguish potential defects and normal patterns. Then, the histogram thresholding based method is proposed. According to the observation, the probability density function of defect pixels occur- rence in a sub-image is approximated by a Poisson dis- tribution. Let the distances of D(x, y) be represented in L levels [0, 1, , L]. The number of distances at level k is denoted by nk and the total number of distances is N = n1 + n2 + + nL. The histogram of D(x, y) is regarded as a probability density function pk: 0 ,0, and 1 L kk kk k pnN pp (11) The curve fitting function fk(λ) which is shift by the Poisson is defined as follows: ! km k e km (12) where arg maxk k mp (13) Then, fk(λ) is scale to match pk, Equation (12) is modi- fied to Equation (14) which is defined as: Max Max k kk k p ff f (14) where λ = 0, 1, , L. The fittest curve p*k is defined by finding a λ such that the difference between pk and f'k(λ) is minimum, and it is defined as follows: *argmin () kk k pf k p p (15) The threshold t is set to the maximum value of the second order derivatives of p*k. In other words, the pixel is regarded as foreground if the distance between obser- vational pixel and the center in Cr-AngleA color space is larger than t; otherwise it is regarded as background. The threshold t is defined as Equation (16). arg max*k k t (16) where () is the second order derivative. The fittest curve and its second order derivative are shown in the Figure 7. The potential defect is denoted by S(x, y) 1if , ,0otherwise Dxy t Sxy (17) Figure 8 shows the potential defect extraction method step by step. The potential defects can be obtained by a 4-adjacent connected component labeling algorithm. 2.5. Classification 2.5.1. Feature Extraction To further classify the potential defects into normal pat- terns, acnes, and spots, the texture features calculated from co-occurrence matrix are used. The co-occurrence matrix is introduced by Haralick [13], which indicates probability of grey-level i occurring in the neighborhood of grey-level j at a distance d and direction . Fourteen co-occurrence matrix features including Contrast, Ho- mogeneity, Mean, Variance, Energy, Entropy, Angular Second Mom ent , Correlation, Sum Average, Sum En- tropy, Difference Average, Difference Variance and Dif- ference Entropy are extracted [14]. In this paper, the dis- tance was chosen as one pixel and four angles (0˚, 45˚, 90˚, 135˚) were selected. To preserve spatial details, the texture features of the four directions are averaged. In addition to gray color, the color space Cr and AngleA are also adopted. Ac- cordingly, there are 14 × 3 GLCM features calculated from each potential defect. The averaged GLCM feature in the color space C is denoted as ,0 ,45 ,90 ,135 4 CC C C ffff C f tt t t t (18) where , C f t represents the feature f with angle in color C. A geometric feature roundness defined as Equation (17) is also adopted. 2 roundness 4π E (19) where E and A are the perimeter and the area in a poten- Copyright © 2013 SciRes. JCDSA  Automatic Facial Spots and Acnes Detection System Copyright © 2013 SciRes. JCDSA 32 Figure 7. The result of threshold detection in a sub-image. Figure 8. The potential defects extraction processing. tial defect, respectively. Therefore, there are 42 + 1 fea- tures in candidate features. 2.5.2. Feature Selection In order to sift the most significant features, the sequen- tial floating forward selection (SFFS) is adopted for fea- ture selection [15]. This method consists of applying se- quential forward selection (SFS) and sequential back- ward selection (SBS). By using the SFS and SBS re- peatedly, it will converge when the defect recognition rate does not increase. In this paper, the cross validation rate is defined as the defect recognition rate which is implemented by LIBSVM [16]. There are 126 acnes, 134 spots and 134 normal patterns which are extracted manu- ally from the database. Figure 9 shows some examples of the training patterns. 2.5.3. Feature Extraction Support vector machine (SVM) is a popular and robust classifier in classification and regression analysis task. The SVM constructs a hyperplane in a high dimensional space which has the largest distance to the nearest train- ing data points of any class. Figure 10 shows the struc- ture of the classifier. The classifier is utilized to classify the potential skin defects into normal patterns, acnes and spots, and the structure of classifier is a decision tree structure which consists of two SVMs. The SVM1 is used to classify defects and normal patterns from the potential defects. The other SVM2 is used to classify acnes and spots from the defects. Moreover, the SFFS algorithm is carried out individually in each stage. 3. Experimental Results 3.1. Experiment Environment To reduce the influence of illumination, a special de- signed image acquisition device is created. Faces are captured by a high-resolution camera with resolution of 10 M pixels. Figure 11 shows the acquisition device. In this device, the acquisition parameters including camera parameters, light source, distances from subjects’ face to the camera are all fixed. The camera is Cannon Power Shot G10. ISO speed is set to 1/60 sec. Focal length is set to auto- matic mode. Because the forehead is an important part in medical cosmetology, every subject is asked to move 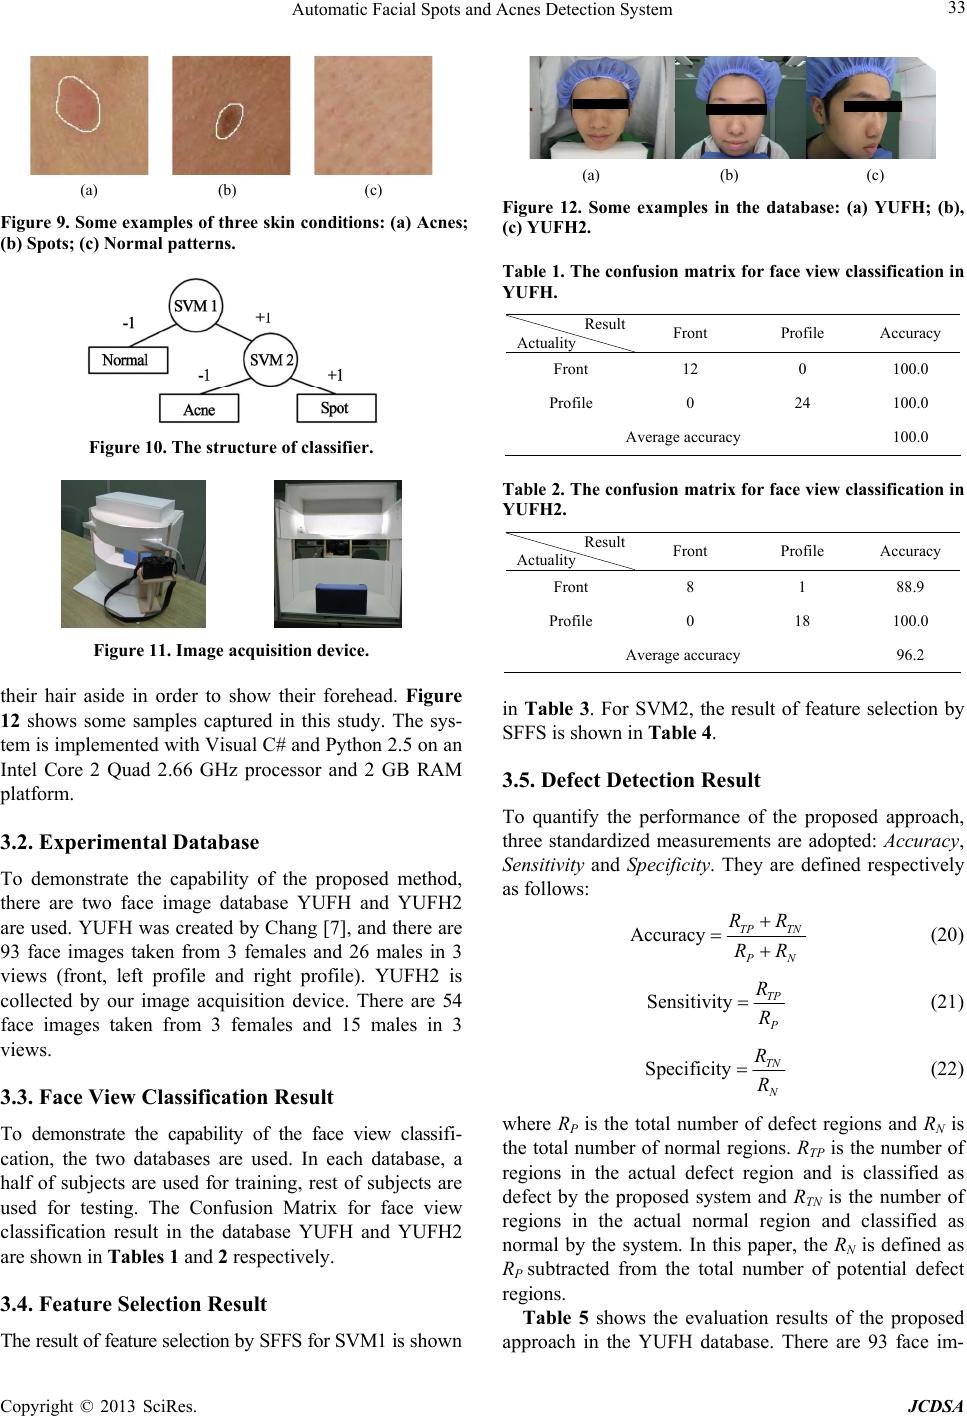 Automatic Facial Spots and Acnes Detection System 33 (a) (b) (c) Figure 9. Some examples of three skin conditions: (a) Acnes; (b) Spots; (c) Normal patterns. Figure 10. The structure of classifier. Figure 11. Image acquisition device. their hair aside in order to show their forehead. Figure 12 shows some samples captured in this study. The sys- tem is implemented with Visual C# and Python 2.5 on an Intel Core 2 Quad 2.66 GHz processor and 2 GB RAM platform. 3.2. Experimental Database To demonstrate the capability of the proposed method, there are two face image database YUFH and YUFH2 are used. YUFH was created by Chang [7], and there are 93 face images taken from 3 females and 26 males in 3 views (front, left profile and right profile). YUFH2 is collected by our image acquisition device. There are 54 face images taken from 3 females and 15 males in 3 views. 3.3. Face View Classification Result To demonstrate the capability of the face view classifi- cation, the two databases are used. In each database, a half of subjects are used for training, rest of subjects are used for testing. The Confusion Matrix for face view classification result in the database YUFH and YUFH2 are shown in Tables 1 and 2 respectively. 3.4. Feature Selection Result The result of feature selection by SFFS for SVM1 is shown (a) (b) (c) Figure 12. Some examples in the database: (a) YUFH; (b), (c) YUFH2. Table 1. The confusion matrix for face view classification in YUFH. Result Actuality Front Profile Accuracy Front 12 0 100.0 Profile 0 24 100.0 Average accuracy 100.0 Table 2. The confusion matrix for face view classification in YUFH2. Result Actuality Front Profile Accuracy Front 8 1 88.9 Profile 0 18 100.0 Average accuracy 96.2 in Table 3. For SVM2, the result of feature selection by SFFS is shown in Table 4. 3.5. Defect Detection Result To quantify the performance of the proposed approach, three standardized measurements are adopted: Accuracy, Sensitivity and Specificity. They are defined respectively as follows: Accuracy TP TN N RR RR (20) SensitivityTP R R (21) SpecificityTN R R (22) where RP is the total number of defect regions and RN is the total number of normal regions. RTP is the number of regions in the actual defect region and is classified as defect by the proposed system and RTN is the number of regions in the actual normal region and classified as normal by the system. In this paper, the RN is defined as RP subtracted from the total number of potential defect regions. Table 5 shows the evaluation results of the proposed approach in the YUFH database. There are 93 face im- Copyright © 2013 SciRes. JCDSA 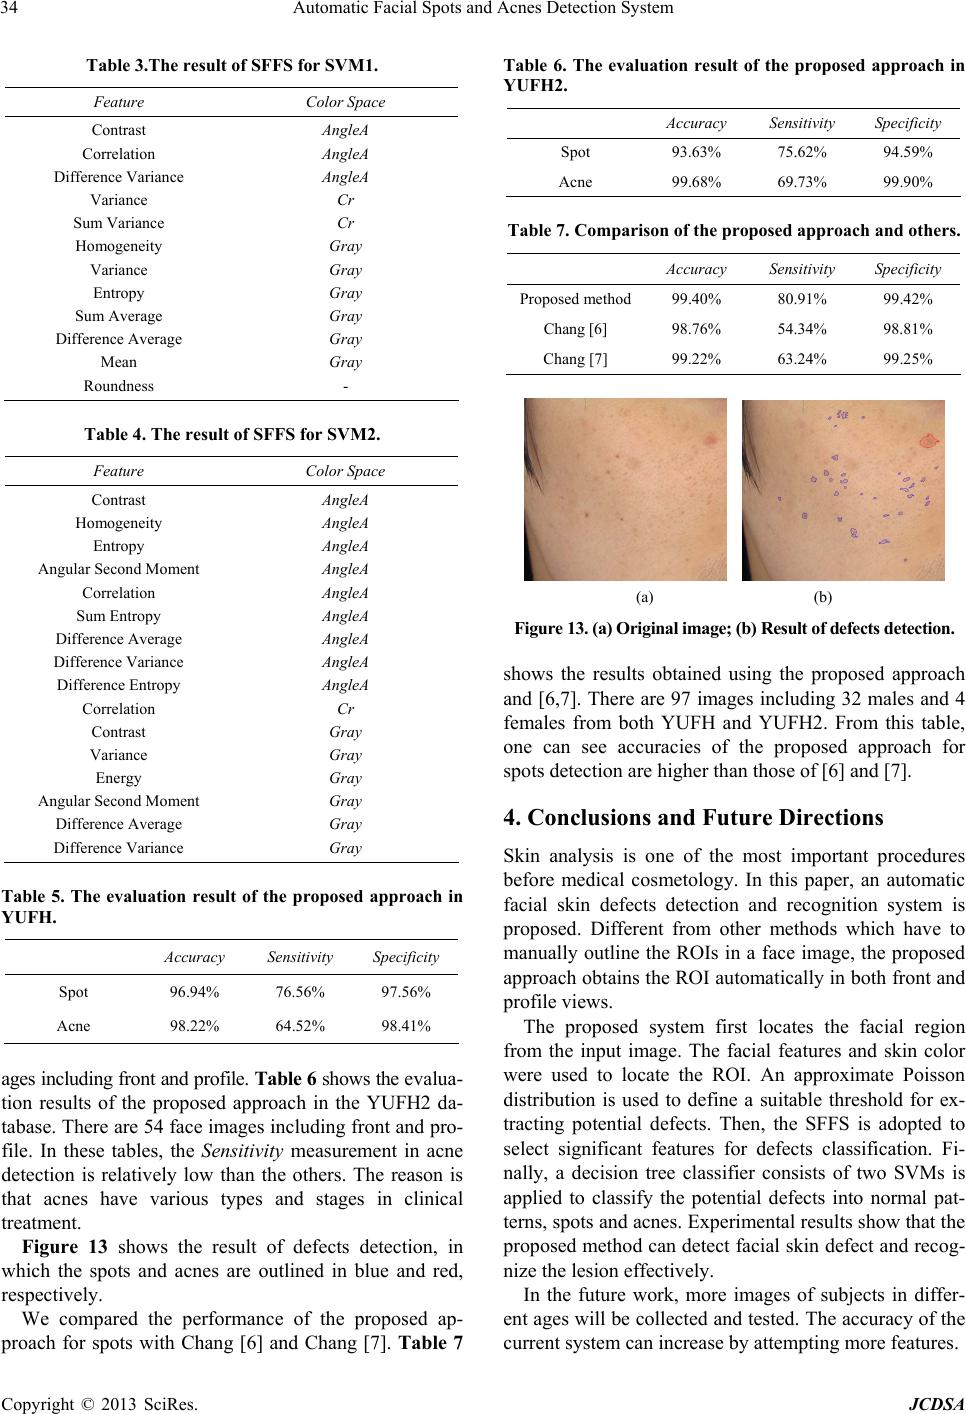 Automatic Facial Spots and Acnes Detection System 34 Table 3.The result of SFFS for SVM1. Feature Color Space Contrast Correlation Difference Variance Variance Sum Variance Homogeneity Variance Entropy Sum Average Difference Average Mean Roundness AngleA AngleA AngleA Cr Cr Gray Gray Gray Gray Gray Gray - Table 4. The result of SFFS for SVM2. Feature Color Space Contrast Homogeneity Entropy Angular Second Moment Correlation Sum Entropy Difference Average Difference Variance Difference Entropy Correlation Contrast Variance Energy Angular Second Moment Difference Average Difference Variance AngleA AngleA AngleA AngleA AngleA AngleA AngleA AngleA AngleA Cr Gray Gray Gray Gray Gray Gray Table 5. The evaluation result of the proposed approach in YUFH. Accuracy Sensitivity Specificity Spot 96.94% 76.56% 97.56% Acne 98.22% 64.52% 98.41% ages including front and profile. Table 6 shows the evalua- tion results of the proposed approach in the YUFH2 da- tabase. There are 54 face images including front and pro- file. In these tables, the Sensitivity measurement in acne detection is relatively low than the others. The reason is that acnes have various types and stages in clinical treatment. Figure 13 shows the result of defects detection, in which the spots and acnes are outlined in blue and red, respectively. We compared the performance of the proposed ap- proach for spots with Chang [6] and Chang [7]. Table 7 Table 6. The evaluation result of the proposed approach in YUFH2. Accuracy Sensitivity Specificity Spot 93.63% 75.62% 94.59% Acne 99.68% 69.73% 99.90% Table 7. Comparison of the proposed approach and others. Accuracy Sensitivity Specificity Proposed method99.40% 80.91% 99.42% Chang [6] 98.76% 54.34% 98.81% Chang [7] 99.22% 63.24% 99.25% (a) (b) Figure 13. (a) Original image; (b) Result of defects detection. shows the results obtained using the proposed approach and [6,7]. There are 97 images including 32 males and 4 females from both YUFH and YUFH2. From this table, one can see accuracies of the proposed approach for spots detection are higher than those of [6] and [7]. 4. Conclusions and Future Directions Skin analysis is one of the most important procedures before medical cosmetology. In this paper, an automatic facial skin defects detection and recognition system is proposed. Different from other methods which have to manually outline the ROIs in a face image, the proposed approach obtains the ROI automatically in both front and profile views. The proposed system first locates the facial region from the input image. The facial features and skin color were used to locate the ROI. An approximate Poisson distribution is used to define a suitable threshold for ex- tracting potential defects. Then, the SFFS is adopted to select significant features for defects classification. Fi- nally, a decision tree classifier consists of two SVMs is applied to classify the potential defects into normal pat- terns, spots and acnes. Experimental results show that the proposed method can detect facial skin defect and recog- nize the lesion effectively. In the future work, more images of subjects in differ- ent ages will be collected and tested. The accuracy of the current system can increase by attempting more features. Copyright © 2013 SciRes. JCDSA 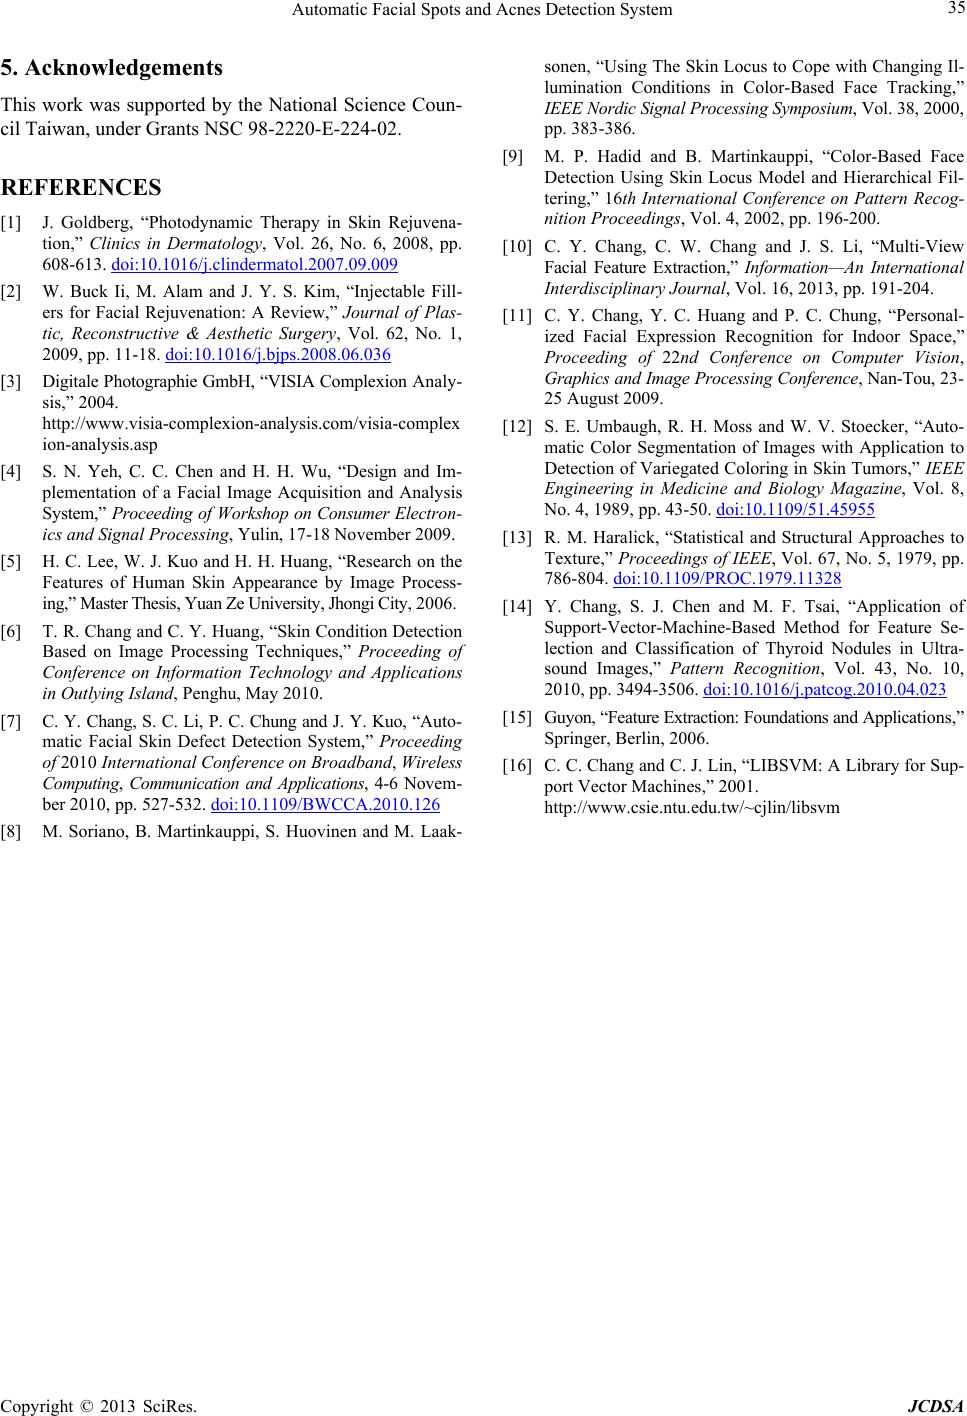 Automatic Facial Spots and Acnes Detection System Copyright © 2013 SciRes. JCDSA 35 5. Acknowledgements This work was supported by the National Science Coun- cil Taiwan, under Grants NSC 98-2220-E-224-02. REFERENCES [1] J. Goldberg, “Photodynamic Therapy in Skin Rejuvena- tion,” Clinics in Dermatology, Vol. 26, No. 6, 2008, pp. 608-613. doi:10.1016/j.clindermatol.2007.09.009 [2] W. Buck Ii, M. Alam and J. Y. S. Kim, “Injectable Fill- ers for Facial Rejuvenation: A Review,” Journal of Plas- tic, Reconstructive & Aesthetic Surgery, Vol. 62, No. 1, 2009, pp. 11-18. doi:10.1016/j.bjps.2008.06.036 [3] Digitale Photographie GmbH, “VISIA Complexion Analy- sis,” 2004. http://www.visia-complexion-analysis.com/visia-complex ion-analysis.asp [4] S. N. Yeh, C. C. Chen and H. H. Wu, “Design and Im- plementation of a Facial Image Acquisition and Analysis System,” Proceeding of Workshop on Consumer Electron- ics and Signal Processing, Yulin, 17-18 November 2009. [5] H. C. Lee, W. J. Kuo and H. H. Huang, “Research on the Features of Human Skin Appearance by Image Process- ing,” Master Thesis, Yuan Ze University, Jhongi City, 2006. [6] T. R. Chang and C. Y. Huang, “Skin Condition Detection Based on Image Processing Techniques,” Proceeding of Conference on Information Technology and Applications in Outlying Island, Penghu, May 2010. [7] C. Y. Chang, S. C. Li, P. C. Chung and J. Y. Kuo, “Auto- matic Facial Skin Defect Detection System,” Proceeding of 2010 International Conference on Broadband, Wireless Computing, Communication and Applications, 4-6 Novem- ber 2010, pp. 527-532. doi:10.1109/BWCCA.2010.126 [8] M. Soriano, B. Martinkauppi, S. Huovinen and M. Laak- sonen, “Using The Skin Locus to Cope with Changing Il- lumination Conditions in Color-Based Face Tracking,” IEEE Nordic Signal Processing Symposium, Vol. 38, 2000, pp. 383-386. [9] M. P. Hadid and B. Martinkauppi, “Color-Based Face Detection Using Skin Locus Model and Hierarchical Fil- tering,” 16th International Conference on Pattern Recog- nition Proceedings, Vol. 4, 2002, pp. 196-200. [10] C. Y. Chang, C. W. Chang and J. S. Li, “Multi-View Facial Feature Extraction,” Information—An International Interdisciplinary Journal, Vol. 16, 2013, pp. 191-204. [11] C. Y. Chang, Y. C. Huang and P. C. Chung, “Personal- ized Facial Expression Recognition for Indoor Space,” Proceeding of 22nd Conference on Computer Vision, Graphics and Image Processing Conference, Nan-Tou, 23- 25 August 2009. [12] S. E. Umbaugh, R. H. Moss and W. V. Stoecker, “Auto- matic Color Segmentation of Images with Application to Detection of Variegated Coloring in Skin Tumors,” IEEE Engineering in Medicine and Biology Magazine, Vol. 8, No. 4, 1989, pp. 43-50. doi:10.1109/51.45955 [13] R. M. Haralick, “Statistical and Structural Approaches to Texture,” Proceedings of IEEE, Vol. 67, No. 5, 1979, pp. 786-804. doi:10.1109/PROC.1979.11328 [14] Y. Chang, S. J. Chen and M. F. Tsai, “Application of Support-Vector-Machine-Based Method for Feature Se- lection and Classification of Thyroid Nodules in Ultra- sound Images,” Pattern Recognition, Vol. 43, No. 10, 2010, pp. 3494-3506. doi:10.1016/j.patcog.2010.04.023 [15] Guyon, “Feature Extraction: Foundations and Applications,” Springer, Berlin, 2006. [16] C. C. Chang and C. J. Lin, “LIBSVM: A Library for Sup- port Vector Machines,” 2001. http://www.csie.ntu.edu.tw/~cjlin/libsvm
|