Paper Menu >>
Journal Menu >>
 Vol.2, No.9, 1097-1100 (2010) Health doi:10.4236/health.2010.29162 Copyright © 2010 SciRes. Openly accessible at http://www.scirp.org/journal/HEALTH/ Quantitative assessment of heavy metals in some tea marketed in Nigeria ——Bioaccumulation of heavy metals in tea Albert Cosmas Achudume, Dayo Owoeye Institute of Ecology and Environmental Studies, Obafemi Awolowo University, Ile-Ife, Nigeria; *Corresponding Author: aachudum@yahoo.com Received 12 March 2010; revised 18 May 2010; accepted 4 June 2010. ABSTRACT Bioaccumulation of heavy metals in tea mar- keted in Nigeria was investigated. Four major and most consumed brand of tea were selected for the present study. Both aqueous and dry methods were used. Total contents of metal were determined by digesting 1g of each brand using a mixture (3:1) concentrated nitric acid (NNO3) and hypochlorous acid (HCLO4). The second method involved hot water extract of tea samples. After boiling and filtration, the residue was evaporated to near dryness and digested with concentrated HNO3 and HCLO4 as de- scribed above. Results indicate that Zn, Cd, Cu, and Pb were present in lowest concentrations in ascending order for which there were two sig- nificant differences between the four sources of samples. The general characteristics of heavy metal concentrations in aqueous extract showed high level of Fe and Mg in a descending order. Going by the correlation study of our result in- dicates that there is no significant relationship between the two elements of Fe and Mg, though, the numerical values of the two elements varied widely among the samples. These differences may have major impact on human health. How- ever, the beneficial effects of tea are in a fairly narrow concentration range between the essen- tial and the toxic level. In conclusion, the varia- tions in heavy metals content of tea brands may be due to geographical, seasonal changes and the chemical characteristics of the growing re- gions. Keywords: Bioaccumulation; Tea; Heavy Metals; Human Health; Toxic Level 1. INTRODUCTION Exposure to various metal containing components of tea varied widely and may have varying health implications [1]. Depending on the origin of tea leaves, heavy metals accumulation can be derived naturally by soil contami- nation, use of pesticides and fertilizers [2]. Some trace metals Cr, Fe, Co, Ni, and Zn are essential for growth of organisms, while other heavy metals Pb, Cd, Hg and As are not only biologically non essential, but toxic [3]. A very important biological property of metals is their tendency to bioaccumulations. Bioaccumulation is there- fore essential in hazard evaluation strategies. For exam- ple, calculation of percent available of Aluminum (Al) and Zinc (Zn) in tea consumed by human showed that tea can provide 37.2% of the daily dietary intake of Al, the percent available for absorption in the intestine is only 1.78% for overall mean concentration [4]. Similarly, daily dietary intake of Zn was 2.13% while percentage available for absorption in the intestine was 0.72% [5]. Thus chronic metal toxicity may often characterized by tissue/organ damage resulting in mortalities which are related to secondary physiological disturbances [5,6]. The extent of physiological disturbances depends upon uptake and bioaccumulation of metals [3,7]. Considering that an estimated amount of 18 billion teacups are consumed daily in the world [1,8,9] its eco- nomic and social importance are unprecedented. In Ni- geria, people drink tea by the bowl because of its thera- peutic value. It is valuable in the treatment and preven- tion of many diseases [8]. The presence of heavy metals in tea has become world-wide study. For example, the concentrations of Fe and Cu in Poland [10], Cu in India and US [9], Se in Pakistan [11], As in Iran [2,12], Al in China [13] and in Lithuania [14] have recently become the subject of wide spread concern, since beyond the tolerable limits they become toxic [15,16]. Determination of harmful and toxic heavy metals in different tea marketed in Nigeria  A. C. Achudume et al. / HEALTH 2 (2010) 1097-1100 Copyright © 2010 SciRes. Openly accessible at http://www.scirp.org/journal/HEALTH/ 1098 gives direct information on the significance of these elements in tea beverages. Lack of basal data on the contents of heavy metals in tea and the regulated on the maximum allowable and safe concentration of metal in tea are needed. This predicated the present study to de- termine the quantitative assessment of heavy metal con- taminants in some popular tea marketed in Nigeria. 2. MATERIALS AND METHODS Several samples of tea leaves which are commonly con- sumed in Nigeria were procured from provisional stores. Accordingly each sample tea was coded to conceal the original source. The code is tagged by a letter designat- ing the type of tea, that is black tea-Lip; green tea-Gin; white tea-Tia and Top. Three replicate samples of each tea were quantified using two different standard methods of [11,17]. Total contents of metals were determined by having a portion of one g of sample tea digested in 12 mL of a mixture (3:1 v/v) concentrated HNO3 and HCLO4. The mixture was heated until the solution turned white. The digested sample was filtered and transferred to a 100ml flask and the volume was adjusted to the mark with 5% HNO3 acid. This digestion procedure was validated by using the reference certified material of National Agency for Food and Drug Administration and Control (NAF- DAC) [18]. Hot water extract of metals were determined by hav- ing a portion of one g of each brand boiled in 50 ml of distilled water for 10min in a porcelain cup and filtered. The residue was evaporated to near dryness and digested with concentrated HNO3 as described earlier. The final volume of the solution was made up to 100 ml. Follow- ing digestion, ten drops of H2O2 were added and centri- fuged. The acid digested sediments were filtered and capped. A Perkin Elmer Analyst 300 flame atomic absorption spectrometer (AAS) (Central Science laboratory, Obafemi Awolowo University, Ile-Ife) was used to quantify the heavy metal concentrations [19]. Calibration standard curves provided the basis for quantifying metal contents for both sediments and plant tissues after the initial ash- ing digestion. Correlation coefficients for metals in plant tissues and sediments were found to be 99.59% and 99.54% respectively. Calibration curves, developed us- ing standards, provided the basis for quantifying metals concentrations for analysis of plants tissues and sedi- ments using both the dry and wet analysis techniques. The data were statistically analyzed and the least sig- nificant differences (SD) at the 5% level used to separate means. The relationship between the different variables was elevated by a simple correlation and regression ana- lysis [20]. 3. RESULTS AND DISCUSSION Results of the present study show the actual concentra- tion of heavy metals in tea samples after digestion (Ta- ble 1). The metals present in lowest concentration (< 1.00 mg/kg) were Zn, Cd, Cu, and Pb in ascending order respectively, for which there were two significant dif- ferences between the four sources of samples. The sources differ with regard to Se and Fe contents, but similar with respect to Cu, Pb, and Zn and more substan- tially with respect to Fe and Mg with total metal content in Gin samples about double the other samples. Table 2 shows the general characteristics of metal concentrations transferred to hot water extracts from brand of teas. The metals present in greatest concentra- tion were Fe (442-1344 mg/kg), followed closely by Mg (123-239 mg/kg) and highly toxic element Cu (2-7 mg/kg). Except for Pb, all these metals are release very slowly from tea leaves because they are complexed by porphyrins [21]. The mean SD values of all determined heavy metals for the group of tea are indicated in the Tables. Going by the performed t-test the concentrations of heavy metals were not significantly different (P > 0.05). The numerical values of heavy metals concentra- tions of Fe and Mg contents varied widely among the samples. From the regression plot, it can be inferred that since the significant value is 0.414 which is far higher than 0.05 and the R and R square values are 0.586 and 0.344 respectively, that there is no significant relation- ship between the two elements (Figure 1). According to correlation study between heavy metals Fe-Mg, and Cd- Cu showed no significant relationship in all the tea sam- ples, otherwise, the differences can have major impact on staying healthy. The excessive heat in tea boiling for example can alter the natural chemical nature of these metals. The result of total contents of the studied heavy met- als (As, Se, Zn, Fe, Mg, Cd,, Cu, Pb ) in these teas com- pared to tea grown in other countries showed accumula- tion of different heavy metals, for example, studies have shown that Cu in Iranian, Lithuanian and Chinese tea [12-14] respectively, K in Pakistanis [1] and Pb in Tuni- sian tea [22] bioaccumulations. It goes to show the abil- ity of these plants in accumulating metals. Other studies showed accumulation of Al [23] and Fe [10] in tea leaves. However, in the present study, Fe and Mg com- plexes are higher than other metals in tea marketed in Nigeria and may be due to high metal levels in the geo- graphical locations and more to preferential absorption of these metals. The percent solubility of Fe and Mg revealed these are in form of least water soluble com- plexes. From all indications, differentiation of metal contents 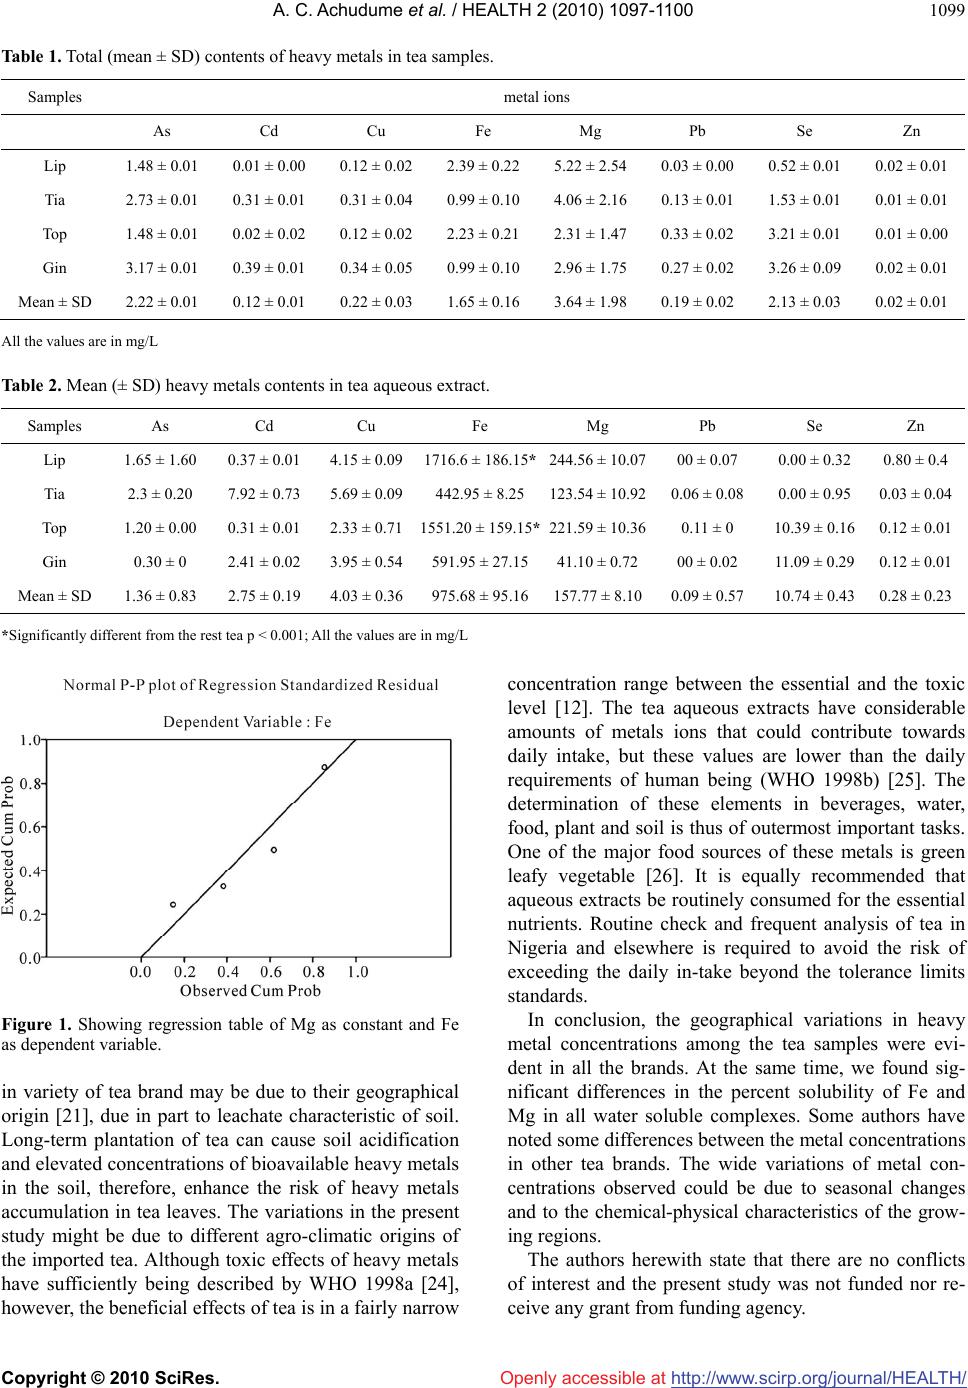 A. C. Achudume et al. / HEALTH 2 (2010) 1097-1100 Copyright © 2010 SciRes. Openly accessible at http://www.scirp.org/journal/HEALTH/ 1099 Table 1. Total (mean ± SD) contents of heavy metals in tea samples. Samples metal ions As Cd Cu Fe Mg Pb Se Zn Lip 1.48 ± 0.01 0.01 ± 0.00 0.12 ± 0.02 2.39 ± 0.22 5.22 ± 2.54 0.03 ± 0.00 0.52 ± 0.01 0.02 ± 0.01 Tia 2.73 ± 0.01 0.31 ± 0.01 0.31 ± 0.04 0.99 ± 0.10 4.06 ± 2.16 0.13 ± 0.01 1.53 ± 0.01 0.01 ± 0.01 Top 1.48 ± 0.01 0.02 ± 0.02 0.12 ± 0.02 2.23 ± 0.21 2.31 ± 1.47 0.33 ± 0.02 3.21 ± 0.01 0.01 ± 0.00 Gin 3.17 ± 0.01 0.39 ± 0.01 0.34 ± 0.05 0.99 ± 0.10 2.96 ± 1.75 0.27 ± 0.02 3.26 ± 0.09 0.02 ± 0.01 Mean ± SD 2.22 ± 0.01 0.12 ± 0.01 0.22 ± 0.03 1.65 ± 0.16 3.64 ± 1.98 0.19 ± 0.02 2.13 ± 0.03 0.02 ± 0.01 All the values are in mg/L Table 2. Mean (± SD) heavy metals contents in tea aqueous extract. Samples As Cd Cu Fe Mg Pb Se Zn Lip 1.65 ± 1.60 0.37 ± 0.01 4.15 ± 0.091716.6 ± 186.15*244.56 ± 10.0700 ± 0.07 0.00 ± 0.32 0.80 ± 0.4 Tia 2.3 ± 0.20 7.92 ± 0.73 5.69 ± 0.09442.95 ± 8.25 123.54 ± 10.920.06 ± 0.08 0.00 ± 0.95 0.03 ± 0.04 Top 1.20 ± 0.00 0.31 ± 0.01 2.33 ± 0.711551.20 ± 159.15*221.59 ± 10.360.11 ± 0 10.39 ± 0.16 0.12 ± 0.01 Gin 0.30 ± 0 2.41 ± 0.02 3.95 ± 0.54591.95 ± 27.1541.10 ± 0.7200 ± 0.02 11.09 ± 0.29 0.12 ± 0.01 Mean ± SD 1.36 ± 0.83 2.75 ± 0.19 4.03 ± 0.36975.68 ± 95.16157.77 ± 8.100.09 ± 0.57 10.74 ± 0.43 0.28 ± 0.23 *Significantly different from the rest tea p < 0.001; All the values are in mg/L Figure 1. Showing regression table of Mg as constant and Fe as dependent variable. in variety of tea brand may be due to their geographical origin [21], due in part to leachate characteristic of soil. Long-term plantation of tea can cause soil acidification and elevated concentrations of bioavailable heavy metals in the soil, therefore, enhance the risk of heavy metals accumulation in tea leaves. The variations in the present study might be due to different agro-climatic origins of the imported tea. Although toxic effects of heavy metals have sufficiently being described by WHO 1998a [24], however, the beneficial effects of tea is in a fairly narrow concentration range between the essential and the toxic level [12]. The tea aqueous extracts have considerable amounts of metals ions that could contribute towards daily intake, but these values are lower than the daily requirements of human being (WHO 1998b) [25]. The determination of these elements in beverages, water, food, plant and soil is thus of outermost important tasks. One of the major food sources of these metals is green leafy vegetable [26]. It is equally recommended that aqueous extracts be routinely consumed for the essential nutrients. Routine check and frequent analysis of tea in Nigeria and elsewhere is required to avoid the risk of exceeding the daily in-take beyond the tolerance limits standards. In conclusion, the geographical variations in heavy metal concentrations among the tea samples were evi- dent in all the brands. At the same time, we found sig- nificant differences in the percent solubility of Fe and Mg in all water soluble complexes. Some authors have noted some differences between the metal concentrations in other tea brands. The wide variations of metal con- centrations observed could be due to seasonal changes and to the chemical-physical characteristics of the grow- ing regions. The authors herewith state that there are no conflicts of interest and the present study was not funded nor re- ceive any grant from funding agency. 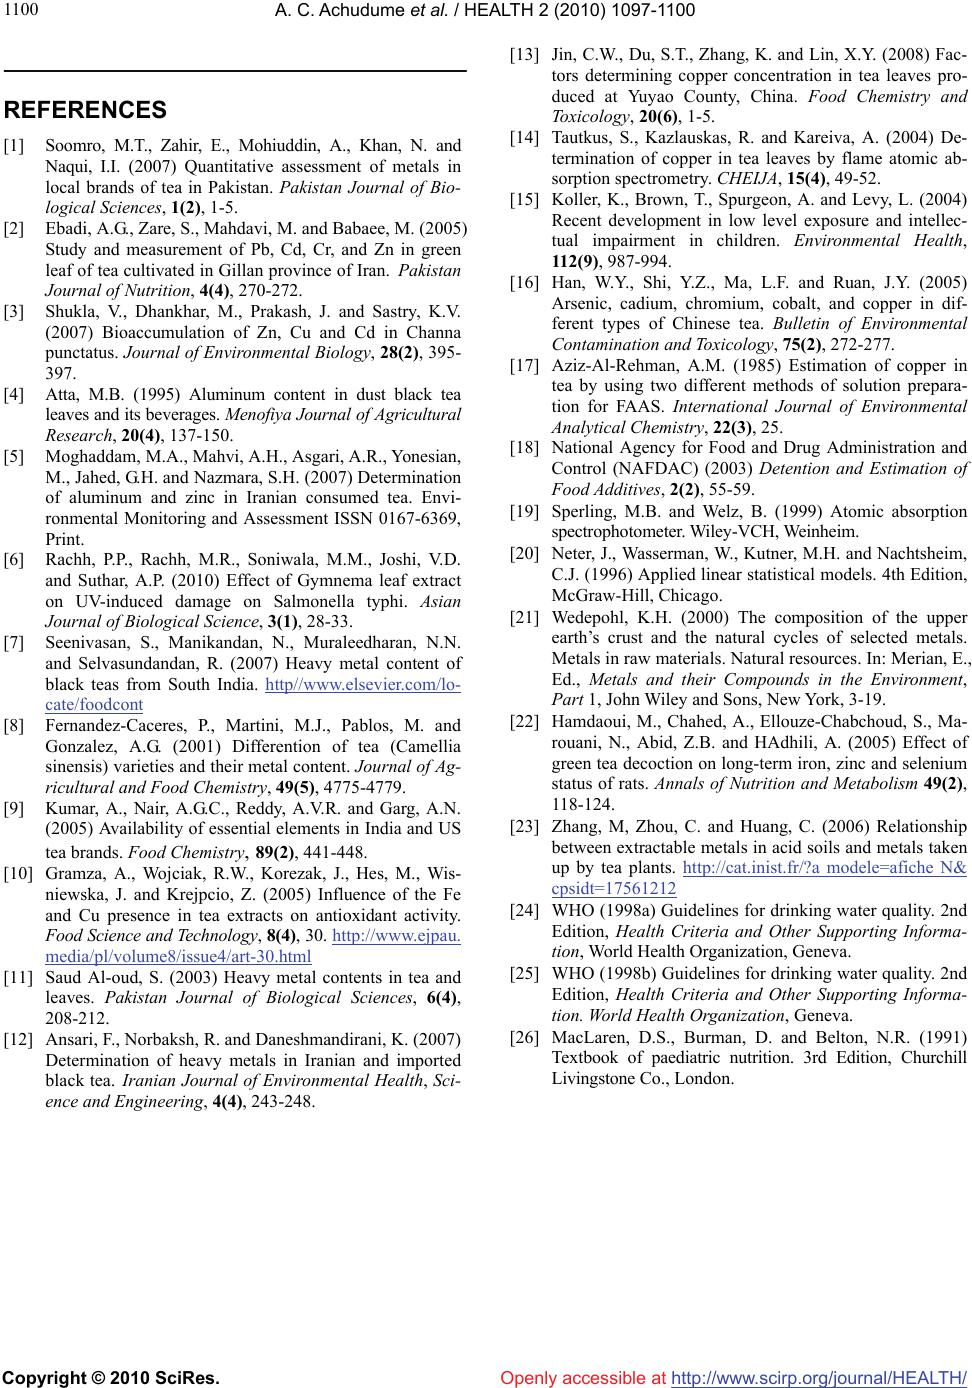 A. C. Achudume et al. / HEALTH 2 (2010) 1097-1100 Copyright © 2010 SciRes. Openly accessible at http://www.scirp.org/journal/HEALTH/ 1100 REFERENCES [1] Soomro, M.T., Zahir, E., Mohiuddin, A., Khan, N. and Naqui, I.I. (2007) Quantitative assessment of metals in local brands of tea in Pakistan. Pakistan Journal of Bio- logical Sciences, 1(2), 1-5. [2] Ebadi, A.G., Zare, S., Mahdavi, M. and Babaee, M. (2005) Study and measurement of Pb, Cd, Cr, and Zn in green leaf of tea cultivated in Gillan province of Iran. Pakistan Journal of Nutrition, 4(4), 270-272. [3] Shukla, V., Dhankhar, M., Prakash, J. and Sastry, K.V. (2007) Bioaccumulation of Zn, Cu and Cd in Channa punctatus. Journal of Environmental Biology, 28(2), 395- 397. [4] Atta, M.B. (1995) Aluminum content in dust black tea leaves and its beverages. Menofiya Journal of Agricultural Research, 20(4), 137-150. [5] Moghaddam, M.A., Mahvi, A.H., Asgari, A.R., Yonesian, M., Jahed, G.H. and Nazmara, S.H. (2007) Determination of aluminum and zinc in Iranian consumed tea. Envi- ronmental Monitoring and Assessment ISSN 0167-6369, Print. [6] Rachh, P.P., Rachh, M.R., Soniwala, M.M., Joshi, V.D. and Suthar, A.P. (2010) Effect of Gymnema leaf extract on UV-induced damage on Salmonella typhi. Asian Journal of Biological Science, 3(1), 28-33. [7] Seenivasan, S., Manikandan, N., Muraleedharan, N.N. and Selvasundandan, R. (2007) Heavy metal content of black teas from South India. http//www.elsevier.com/lo- cate/foodcont [8] Fernandez-Caceres, P., Martini, M.J., Pablos, M. and Gonzalez, A.G. (2001) Differention of tea (Camellia sinensis) varieties and their metal content. Journal of Ag- ricultural and Food Chemistry, 49(5), 4775-4779. [9] Kumar, A., Nair, A.G.C., Reddy, A.V.R. and Garg, A.N. (2005) Availability of essential elements in India and US tea brands. Food Chemistry, 89(2), 441-448. [10] Gramza, A., Wojciak, R.W., Korezak, J., Hes, M., Wis- niewska, J. and Krejpcio, Z. (2005) Influence of the Fe and Cu presence in tea extracts on antioxidant activity. Food Science and Technology, 8(4), 30. http://www.ejpau. media/pl/volume8/issue4/art-30.html [11] Saud Al-oud, S. (2003) Heavy metal contents in tea and leaves. Pakistan Journal of Biological Sciences, 6(4), 208-212. [12] Ansari, F., Norbaksh, R. and Daneshmandirani, K. (2007) Determination of heavy metals in Iranian and imported black tea. Iranian Journal of Environmental Health, Sci- ence and Engineering, 4(4), 243-248. [13] Jin, C.W., Du, S.T., Zhang, K. and Lin, X.Y. (2008) Fac- tors determining copper concentration in tea leaves pro- duced at Yuyao County, China. Food Chemistry and Toxicology, 20(6), 1-5. [14] Tautkus, S., Kazlauskas, R. and Kareiva, A. (2004) De- termination of copper in tea leaves by flame atomic ab- sorption spectrometry. CHEIJA, 15(4), 49-52. [15] Koller, K., Brown, T., Spurgeon, A. and Levy, L. (2004) Recent development in low level exposure and intellec- tual impairment in children. Environmental Health, 112(9), 987-994. [16] Han, W.Y., Shi, Y.Z., Ma, L.F. and Ruan, J.Y. (2005) Arsenic, cadium, chromium, cobalt, and copper in dif- ferent types of Chinese tea. Bulletin of Environmental Contamination and Toxicology, 75(2), 272-277. [17] Aziz-Al-Rehman, A.M. (1985) Estimation of copper in tea by using two different methods of solution prepara- tion for FAAS. International Journal of Environmental Analytical Chemistry, 22(3), 25. [18] National Agency for Food and Drug Administration and Control (NAFDAC) (2003) Detention and Estimation of Food Additives, 2(2), 55-59. [19] Sperling, M.B. and Welz, B. (1999) Atomic absorption spectrophotometer. Wiley-VCH, Weinheim. [20] Neter, J., Wasserman, W., Kutner, M.H. and Nachtsheim, C.J. (1996) Applied linear statistical models. 4th Edition, McGraw-Hill, Chicago. [21] Wedepohl, K.H. (2000) The composition of the upper earth’s crust and the natural cycles of selected metals. Metals in raw materials. Natural resources. In: Merian, E., Ed., Metals and their Compounds in the Environment, Part 1, John Wiley and Sons, New York, 3-19. [22] Hamdaoui, M., Chahed, A., Ellouze-Chabchoud, S., Ma- rouani, N., Abid, Z.B. and HAdhili, A. (2005) Effect of green tea decoction on long-term iron, zinc and selenium status of rats. Annals of Nutrition and Metabolism 49(2), 118-124. [23] Zhang, M, Zhou, C. and Huang, C. (2006) Relationship between extractable metals in acid soils and metals taken up by tea plants. http://cat.inist.fr/?a modele=afiche N& cpsidt=17561212 [24] WHO (1998a) Guidelines for drinking water quality. 2nd Edition, Health Criteria and Other Supporting Informa- tion, World Health Organization, Geneva. [25] WHO (1998b) Guidelines for drinking water quality. 2nd Edition, Health Criteria and Other Supporting Informa- tion. World Health Organization, Geneva. [26] MacLaren, D.S., Burman, D. and Belton, N.R. (1991) Textbook of paediatric nutrition. 3rd Edition, Churchill Livingstone Co., London. |