Paper Menu >>
Journal Menu >>
 Thulium Doped Fiber Amplifier (TDFA) for S-band WDM Systems Fady I. El-Nahal Department of Electrical Engineering Islamic University of Gaza Gaza, Gaza Strip, Palestine fnahal@iugaza.edu.ps Abdel Hakeim. M. Husein Physics Department Al-Aqsa University Gaza, Gaza Strip, Palestine Hakeim00@yahoo.com Abstract— A comprehensive numerical model based on solving rate equations of a thulium-doped silica-based fiber amplifier is evaluated. The pump power and thulium-doped fiber (TDF) length for single-pass Thulium-Doped Fiber Amplifiers (TDFA) are theoretically optimized to achieve the optimum Gain and Noise Figure (NF) at the center of S-band region. The 1064 nm pump is used to provide both ground-state and excited state absorptions for amplification in the S-band region. The theoretical result is in agreement with the published experimental result. Keywords-component; Thulium-Doped Fiber Amplifiers, Rate Equations, Gain, Noise Figure I. 1. Introduction The increase demands on the capacity of WDM transmission system now require newly developed transmission windows beyond the amplification bandwidth supported by erbium-doped fiber amplifiers (EDFA’s). Thulium-doped fiber amplifier (TDFA) provides high-power optical amplification in the S+ (1450–1480 nm) and S-bands (1480–1530 nm) [1-3], hence the TDFA is expected to complement C- (1530–1560 nm) and L-band (1560–1580 nm) amplification based on EDFAs in high-capacity dense wavelength division multiplexed (DWDM) systems [4, 5]. The additional bandwidth, modularity, inherent higher pumping efficiency, and lower nonlinear signal degradation (compared with alternatives such as S-band Raman amplification [6,7] offered by TDFA enables applications such as coarse wavelength-division multiplexing (CWDM) and fiber to the home (FTTH). The TDFA length and Pump power are the important parameters that determine the achievable gain and NF in TDFA [8]. In this paper, we detail the observation and modeling of TDFA where TDFA gain and NF are optimized by solving the rate equations. 2. Configuration of the TDFA The basic architecture used to model TDFA in the WDM system consists of 16 input signals (channels), an ideal multiplexer, a pump laser , pump coupler, Thulium-doped fiber (TDF), Optical spectrum analyzer and dual port WDM analyzer. The input of the system is 16 equalized wavelength multiplexed signals (channels) in the wavelength region of 80 nm (1450 nm-1530 nm) with 5 nm channels spacing. The power of each channel is -20 dBm. The pumping at 1064 nm is used to excite the doped atoms to a higher energy level. The TDF used is a glass based one with thulium density of 15.6×10⁻²⁴ m2, core radius is 1.3μm, doping radius is 1.3 μm and Numerical aperture (NA) is 0.3. The simulation done with maximum number of iterations is 150 and relative error is 5×10⁻⁴. 3. Theory of the TDFA The rate equations describe the interaction between signal, pump, and ASE light in the TDFA. The rate equations are used to analyze theoretically the populations in the energy levels of Tm3+ ions under 1064 nm pump and signal power conditions. The absorption and stimulated emission cross sections define the absorption coefficient for pump light and gain coefficient for signal light [9]. The transition cross- sections of thulium are shown in Fig. 1 [8]. The transition cross-sections were calculated in fluoride based TDF [10]. The Judd–Ofelt analysis shows that the transition strengths obtained were consistent with those for silica. Figure 1. Absorption and emission cross-sections spectra of the fluoride- based TDFA. Open Journal of Applied Sciences Supplement:2012 world Congress on Engineering and Technology Cop y ri g ht © 2012 SciRes.5 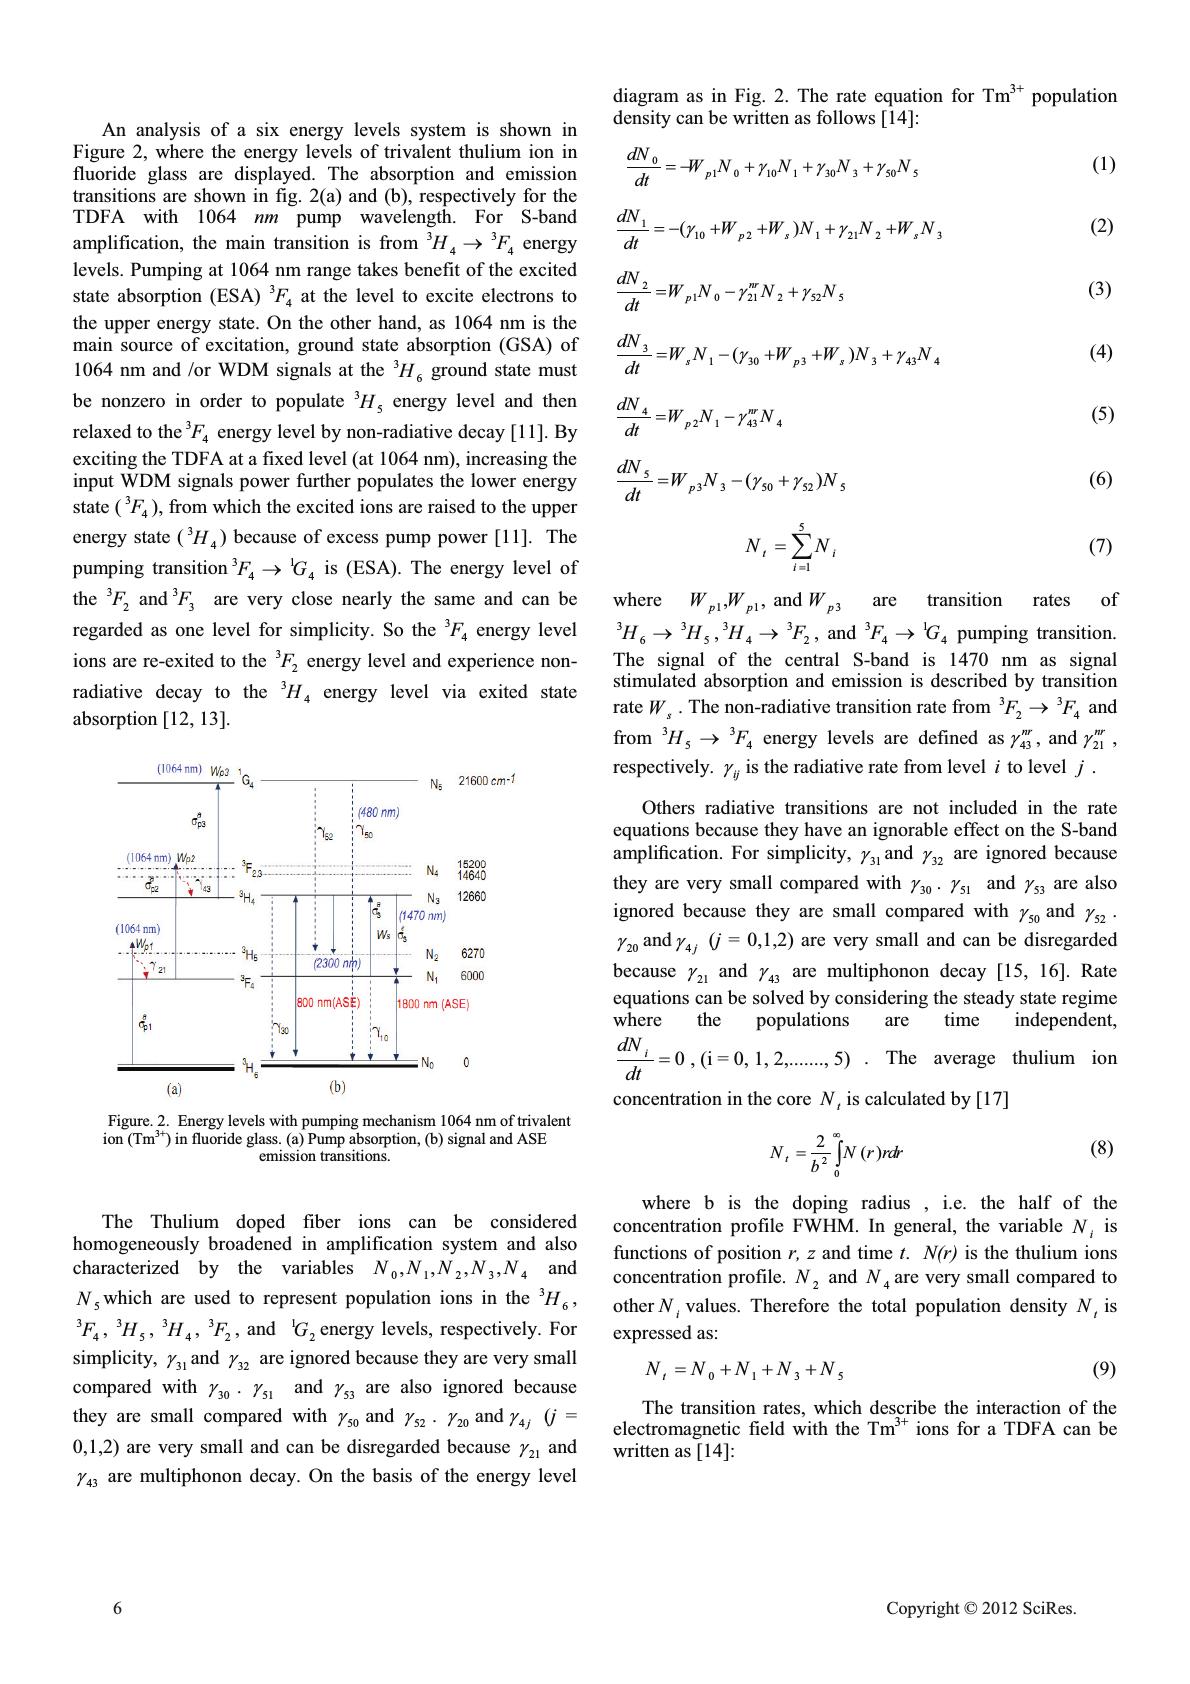 An analysis of a six energy levels system is shown in Figure 2, where the energy levels of trivalent thulium ion in fluoride glass are displayed. The absorption and emission transitions are shown in fig. 2(a) and (b), respectively for the TDFA with 1064 nm pump wavelength. For S-band amplification, the main transition is from 3 4 H o 3 4 F energy levels. Pumping at 1064 nm range takes benefit of the excited state absorption (ESA) 3 4 F at the level to excite electrons to the upper energy state. On the other hand, as 1064 nm is the main source of excitation, ground state absorption (GSA) of 1064 nm and /or WDM signals at the 3 6 H ground state must be nonzero in order to populate 3 5 H energy level and then relaxed to the 3 4 F energy level by non-radiative decay [11]. By exciting the TDFA at a fixed level (at 1064 nm), increasing the input WDM signals power further populates the lower energy state (3 4 F), from which the excited ions are raised to the upper energy state ( 3 4 H ) because of excess pump power [11]. The pumping transition 3 4 F o 1 4 G is (ESA). The energy level of the 3 2 F and3 3 F are very close nearly the same and can be regarded as one level for simplicity. So the 3 4 F energy level ions are re-exited to the 3 2 F energy level and experience non- radiative decay to the 3 4 H energy level via exited state absorption [12, 13]. Figure. 2. Energy levels with pumping mechanism 1064 nm of trivalent ion (Tm3+) in fluoride glass. (a) Pump absorption, (b) signal and ASE emission transitions. The Thulium doped fiber ions can be considered homogeneously broadened in amplification system and also characterized by the variables 01234 ,,,,NNNNN and 5 Nwhich are used to represent population ions in the 3 6 H , 3 4 F , 3 5 H , 3 4 H , 3 2 F , and 1 2 G energy levels, respectively. For simplicity, 31 J and 32 J are ignored because they are very small compared with 30 J . 51 J and 53 J are also ignored because they are small compared with 50 J and 52 J . 20 J and 4 J j (j = 0,1,2) are very small and can be disregarded because 21 J and 43 J are multiphonon decay. On the basis of the energy level diagram as in Fig. 2. The rate equation for Tm3+ population density can be written as follows [14]: 0 1010130 350 5 JJJ p dN WNN NN dt (1) 1 102121 23 () JJ ps s dN WWN NWN dt (2) 2 1021 2525 JJ nr p dN WNN N dt (3) 3 130 33434 () JJ sps dN WNWW NN dt (4) 4 2143 4 J nr p dN WN N dt (5) 5 3 350525 () JJ p dN WN N dt (6) 5 1 ¦ ti i NN (7) where 11 3 ,, and pp p WW W are transition rates of 3 6 H o 3 5 H, 3 4 H o 3 2 F, and 3 4 F o 1 4 G pumping transition. The signal of the central S-band is 1470 nm as signal stimulated absorption and emission is described by transition rate s W. The non-radiative transition rate from 3 2 F o 3 4 F and from 3 5 H o 3 4 F energy levels are defined as 43 21 , and JJ nr nr , respectively. ij J is the radiative rate from level i to level j . Others radiative transitions are not included in the rate equations because they have an ignorable effect on the S-band ampliation. For simplicity, 31 J and 32 J are ignored because they are very small compared with 30 J . 51 J and 53 J are also ignored because they are small compared with 50 J and 52 J . 20 J and 4j J (j = 0,1,2) are very small and can be disregarded because 21 J and 43 J are multiphonon decay [15, 16]. Rate equations can be solved by considering the steady state regime where the populations are time independent, 0 , (i = 0, 1, 2,......., 5) i dN dt . The average thulium ion concentration in the core t Nis calculated by [17] 2 0 2() t NNrrdr b f ³ (8) where b is the doping radius , i.e. the half of the concentration profile FWHM. In general, the variable i N is functions of position r, z and time t. N(r) is the thulium ions concentration profile. 2 N and 4 N are very small compared to other i Nvalues. Therefore the total population density t Nis expressed as: 0135t NNNNN (9) The transition rates, which describe the interaction of the electromagnetic field with the Tm3+ ions for a TDFA can be written as [14]: 6 Cop y ri g ht © 2012 SciRes. 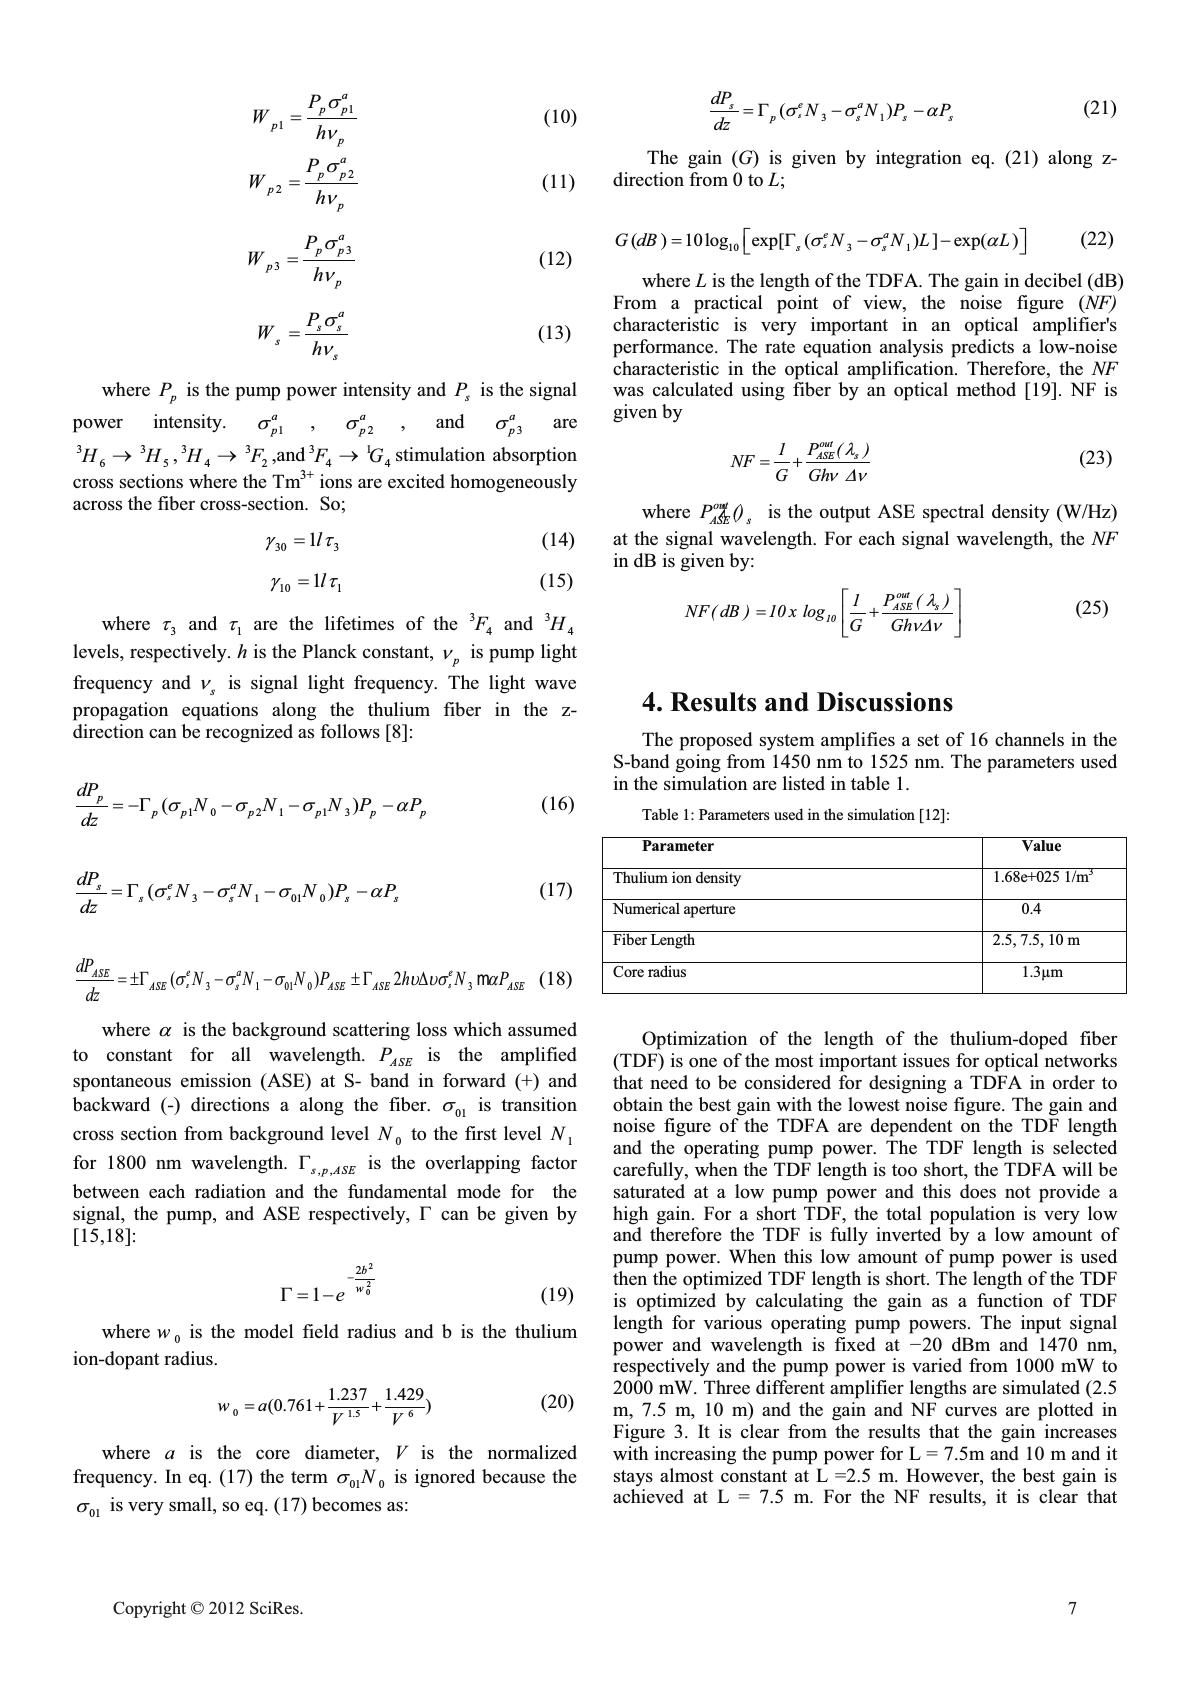 1 1 a pp p p P Wh V Q (10) 2 2 a pp p p P Wh V Q (11) 3 3 a pp p p P Wh V Q (12) a ss s s P Wh V Q (13) where p P is the pump power intensity and s P is the signal power intensity. 1 a p V , 2 a p V , and 3 a p V are 3 6 H o 3 5 H , 3 4 H o 3 2 F ,and 3 4 F o 1 4 Gstimulation absorption cross sections where the Tm3+ ions are excited homogeneously across the fiber cross-section. So; 30 3 1 l JW (14) 10 1 1l JW (15) where 3 W and 1 W are the lifetimes of the 3 4 F and 3 4 H levels, respectively. h is the Planck constant, p Q is pump light frequency and s Q is signal light frequency. The light wave propagation equations along the thulium fiber in the z- direction can be recognized as follows [8]: 1021 13 () p ppppp p dP NNNPP dz VVV D * (16) 31010 () s ea s ss ss dP NNNPP dz VVVD * (17) 31010 3 ()2 s s ea e ASE ASEsASE ASEASE dP NNNPhNP dz VVVXXVD r*r*'m (18) where D is the background scattering loss which assumed to constant for all wavelength. ASE Pis the amplified spontaneous emission (ASE) at S- band in forward (+) and backward (-) directions a along the fiber. 01 V is transition cross section from background level 0 N to the first level 1 N for 1800 nm wavelength. ,,spASE * is the overlapping factor between each radiation and the fundamental mode for the signal, the pump, and ASE respectively, * can be given by [15,18]: 2 2 0 2 1 b w e * (19) where 0 w is the model field radius and b is the thulium ion-dopant radius. 01.5 6 1.237 1.429 (0.761 )wa VV (20) where a is the core diameter, V is the normalized frequency. In eq. (17) the term 01 0 N V is ignored because the 01 V is very small, so eq. (17) becomes as: 31 () s ea s psss dP NNPP dz VV D * (21) The gain (G) is given by integration eq. (21) along z- direction from 0 to L; 103 1 ()10logexp[() ]exp() s ea ss GdBNN LL VV D ªº * ¬¼ (22) where L is the length of the TDFA. The gain in decibel (dB) From a practical point of view, the noise figure (NF) characteristic is very important in an optical amplifier's performance. The rate equation analysis predicts a low-noise characteristic in the optical amplification. Therefore, the NF was calculated using fiber by an optical method [19]. NF is given by out ASE s P( ) 1 NF GGh O Q'Q (23) where out ASE s P(Ȝ is the output ASE spectral density (W/Hz) at the signal wavelength. For each signal wavelength, the NF in dB is given by: out ASE s 10 P() 1 NF(dB)10xlogGGh O Q'Q ªº «» ¬¼ (25) 4. Results and Discussions The proposed system amplifies a set of 16 channels in the S-band going from 1450 nm to 1525 nm. The parameters used in the simulation are listed in table 1. Table 1: Parameters used in the simulation [12]: Parameter Value Thulium ion density 1.68e+025 1/m3 Numerical aperture 0.4 Fiber Length 2.5, 7.5, 10 m Core radius 1.3µm Optimization of the length of the thulium-doped fiber (TDF) is one of the most important issues for optical networks that need to be considered for designing a TDFA in order to obtain the best gain with the lowest noise figure. The gain and noise figure of the TDFA are dependent on the TDF length and the operating pump power. The TDF length is selected carefully, when the TDF length is too short, the TDFA will be saturated at a low pump power and this does not provide a high gain. For a short TDF, the total population is very low and therefore the TDF is fully inverted by a low amount of pump power. When this low amount of pump power is used then the optimized TDF length is short. The length of the TDF is optimized by calculating the gain as a function of TDF length for various operating pump powers. The input signal power and wavelength is fixed at í20 dBm and 1470 nm, respectively and the pump power is varied from 1000 mW to 2000 mW. Three different amplifier lengths are simulated (2.5 m, 7.5 m, 10 m) and the gain and NF curves are plotted in Figure 3. It is clear from the results that the gain increases with increasing the pump power for L = 7.5m and 10 m and it stays almost constant at L =2.5 m. However, the best gain is achieved at L = 7.5 m. For the NF results, it is clear that Cop y ri g ht © 2012 SciRes.7 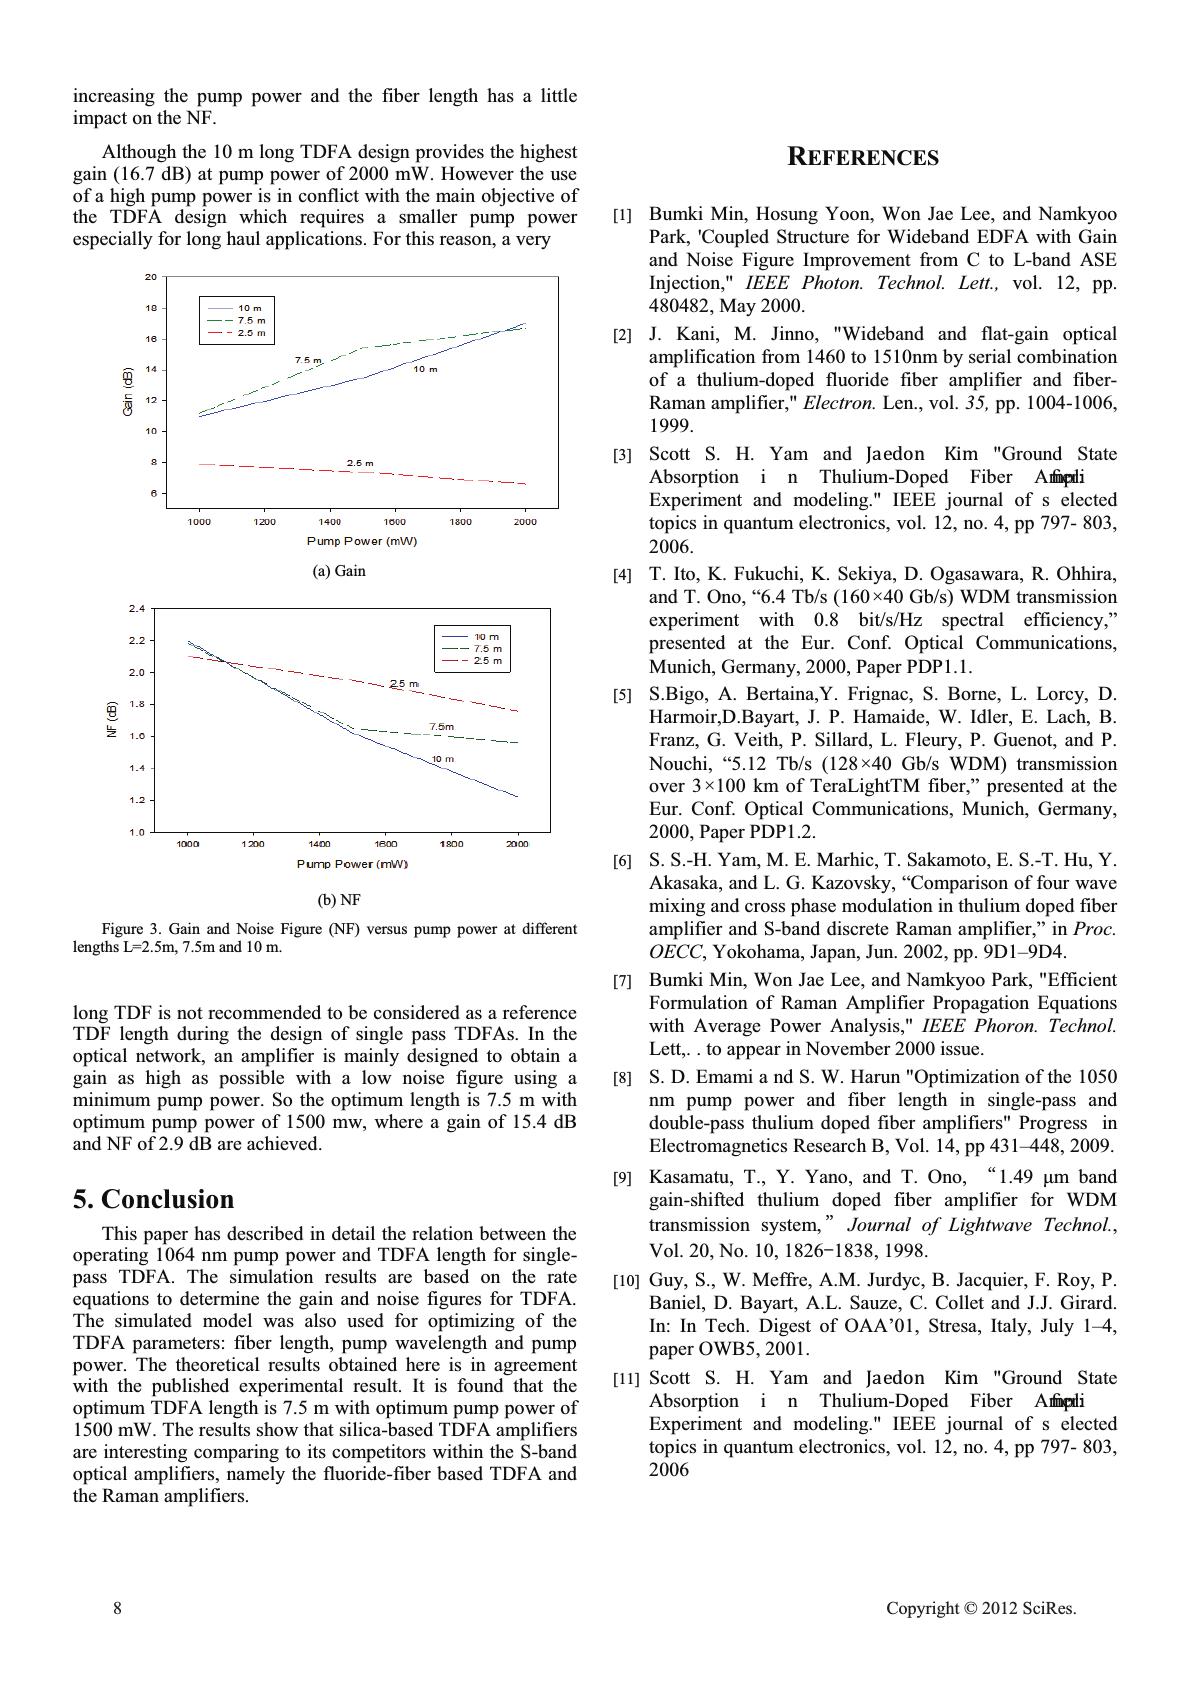 increasing the pump power and the fiber length has a little impact on the NF. Although the 10 m long TDFA design provides the highest gain (16.7 dB) at pump power of 2000 mW. However the use of a high pump power is in conflict with the main objective of the TDFA design which requires a smaller pump power especially for long haul applications. For this reason, a very (a) Gain (b) NF Figure 3. Gain and Noise Figure (NF) versus pump power at different lengths L=2.5m, 7.5m and 10 m. long TDF is not recommended to be considered as a reference TDF length during the design of single pass TDFAs. In the optical network, an amplifier is mainly designed to obtain a gain as high as possible with a low noise figure using a minimum pump power. So the optimum length is 7.5 m with optimum pump power of 1500 mw, where a gain of 15.4 dB and NF of 2.9 dB are achieved. 5. Conclusion This paper has described in detail the relation between the operating 1064 nm pump power and TDFA length for single- pass TDFA. The simulation results are based on the rate equations to determine the gain and noise figures for TDFA. The simulated model was also used for optimizing of the TDFA parameters: fiber length, pump wavelength and pump power. The theoretical results obtained here is in agreement with the published experimental result. It is found that the optimum TDFA length is 7.5 m with optimum pump power of 1500 mW. The results show that silica-based TDFA amplifiers are interesting comparing to its competitors within the S-band optical amplifiers, namely the fluoride-fiber based TDFA and the Raman amplifiers. REFERENCES [1] Bumki Min, Hosung Yoon, Won Jae Lee, and Namkyoo Park, 'Coupled Structure for Wideband EDFA with Gain and Noise Figure Improvement from C to L-band ASE Injection," IEEE Photon. Technol. Lett., vol. 12, pp. 480482, May 2000. [2] J. Kani, M. Jinno, "Wideband and flat-gain optical amplification from 1460 to 1510nm by serial combination of a thulium-doped fluoride fiber amplifier and fiber- Raman amplifier," Electron. Len., vol. 35, pp. 1004-1006, 1999. [3] Scott S. H. Yam and Jaedon Kim "Ground State Absorption i n Thulium-Doped Fiber Ampli Experiment and modeling." IEEE journal of s elected topics in quantum electronics, vol. 12, no. 4, pp 797- 803, 2006. [4] T. Ito, K. Fukuchi, K. Sekiya, D. Ogasawara, R. Ohhira, and T. Ono, “6.4 Tb/s (160×40 Gb/s) WDM transmission experiment with 0.8 bit/s/Hz spectral efficiency,” presented at the Eur. Conf. Optical Communications, Munich, Germany, 2000, Paper PDP1.1. [5] S.Bigo, A. Bertaina,Y. Frignac, S. Borne, L. Lorcy, D. Harmoir,D.Bayart, J. P. Hamaide, W. Idler, E. Lach, B. Franz, G. Veith, P. Sillard, L. Fleury, P. Guenot, and P. Nouchi, “5.12 Tb/s (128×40 Gb/s WDM) transmission over 3×100 km of TeraLightTM fiber,” presented at the Eur. Conf. Optical Communications, Munich, Germany, 2000, Paper PDP1.2. [6] S. S.-H. Yam, M. E. Marhic, T. Sakamoto, E. S.-T. Hu, Y. Akasaka, and L. G. Kazovsky, “Comparison of four wave mixing and cross phase modulation in thulium doped fiber amplifier and S-band discrete Raman amplifier,” in Proc. OECC, Yokohama, Japan, Jun. 2002, pp. 9D1–9D4. [7] Bumki Min, Won Jae Lee, and Namkyoo Park, "Efficient Formulation of Raman Amplifier Propagation Equations with Average Power Analysis," IEEE Phoron. Technol. Lett,. . to appear in November 2000 issue. [8] S. D. Emami a nd S. W. Harun "Optimization of the 1050 nm pump power and fiber length in single-pass and double-pass thulium doped fiber amplifiers" Progress in Electromagnetics Research B, Vol. 14, pp 431–448, 2009. [9] Kasamatu, T., Y. Yano, and T. Ono, ̌ gain-shifted thulium doped fiber amplifier for WDM transmission system,̍Journal of Lightwave Technol., Vol. 20, No. 10, 1826̄1838, 1998. [10] Guy, S., W. Meffre, A.M. Jurdyc, B. Jacquier, F. Roy, P. Baniel, D. Bayart, A.L. Sauze, C. Collet and J.J. Girard. In: In Tech. Digest of OAA’01, Stresa, Italy, July 1–4, paper OWB5, 2001. [11] Scott S. H. Yam and Jaedon Kim "Ground State Absorption i n Thulium-Doped Fiber Ampli Experiment and modeling." IEEE journal of s elected topics in quantum electronics, vol. 12, no. 4, pp 797- 803, 2006 8 Cop y ri g ht © 2012 SciRes.  [12] Peterka, P., B. Faure, W. Blance, and M. Karasek, “Theoretical modeling of S-band thulium doped silica ber ampli 36, pp 201–212, 2004. [13] Lee, W. J., B. Min, J. Park, and N. Park, “Study on the pumping wavelength dependency of S/S+-band based thulium doped Commu nication Conference and E xhi b i t , O FC 2001, -1–-4, 2001. [14] T. Komukai, T. Ya"oto, T. Sugawa, and Y. Miyajima, "Upconversion pumped thulium-doped fluoride fiber amplifier and laser operating at 1.47 µm," IEEE J. Quantum Electron., vol. 31, no. 11, pp. 1880-1889, 1995. [15] J. Sanz, R. Cases, and R. Alcala, “Optical properties of Tm3+ in fluorozirconate glass.” J. Nori-Cr\-sfaline Solids, vol. 93, pp. 377-386, 1987. [16] C. Guery. J. L. Adam, and J. Lucas, “Optical properties of Tm3+ ions in indium-based fluoride glasses,” J. Luminescence, vol. 42, pp. 181-189, 1988 [17] Desurvire, E., "Erbium-Doped Fiber Ampli Principles and Applications", John Wiley & Sons, New York, 1994. [18] Michael, J. and F. Digonnet, Rare-earth-doped Fiber Lasers and Amplifiers, CRC Press, 2001. [19] P. R. Morkel and R. 1. Laming, “Theoretical modeling of erbium-doped fiber amplifiers with excited-state absorption.” Opt. Lett., vol. 14, no. 19, pp. 1062-1064, 1989. Cop y ri g ht © 2012 SciRes.9 |