Paper Menu >>
Journal Menu >>
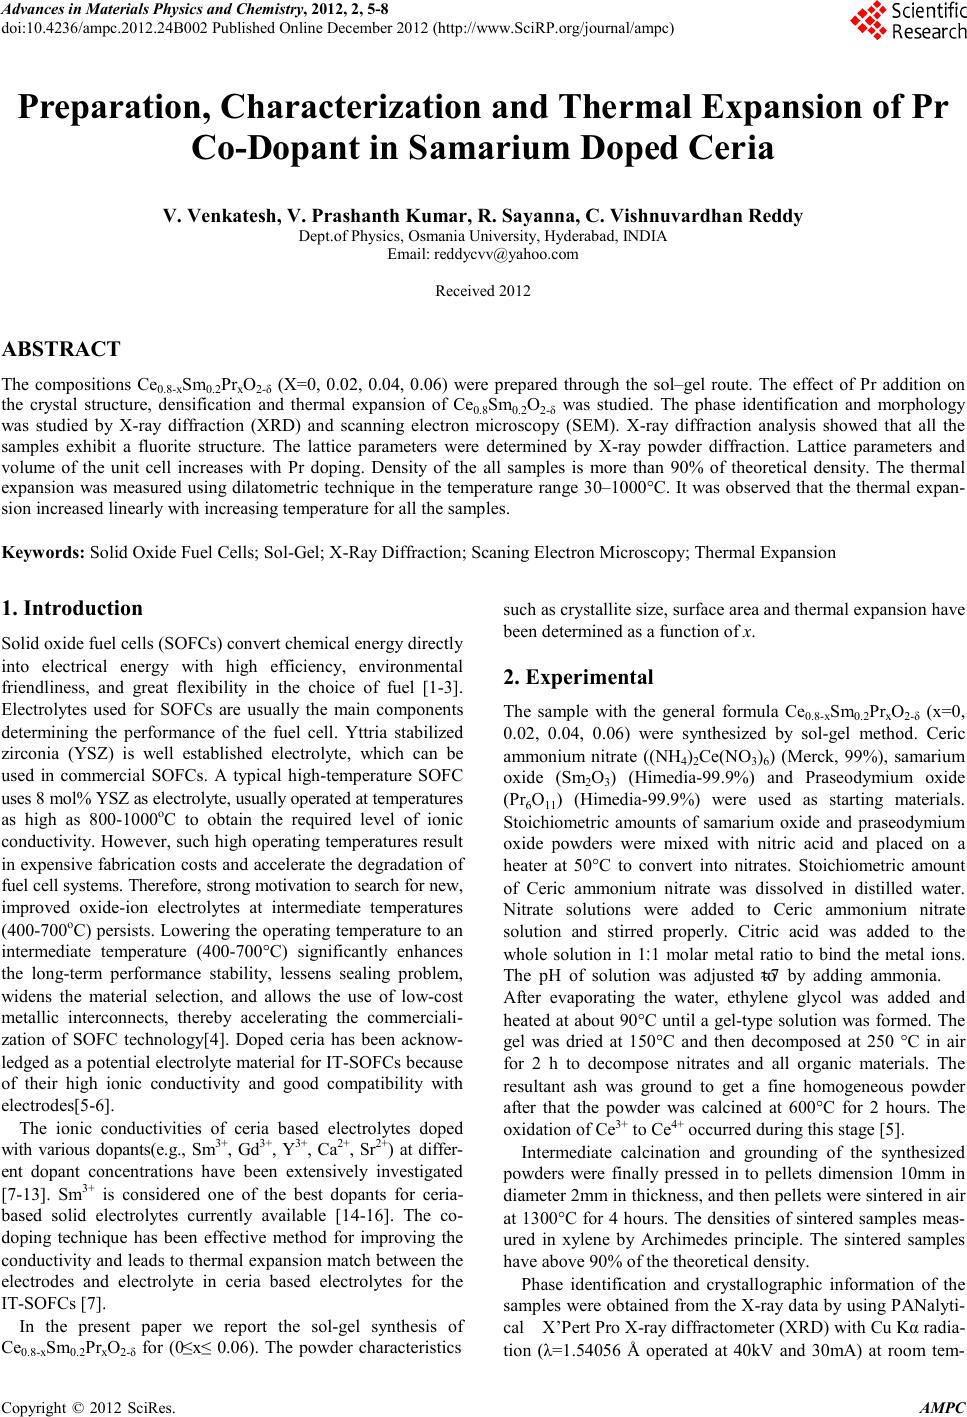 Advances in Ma terials Physics and Che mist ry, 2012, 2, 5-8 doi:10.4236/ampc.2012.24B002 Published Online December 2012 (htt p://www.SciRP.org/journal/ampc) Copyright © 2012 SciRes. AMPC Preparation, Characterization and Thermal Expansion of Pr Co-Dopant in Samarium Doped Ceri a V. Venkatesh, V. Prasha nth Kumar, R. Say anna, C. Vishnuvardhan Reddy Dept.of Physics, Osmania Un ivers it y, H yderabad, INDIA Email: reddycvv@yahoo.com Received 2012 ABSTRACT The compositions Ce0.8-xSm0.2PrxO2-δ (X=0, 0.02, 0.04, 0.06) were prepared through the sol–gel route. The effect of Pr addition on the crystal structure, densification and thermal expansion of Ce0.8Sm0.2O2-δ was studied. The phase identification and morphology was studied by X-ray diffraction (XRD) and scanning electron microscopy (SEM). X-ray diffraction analysis showed that all the samples exhibit a fluorite structure. The lattice parameters were determined by X-ray powder diffraction. Lattice parameters and volume of the unit cell increases with Pr doping. Density of the all samples is more than 90% of theoretical density. The thermal expansion was measured using dilatometric technique in the temperature range 30–1000°C. It was observed that the thermal expan- sion increased linearly with increas ing te mperature for all the s amples. Keywords: Solid Oxide Fuel Cells; Sol-Gel; X-Ray Diffraction; Scaning Electron Micro s copy; Thermal Expansion 1. Introduction Solid oxide fuel cells (SOFCs) convert ch emical energy directly into electrical energy with high efficiency, environmental friendliness, and great flexibility in the choice of fuel [1-3]. Electrolytes used for SOFCs are usually the main components determining the performance of the fuel cell. Yttria stabilized zirconia (YSZ) is well established electrolyte, which can be used in commercial SOFCs. A typical high-temperature SOFC uses 8 mol% YSZ as ele ctrolyte, usually operated at temperat ures as high as 800-1000oC to obtain the required level of ionic conductivity. However, such high operating temperat ures resul t in expen sive fabricatio n costs an d accelerate th e degradatio n of fuel cell systems. Therefore, strong motivation to search for new, improved oxide-ion electrolytes at intermediate temperatures (400-700oC) persists. Lowering the operating temperatu re to an intermediate temperature (400-700°C) significantly enhances the long-term performance stability, lessens sealing problem, widens the material selection, and allows the use of low-cost metallic interconnects, thereby accelerating the co mmer ciali- zation of SOFC technology[4]. Doped ceria has been acknow- ledged as a poten tial el ectrol yte material for IT-SOFCs b ecause of their high ionic conductivity and good compatibility with electrodes[5-6]. The ionic conductivities of ceria based electrolytes doped with various dopants(e.g., Sm3+, Gd3+, Y3+, Ca2+, Sr2+) at differ- ent dopant concentrations have been extensively investigated [7-13]. Sm3+ is considered one of the best dopants for ceria- based solid electrolytes currently available [14-16]. The co- doping technique has been effective method for improving the condu ctivity and lead s to thermal expansio n match between the electrodes and electrolyte in ceria based electrolytes for the IT-SOFCs [7] . In the present paper we report the sol-gel synthesis of Ce0.8-xSm0.2PrxO2-δ for (0≤x≤ 0.06). The powder characteristics such as cr ystallite s ize, sur fac e area and ther mal expansio n have been determined as a function of x. 2. Experimental The sample with the general formula Ce0.8-xSm0.2PrxO2-δ (x=0 , 0.02, 0.04, 0.06) were synthesized by sol-gel method. Ceric ammonium nitrate ((NH4)2Ce(NO3)6) (Merck, 99%), samarium oxide (Sm2O3) (Himedia-99.9%) and Praseodymium oxide (Pr6O11) (Himedia-99.9%) were used as starting materials. Stoichiometric amounts of samarium oxide and praseodymium oxide powders were mixed with nitric acid and placed on a heater at 50°C to convert into nitrates. Stoichiometric amount of Ceric ammonium nitrate was dissolved in distilled water. Nitrate solutions were added to Ceric ammonium nitrate solution and stirred properly. Citric acid was added to the whole solution in 1׃1 molar metal ratio to bind the metal ions. The pH of solution was adjusted to ≈7 by adding ammonia. After evaporating the water, ethylene glycol was added and heated at about 90°C until a gel-type solution was formed. The gel was dried at 150°C and then decomposed at 250 °C in air for 2 h to decompose nitrates and all organic materials. The resultant ash was ground to get a fine homogeneous powder after that the powder was calcined at 600°C for 2 hours. The oxidation of Ce3+ to Ce4+ occurred during this stage [5]. Intermediate calcination and grounding of the synthesized powders were finally pressed in to pellets dimension 10mm in diameter 2 mm in t hi ckness, and then pel lets were sin ter ed i n ai r at 1300°C for 4 hours. The densities of sintered samples meas- ured in xylene by Archimedes principle. The sintered samples have above 90% of the theoretical density. Phase identification and crystallographic information of the samples were obtained from the X-ray data by using P ANalyti- cal X ’Pert Pro X-ray diffractometer (XRD) with Cu Kα radia- tion (λ=1.54056 Å operated at 40kV and 30mA) at room tem- 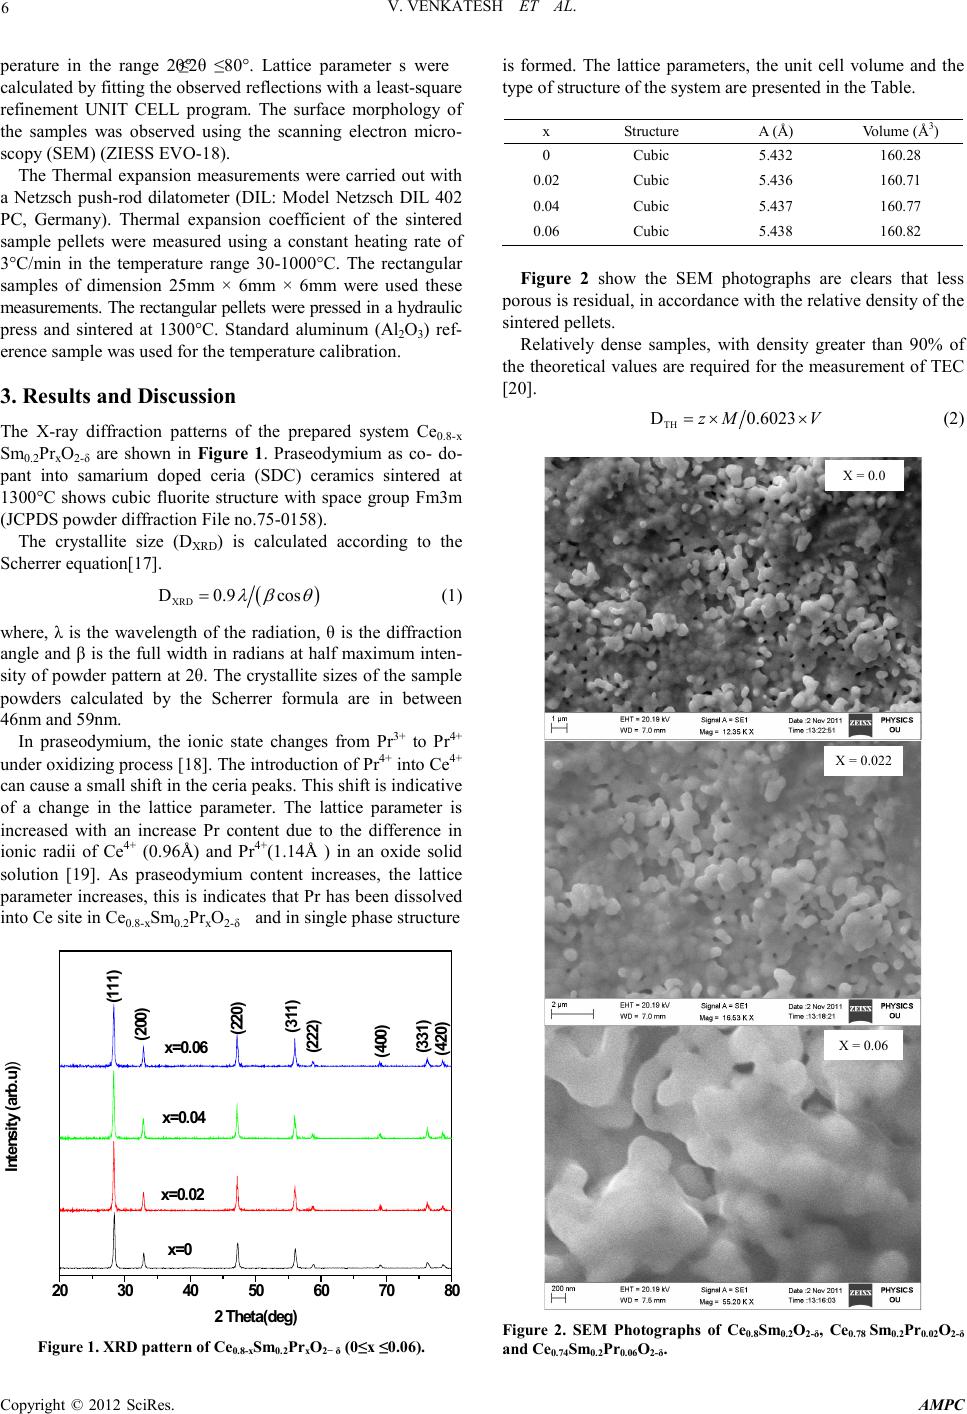 V. VENKATESH ET AL. Copyright © 2012 SciRes. AMPC 6 perature in the range 20°≤2θ ≤80°. Lattice parameter s were calculat ed b y fitti ng th e ob served r eflectio ns with a l east-square refinement UNIT CELL program. The surface morphology of the samples was observed using the scanning electron micro- scopy (SEM) (ZIESS EVO-18). The Thermal expansion measurements were carried out with a Netzsch push-rod dilatometer (DIL: Model Netzsch DIL 402 PC, Germany). Thermal expansion coefficient of the sintered sample pellets were measured using a constant heating rate of 3°C/min in the temperature range 30-1000°C. The rectangular samples of dimension 25mm × 6mm × 6mm were used these measu remen ts. Th e rectan gular p ell ets wer e pres sed in a hydraulic press and sintered at 1300°C. Standard aluminum (Al2O3) ref- erence sa mpl e was used fo r the temperat ure calibration. 3. Results and Discussion The X-ray diffraction patterns of the prepared system Ce0.8-x Sm0.2PrxO2-δ are shown in Figure 1. Praseodymium as co- do- pant into samarium doped ceria (SDC) ceramics sintered at 1300°C shows cubic fluorite structure with space group Fm3m (JCPDS powder dif frac ti on File n o. 7 5-0158). The crystallite size (DXRD) is calculated according to the Scherrer equat ion[17] . ( ) XRD D 0.9 cos λβ θ = (1) where, λ is the wavelength of the radiation, θ is the diffraction angle and β is the full width in radians at half maximum inten- sity of powder pattern at 2θ. The crystallite sizes of th e sample powders calculated by the Scherrer formula are in between 46nm and 59nm. In praseodymium, the ionic state changes from Pr3+ to Pr4+ under oxidizing process [18]. The introduction of Pr4+ in to Ce4+ can cause a small shift in the ceria peaks. This shift is indicative of a change in the lattice parameter. The lattice parameter is increased with an increase Pr content due to the difference in ionic radii of Ce4+ (0.96Å) and Pr4+(1.14Å ) in an oxide solid solution [19]. As praseodymium content increases, the lattice parameter i ncreases, this i s indicat es that Pr has been disso lved into Ce site in Ce0.8-xSm0.2PrxO2-δ and in si ng l e phase structure 20 30 40 50 60 70 80 (420) (331) (400) (222) (311) (220) (200) (111) x=0.06 x=0.04 x=0.02 x=0 Intensity (arb.u)) 2 Theta(de g) Figure 1. XRD pattern of Ce0.8 -xSm0.2PrxO2− δ (0≤x ≤0.06). is formed. The lattice parameters, the unit cell volume and the type of structure of the system are presented in the Table. x Structure A (Å) Volume (Å3) 0 Cubic 5.432 160.28 0.02 C ubic 5.436 160.71 0.04 C ubic 5.437 160.77 0.06 C ubic 5.438 160.82 Figure 2 show the SEM photographs are clears that less porous is res idual , in acco rd an ce with the r elati ve den sit y of the sintered pellets. Relatively dense samples, with density greater than 90% of the theo retical values are requ ired for the measurement o f TEC [20]. TH D 0.6023zM V=×× (2) X = 0.0 X = 0.022 X = 0.06 Figure 2. SEM Photographs of Ce0.8Sm0.2O2-δ, Ce0.78 Sm0.2Pr0.02 O2-δ and Ce0.74Sm0.2Pr0.06O2-δ.  V. VENKATESH ET AL. Copyright © 2012 SciRes. AMPC 7 Theoretical density can be calculated using by equation (2) where V (in Å3) is the volume of the unit cell as determined by XRD, M (in atomic mass uni ts) is th e mass of one formul a unit, z is the number of such formula units in one unit cell of the crystal. The possible departures from stoichiometry have not been taken into accou nt in calculating M. The bulk density (d), the theoretical density (dth), and d/dth (%) are summarized in Table 1. All samples have densities above 90% of the theoretical value. The thermal expansion coefficients of electrolyte and elec- trodes should match, to avoid micro-cracks in between th em for the operati0n of SOFC device at high temperatures. The ther- mal expansion data of Ce0.8-xSm0.2PrxO2-δ (x=0, 0.02, 0.04, 0.06) obtained in the temperature range 30- 1000°C in air is shown in Figure 3. The thermal expansion depends on the electrostatic forces within the lattice, which depends on the concentration of positive and negative charges and their distances within the lattice. The thermal expansion increases due to the decrease in attractive forces. Ther mal e xpan sio n of a latt ice i s char acterized by a steady thermal expansion coefficient (α), for a certain structure and fixed oxygen t o metal st oichio metry. The slope of thermal expansion curves for all the composition s are increased with temperature. The thermal expansion coefficients (TEC) are calculated from the thermal expansion curves and values are listed in Ta- ble 2. The results of the present study are in contrast with the reported values. [10, 12-13, 21 -24]. The disparity in the results may be due to preparation condition, non-stoichiometry of oxygen and oxidizing process of Pr. Table 1. Density measurements of Ce0.8-xSm0.2PrxO2-δ (0≤x ≤0.06). x Bulk Density (d) Theoretical Density (dth) d/dth% 0 6.769 7.216 93 0.02 6.934 7.197 96 0.04 6.725 7.195 93 0.06 6.818 7.192 94 200 400 600 8001000 0.0 0.2 0.4 0.6 0.8 1.0 1.2 1.4 (dL/L)% T emp erature (0C ) x=0 x=0.02 x=0.04 x=0.06 Figure 3. Temperature variation of thermal expansion of Ce0.8-x Sm0.2PrxO2 (0≤x≤0.06). Table 3. Thermal expansion co-efficient of Ce0.8-xSm0.2PrxO2-δ (0≤x ≤0.06). x TEC (10-6/oC) 30- 600oC 30- 800oC 30- 1000oC 0 11.51 12.25 12.32 0.02 11.17 12.36 12.66 0.04 12.03 13.31 13.78 0.06 11.52 13.18 13.02 4. Conclusions Praseodymium and samarium co-doped ceria samples Ce0.8−x Sm0.2PrxO2−δ (x=0.00, 0.02, 0.04 and 0.06) are successfully synthesized through the sol–gel method. Dense ceramics are obtained by sintering the pellets at 1300°C for 4 hours. The relative densities are over 90% of the theoretical density and these results are consistent with the SEM studies. The lattice parameter increased with increasing Pr content. Thermal ex- pansion increased linearly with increasing temperature for all the sa mples. Th e val ues o f t her mal expan sio n coeffici ent s of all the compositions are in the range of 12.25×10⁻⁶/°C to 13.31 × 10⁻⁶/°C. The present co-doped ceria materials can be used as possible electrolyte materi al for I T-SOFC applications. 5. Acknowledgements One of the author, V.Venkatesh, thanks to the University Grant Commission (UGC), New Delhi, India for the financial assis- tance u nder th e scheme of Resear ch Fello wships in Science for Meritorious Students (RFSMS). REFERENCES [1] Xingbao Zhu, Zhe Lu, Bo Wei, Yaohui Zhang, Xiqiang Huang, Wenhui Su, Int J Hydrogen Energy, vol.35, 2010, pp. 6897-904. [2] J. Nielsen, A Hagen, Y.L. Liu, Solid State Ionics, vol.181, 2010, pp. 517-24. [3] Yicheng Liou, Songling Yang, J Power Sources, vol.179, 2008, pp.553-9. [4] N.P. Brandon, S. Skinner, B.C.H. Steele, Annu. Rev. Mater. Res., vol. 33, 2003, pp. 183. [5] B.C.H. Steele, Solid State Ionics, vol.129, 2000, pp. 95-110. [6] C.M. Lapa, D.P.F. De Souza, F.M.L. Figueiredo, F.M.B. Marques. Int J Hydrogen Energy, vol.35, 2010, pp. 2737-41. [7] S.Omer, E.D.Wachsman, J.C.Nino, Solid State Ionics, vol.178,2008, pp. 1890-7. [8] S.Omer, E.D.Wachsman, J.C.Nino, Solid State Ionics, vol.177,2006, pp. 3199. [9] H.Inaba, H.Tagawa, Solid State Ionics, vol. 83, 1996, pp. 1. [10] N.Kim, BH.Kim, D.Lee, J.Power Sources, vol. 90, 2000, pp. 139. [11] S.Lubk e, H.D.Wiemhofer, Solid State Ionics , vol.117, 1999, pp. 229. [12] V.Prashanth Kumar, Y,S.Reddy, G.Prasad, P.Kistaiah, C.Vishnuvardhan Redyy, Mater.Chem.Phys, vol.112, 2008, pp. 711. [13] S.Ramesh, V.Prashanth Kumar, P.Kistaiah, C.Vishnuvadhan Redyy, Soli d State Ionics, vol. 181, 2010, pp. 86.  V. VENKATESH ET AL. Copyright © 2012 SciRes. AMPC 8 [14] Yifeng Zheng, Liqiang Wu, Haitao Gu, Ling Gao, Han Chen, Lucun Guo. J Alloys Com pd, vol.486, 2009, pp. 586-9. [15] Yifeng Zheng, Shoucheng He, Lin Ge, Ming Zhou, Han Chen, Lucun Guo, Int. J of Hydrogen Energy, vol.36, 2011, pp. 5128-5135 [16] K. Eguchi, T. Setoguchi, T. Inoue, H. Arai. Solid State Ionics, vol.52, 1992, pp. 165-72. [17] L.V. Azaroff, Element s of X-Ray Crystallography, McGraw-Hill, New York, 1968, 552. [18] S.Lubk e, H.D.Wiemhofer, Solid State Ionics , vol.117, 1999, pp. 229. [19] R.D.Shannon, Acta Cryst., vol. A32, 1976, pp. 751. [20] J. H. Kuo, H. U. Anderson, and D. M. Sparlin: J. Solid State Chem., vol.83, 1989, pp. 52. [21] S.R.Bishop, K.L.Dunkun, E.D.Wachsman, Electrochim. Acta, vol.54, 2009, pp. 1436. [22] H.Hayashi, M.Kanoh, C.J.Quan, H.Inaba, S.Wang, M.Dokiya, H.Tagawa, S olid State Ionic s, vol.132, 2000, pp. 227. [23] F.Tietz, Ionics, vol.5, 1999, pp. 129. [24] S.Wang, R.Zheng, A.Suzuki, T.Hashimoto, Solid State Ionics, vol.174, 2004, pp. 157. |