 Psychology 2012. Vol.3, No.12A, 1223-1230 Published Online December 2012 in SciRes (http://www.SciRP.org/journal/psych) http://dx.doi.org/10.4236/psych.2012.312A181 Copyright © 2012 SciRes. 1223 Social Support and Sleep. Longitudinal Relationships from the WOLF-Study Maria Nordin1*, Peter Westerho lm2, Lars Alfredsson3, Torbjörn Åkerstedt4 1Department of Psychology, Um e å University, Umeå, Sweden 2Uppsala University, Uppsala, Sweden 3Karolinska Institutet, Stockholm, Sweden 4Stress Research Institute, Stockholm, Sweden Email: *maria.nordin@psy.umu.se Received September 14th, 2012; revised October 18th, 2012; accept e d N o v e mber 19th, 2012 Aim: To investigate the relationship between two social support dimensions (network and emotional support) and sleep quality and between two social support sources (at and outside work) and sleep quality. Methods: The three-wave prospective Work Lipids and Fibrinogen (WOLF) study from Northern Swe- den was used including 2420 participants who had filled out a questionnaire on working life, life style and health. Sleep quality was assessed by the Karolinska Sleep Questionnaire (KSQ). Structure and function of social support were measured as network support both at and outside work by Availability of Social Integration (AVSI) and emotional support both at and outside work by Availability of Attachment (AVAT). Logistic regression was used, utilizing variables created to assess development over time. Moreover, reversed causation was tested. Results: Improved network support at work decreased the risk of disturbed sleep (OR .65; 95% CI .47 - .90) as did improved emotional support outside work (OR .69; 95% CI .49 - .96). Reporting a constant poor network support at work increased the risk of disturbed sleep (OR 1.53, 95% CI 1.10 - 2.11) as did reporting a constant poor emotional support outside work (OR 1.46; 95% CI 1.02 - 2.05). In men constant good network at work decreased the risk of disturbed sleep (OR .49, 95% CI .34 - .71). Reversed causation analyses indicate some bi-directionality. Conclusion: Being able to per- ceive social support is a human strength promoting sleep. Both dimension (structure and function) and source (at and outside work) of support matters in sleep quality and seem to be related since the structural dimension was more likely to affect sleep when derived from work, whereas the functional dimension af- fected sleep quality if it was provided outside work. Men’s sleep seems to be more sensitive to network support at work. Disturbed sleep may also alter the perception of social support. Keywords: Sleep Quality; KSQ; Social Integration; Emotional Support; Reversed Causation Introduction To perceive social support from friend s and family as positi ve is a psychological strength that provides stress reducing and health beneficial effects (House, Landis, & Umberson, 1988; Mankowski & Wyer, 1997). Another important health promoter is good sleep. However, about 25% of the population in the Western hemisphere (e.g., Ohayon, 1997) suffers from sleep disturbances, a problem that may lead to more serious diseases (e.g., Schwartz et al. 1999; Tsuno, Besset, & Richier, 2005). Previous findings indicate that social support and sleep have stress as a common denominator. Sleep is depicted as the oppo- site of stress since sleep is easily disturbed by stress (Healy, Kales, Monroe, Bixler, Chamberlain, & Soldatos, 1983; Ekstedt, 2005), whereas social support is a well-known and well-inves- tigated stress reliever (e.g., Berkman & Syme, 1979; House, Landis, & Umberson, 1988; Cohen, Underwood, & Gottlieb, 2000). Cross-sectional associations have been found between social support and sleep (e.g., Nakata, Haratani, Tkahashi, Ka- wakami, Arito, Fujioka et al., 2001; Nordin, Knutsson, Sund- bom, & Stegmayr, 2005; Nordin, Sundbom, & Knutsson, 2008; Pelfrene et al., 2002), and Wahlstedt and Edling (1997) con- cluded in their longitudinal study that individuals who per- ceived impaired contacts with coworkers and/or supervisors had a higher risk of reporting disturbed sleep. Moreover, Si- nokki, Ahola, Hinkka, Sallinen, Härmä, Puukka et al. (2010) concluded in a longitudinal study on a representative Finnish sample, that low social support especially at work was related to disturbed sleep. Social support is a dynamic process that provides comfort and aid from friends, family and coworkers. Social support can be divided into its structure and its function. The structure deals with the quantity of network of friends, family and co-workers (House, Landis, & Umberson, 1988). Previous research has consistently showed a positive correlation between network size and health (Cohen, Underwood, & Gottlieb, 2000) and Brugha, Weich, Singleton, Lewis, Bebbington, Jenkins et al. (2005), found that a network including more than three persons was beneficial for mental health. The function of social support entails the more qualitative aspects of support, emotional sup- port presumably being the most important dimension (House, Landis, & Umberson, 1988). Encouragement and comfort, two main ingredients in emotional support, are considered to be of great importance in maintaining health and well-being (Cohen, Underwood, & Gottlieb, 2000). Some studies have shown the importance of social support at work in the relationship with sleep (Nakata et al., 2001; Nordin *Corres ondin autho .  M. NORDIN ET AL. et al. 2005; Wahlstedt & Edling, 1997; Sinokki et al., 2010; Pelfrene et al., 2002). Another important source for support is the life outside work, containing family and friends and studies have shown positive relationships between social support from the realm outside working life and sleep (Hanson & Östergren, 1987; Ohayon et al., 1997; Tynjälä et al., 1999), especially in disease (Nordin e t al., 2008; Vosvick et al., 2004). Even though there are quite a few studies confirming a rela- tionship between social support and sleep, no study has to our knowledge investigated the relationship more at depth by study- ing how central dimensions (such as network and emotional support) develop over time and what matter sources (such as at work and outside work) of support play in sleep. Therefore, the aim of the present study is twofold as it is to, in a longitudinal design, 1) investigate if the development over time in the two social support dimensions, network and emotional support are related to sleep; and 2) investigate if social support from dif- ferent sources, work and outside work, matter in sleep. The general hypothesis that has been tested so far in previous re- search is that social support affects sleep and not the other way around. It is however possible that the lack of energy that poor sleep will contribute to and the bad mood that can be associated with disturbed sleep (Pilcher & Huffcutt, 1996) affects the pos- sibility to appreciate coworkers, friends and families. Therefore, reversed analyses are conducted. Because more women report disturbed sleep (Ohayon, 1997) and are considered to have more sources of support since they have been shown to act on more arenas than men (Antonucci, 1994), sex is taken into con- sideration. In the present study, the Work Lipids and Fibrinogen (WOLF) study from Northern Sweden, a three-wave prospec- tive epidemiological study is used. This three-wave design makes it possible to study both how development in social sup- port affects sleep quality in a long-term perspective, and if there is reversed causation in this relationship. Methods Design and Participants The present study is based on the WOLF-Norrland study (WOLF-N). The WOLF-N study is a prospective cohort study that aims at investigating the effects of psychosocial work fac- tors and life style on health. All Occupational Health Service units (OHS) in Västernorrland and Jämtland, two provinces in Northern Sweden, were invited to participate between the years 1996 and 1998 (T0). The OHS:s offered a health examination to all the employees served by them and administered ques- tionnaires for the employees to fill out. Fifteen OHS organiza- tions participated and the personnel were trained in standard- ized measurement procedures. The participants were re-invited to two follow-ups; T1, between 2000 and 2003 and T2, in- cluding only a questionnaire, in the fall of 2009. Up to three reminders were sent in both follow-up studies, unless the par- ticipant actively declined to participate. The original sample at T0 consisted of 5092 individuals, out of whom 4715 (93%) responded. The follow-up response rate at T1 was 71%, i.e., 3637 participants. At T2, 2821 (60% from T0; 77% from T1) had filled out the given questionnaire, thus hav- ing participated three times in the WOLF-Norrland study. The mean time elapsed between T0 and T1 was five years (±11 months) and between T1 and T2 seven years (±6 months). The sample demographics are presented in Tables 1 and 2. Ethical approval was obtained from the ethical committee at Karolinska Institutet. Outcome an d Pr e d ic t o r Variables Sle ep The sleep quality index in the Karolinska Sleep Question- naire (KSQ; Åkerstedt, Ingre, Broman, & Kecklund, 2008) was used as both a predictor and an outcome variable in this study. The items included were: difficulties falling asleep, restless sleep, repeated awakenings, and premature awakening and the response alternatives ranged from “never” to “most days of the week” (with values from 1 - 5 assigned) the past twelve months (T0 and T1) and the past three months (T2). Internal consis- tency was high with Cronbach’s alphas of .78 at T0, .82 at T1, and .84 at T2. Each question in the sleep quality index was dichotomized so that the response alternatives “a few times per week” and “every night” were identified as disturbed sleep and coded with the number 1 leaving the other response alternatives coded with 0. Thereafter, the four questions included were summed into a sleepy quality index and those scoring one to four (i.e. had any of the symptoms) were identified with dis- turbed sleep. The criterion was set to be similar to that of insom- nia (Buysse, Ancoli-Israel, Edinger, Lichstein, & Morin, 2006). New cases of disturbed sleep were identified as those who re- ported disturbed sleep according to the definition above at T2 but not at T0 and T1. Social Support; Dimensions and Sources The structural dimension of social support was represented by the Swedish version of Availability of Social Integration (AVSI; Henderson, Duncan-Jones, Byrne, & Scott, 1981; Undén & Orth-Gomér, 1989) measuring network support. The questions “There are people in my surrounding I easily can ask for things from, for example borrow tools or kitchen ware” and “Apart from those at home, there are others I can turn to in need” were excluded from this index, since they loaded on a separate factor in a factor analysis and lowered the internal reli- ability to unsatisfactory levels (a pattern previously shown in another sample; Nordin et al., 2008). The questions on how many friends that were available in different situations were asked both in the context of the work place and outside work and measured on a scale with the response alternatives: none, 1 - 2, 3 - 5, 6 - 10, 11 - 15 and more than 15. Thus, two indexes were formed; network support from the source at work (where the summed index was dichotomized at the first quartile [iden- tified at T0 and used on all occasions, i.e., T0, T1 and T2, for comparative reasons] between scale scores 10 and 11), and network support outside work, dichotomized at the first quartile (identified at T0 and used on all occasions for comparative reasons) between 11 and 12. This dichotomy equals a cut be- tween five and six friends. The functional dimension of social support was represented by the Swedish version of Availability of Attachment (AVAT; Henderson et al., 1981; Undén & Orth-Gomér, 1989) measure- ing emotional support. The questions were asked both in the context of the work place and outside work. Thus, two indexes were formed, emotional support from the source at work (where the summed indexed was dichotomized at the first quartile [identified at T0 and used on all occasions for comparative reasons] between scale scores 5 and 6), and emotional support from the source outside work (dichotomized at the first Copyright © 2012 SciRes. 1224  M. NORDIN ET AL. Copyright © 2012 SciRes. 1225 Table 1. Frequencies, prevalenc e s , means and standard deviations o f t h e s t u d i e d v a riables. T0 T1 T2 n % n % n % Outcome and predictor variables Sleep No 1642 8.8 1414 7.5 1612 73.1 Yes 390 19.2 592 29.5 593 26.9 Social network at work Large 1373 68.9 1230 63.8 911 6.1 Small 620 31.1 698 86.2 606 39.9 Social network outside work Large 1785 88.2 1715 86.3 1797 79.7 Small 239 11.8 272 13.7 458 2.3 Emotional sup port at wor k Yes 1581 78.4 1548 78.9 1219 79.7 No 435 21.6 414 21.1 310 2.3 Emotional sup por t outside wor k Yes 1512 74.3 1459 72.8 1531 66.7 No 524 25.7 545 27.2 764 33.3 Confounding variables Sex Man 1987 82.1 1987 82.1 Woman 433 17.9 433 17.9 Education University 463 16.8 335 16.8 No university 1710 83.2 1655 83.2 Age (m ± sd) 43.4 ± 8.7 5.1 ± 9.8 Young 1058 51.4 721 29.8 Old 1001 48.6 1698 7.2 Marital status Married 1648 8.1 1669 81.6 Unmarried 409 19.9 376 18.4 Living alone No 1774 86.5 1777 87.5 Yes 277 13.5 253 12.5 Children at home Yes 772 37.6 971 47.8 No 1279 62.4 1059 52.2 Demands at work Low 1433 7.5 1376 68.5 High 600 24.8 634 31.5 Control at work Low 1310 64.0 1371 67.9 High 738 36.0 648 32.1 Shift work No 1347 65.5 1368 67.4 Yes 710 34.5 662 32.6  M. NORDIN ET AL. quartile [identified at T0 and used on al occasions for compara- tive reasons] between 8 and 9). Confound in g Va riables Sex and age were assessed by single questions. Education was assessed by the question “Which one of the following schools/educations have you attended?” The response alterna- tive “university education” was contrasted with the other alter- natives given. For marital status the response alternatives “married/cohabiting” was contrasted with “single”, “divorced”, and “widow/widower” in combination. Living alone was as- sessed by the question “Do you live alone?” and the response alternative yes was contrasted with the alternatives living with a partner, with children, or with parents. Having children at home was estimated by the question “Do you have children living at home?” with the response alternatives yes and no. Demand and control at work were estimated by the Swedish version of the Job Strain Questionnaire (JSQ) based on the demand-con- trol model postulated by Karasek and Theorell (1990). As for the demand dimension, the five included questions were summed. For comparative reasons, the distribution at T0 was used as base for identifying those perceiving high demands at work at T0, T1 and T2 and separating them from the rest. The control at work index was treated as one dimension in the same way as the demand index in that T0 was used as base for identifying those reporting low control. A summary score was derived from the answers to the six questions included and the index was subsequently dichotomized on the highest quartile given the reversed scale. Shift work was measured with the question “Do you work shifts?” with the response alternatives “no”, con- trasted with “yes” (including the alternatives: 2-shift, continu- ous 3-shift, irregular work schedule without night shift, irregu- lar work schedule with night shifts, permanent night work, other type of shift work). Loss of a work place changes ones source of social support. Therefore, retirement was considered by the response alternative retired to the question “What is your current occupation?” at T2. The procedures undertaken to create the variables were the same at T0, T1 and T2. Moreover, variables measuring devel- opment (i.e., both change a nd consistency over time) across the five years of follow-up between T0 and T1 were created for participants where data from both occasions were obtained. Thus, development variables were created for all the social support variables, the sleep quality variable, education, marital status, demand at work, control at work, and shift work by combining the dichotomized variables presented above into four categories; positive responses at both T0 and T1, negative response at T0 and positive response at T1, positive response at T0 and negative response at T1, and negative responses at both T0 and T1 (see Table 2 for their respective distributions). Development in age was created by first dichotomizing the age variables on the median age at T0 (44 years) and subse- quently combining the variables into below 44 at T0 and T1, below 44 at T0 and above at T1, and above 44 at both T0 and T1 (see Table 2). Statistical Procedure Spearman’s rho was used to estimate correlations between the variables for selection of confounding variables. Logistic regression analyses were used to estimate odds ratios with 95% Table 2. Changes in predictor, outcome and confound ing variables. n % Slee Unchanged good sleep T 0 & T1 126163.6 Disturbed at T0 - good at T 1 141 7.1 Good at T0 - disturbed at T1 345 17.4 Unchanged disturbed sleep T0 & T1 236 11.9 Network su ort at work Unchanged large netw ork T0 - T1 991 52.8 Small network T0 - large network T1 203 1.8 Large network T0 - small network T1 313 16.7 Unchanged small network T0 - T1 369 19.7 Network su ort outsidework Unchanged large netw ork T0 - T1 158781.1 Small network T0 - large network T1 106 5.4 Large network T0 - small network T1 142 7.3 Unchanged small network T0 - T1 122 6.2 Emotional su ort at work Unchanged adequate T0 & T1 132268.7 Inadequate T0 - adequate T1 195 1.1 Adequate T0 - inadequa t e T1 189 9.8 Unchanged inadequate T0 & T1 217 11.3 Emotional su ort outsidework Unchanged adequate T0 & T1 122061.6 Inadequate T0 - adequate T1 227 11.5 Adequate T0 - inadequate T1 255 12.5 Unchanged inadequate T0 & T1 280 14.1 Education Unchanged high 297 14.9 Low T0 - high T1 41 2.1 Unchanged low 161281.1 A e Below 42 T0 - above 42 T1 682 33.1 Above 42 T0 & T1 376 18.3 Below 42 T0 & T1 998 48.5 Marital status Married T0 & T1 153775.2 Not married T0 - married T1 131 6.4 Married T0 - not married T1 101 4.9 Unmarried T0 & T1 274 13.4 Living alone Not living a l on e T0 & T1 167382.7 Living alone T0- not livi ng alone T1 99 4.9 Not living alone T0-living alone T1 77 3.8 Living alone T0 & T1 173 8.6 Children at home No children a t home T0 & T1 632 31.3 Children a t home T0 - no children at home T1 333 16.5 No children at home T0 - Children at home T1 131 6.5 Children a t home T0 & T 1 926 45.8 Demands at work Low T0 & T 1 112256.6 Low T0 - high T1 239 12.0 High T0 - low T1 280 14.1 High T0 & T1 343 17.3 Control at work High T0 & T1 108253.9 Low T0 - high T1 282 14.0 High T0 - low T1 205 1.2 Low T0 & T 1 439 21.9 Shift work No shift T0 & T1 126 862.5 Shift T0 - no shift T1 99 4.9 No shift T0 - shift T1 69 3.4 Shift T0 & T1 592 29.2 Copyright © 2012 SciRes. 1226  M. NORDIN ET AL. confidence interval. In testing the relationship between social support and sleep quality four models were created for each predictor-outcome combination: Model I, a crude model; Model II, adjusted for baseline sleep/social support (depending on tested direction); Model III, Model II + the social life variables that correlated with each predictor variable respectively, and Model IV (only for the analyses referring to the source at work), Model III + the working life variables correlating to each pre- dictor variable respectively. Analyses were conducted by both testing social support as the predicting factor and sleep as the outcome and vice versa, i.e., sleep as the predicting factor and social support as the outcome (see e.g., Kivimäki, Virtanen, Vartia, Elovainio, Vahtera, & Keltinkangas-Järvinen, 2003). All analyses were conducted using SPSS 18.0 work package. Results In this three-wave follow-up study, the prevalence of dis- turbed sleep increases between T0 and T1 but decreases some- what at T2 (see Table 1). The incidence proportion of disturbed sleep between T0 and T2 (1997-2002) is 21.2% (n = 504), be- tween T1 and T2 (2002-2009) 22.5% (n = 352), and between T0 and T2 (1997-2009) 18.2% (n = 246). Moreover, the preva- lence of small networks increases as does the report of low emotional support at T2 compared to T0 and T1 (see Table 1). Table 2 shows the distribution of the development variables. Almost a fifth of the sample reports impaired sleep quality whereas seven per cent report an improvement in sleep quality over time. About 12% report an unchanged poor sleep quality, although the vast majority (63.6%) reports unchanged good sleep quality. Regarding development of social support, a larger change is reported in network support at work than outside work whereas a larger change is reported in emotional support outside work than in emotional support at work. Reporting an increase in network support at work and more emotional support outside work over time decreases the risk of disturbed sleep at T2. Moreover, reporting constantly low net- work support at work as well as constantly poor emotional support outside work increases the risk of disturbed sleep at T2. A decrease in network support at work also increases the risk of disturbed sleep, but when controlling for development in social life outside work this risk falls to insignificance (see Table 3). It is plausible that poor sleep contributes to lack of energy and bad mood, which may affect the ability to appreciate friends and families. Reversing the analyses shows that con- stant poor sleep quality increases the risk of reporting low net- work support outside work (Model I OR 1.83, 95% CI 1.32 - 2.53; Model II [adjusted for network support at baseline] OR 1.59, 95% CI 1.10 - 2.31; Model III [Model II + adjusted for sex] OR 1.62, 95% 1.12 - 2.36; Model IV [Model III + adjusted for demand and control] OR 1.58, 95 % CI 1.07 - 2.33) whereas improved sleep quality decreases this risk (Model I OR .55, 95% CI .40 - .76; Model II [adjusted for network support at baseline] OR .63, 95% CI .43 - .91; Model III [Model II + ad- justed for sex] OR .62, 95% .42 - .90; Model IV [Model III + adjusted for demand and control] OR .63, 95 % CI .43 - .94). To investigate potential differences between men and women in the relationship between social support an sleep, interaction analyses were performed. Interaction effects were found be- tween sex and constant good network support at work (OR .47, 95% CI .22 - 1.00) and post hoc analyses showed the risk of disturbed sleep being lowered in men reporting constantly good network support at work (Model I: OR .52, 95% CI .38 - .71; Model II [Model I + adjustment for change in sleep between T0 and T1]: OR .51, 95% CI .36 - .72; Model III [Model II + ad- justment for change in partnership and living alone]: OR .50, 95% CI .35 - .71; Model IV [Model III + adjustment for change in demand, contro l and shift work]: OR . 49, 95% CI .34 - .71). No relationship was found between good network support and sleep in women. Discussion The health beneficial power of social support is clearly shown in this study since both an increase in the number of network members at work and improved emotional support outside work reduced the risk of disturbed sleep. These results are to our knowledge, the first to show that an increase and an improvement in social support may help reducing sleeping problems. Both dimension (network and emotional support) and support sources (at work and outside work) were associated with sleep. In fact, dimension and source seemed to be related as sleep was more likely to be affected by network support at work but by emotional support from the realm outside work. Moreover, a bi-directional relationship was indicated by poor network support outside work increasing the risk of poor sleep quality. Dimensions: Structure and Function Network support has previously been shown to be the more important dimension of the two under study in relation to sleep disturbances (Nordin et al., 2005; Nordin et al., 2008). Given the previous research showing the structural dimension of so- cial support being closely related to health (Cohen, Underwood, & Gottlieb, 2000; House, Landis, & Umberson, 1988), these results are logical. However, even if in line with previous the- ory and research on general health (ibid.), the effect that emo- tional support outside work had on sleep quality has, to the best of our knowledge, not been shown before and is therefore espe- cially interest i ng and important. Sources: W ork and Outside Work This study supports both the longitudinal studies by Wahl- stedt & Edling (1997) and Sinokki et al. (2010) in that network support at work is related to sleep. Taken together, these results are important. Given the link between sleep and other diseases (e.g., Schwartz et al. 1999; Tsuno, Besset, & Richier, 2005), sleep disturbance caused by poor organizational structures or lack of understanding of social relations at work may lead to sick leaves, costly both for the company and the individual. Interestingly though, our results also suggest that an increase in the numbers of coworkers in the network at work may promote better sleep. The mechanisms here need to be more thoroughly investigated and it is important to point out that the individuals’ interpretation of what resources are at hands (Mankowski & Wyer, 1997) also play a significant role in the response patterns given in studies like these. However, the results again confirm previous research on the beneficial power in social support. This study also adds that social support outside work is im- portant. Sinooki et al., (2010) showed that a structural mea- sure of social support (similar to our measure of network sup- port) outside work was important for sleep. However, as men- tioned above, the fact that emotional support outside work is Copyright © 2012 SciRes. 1227 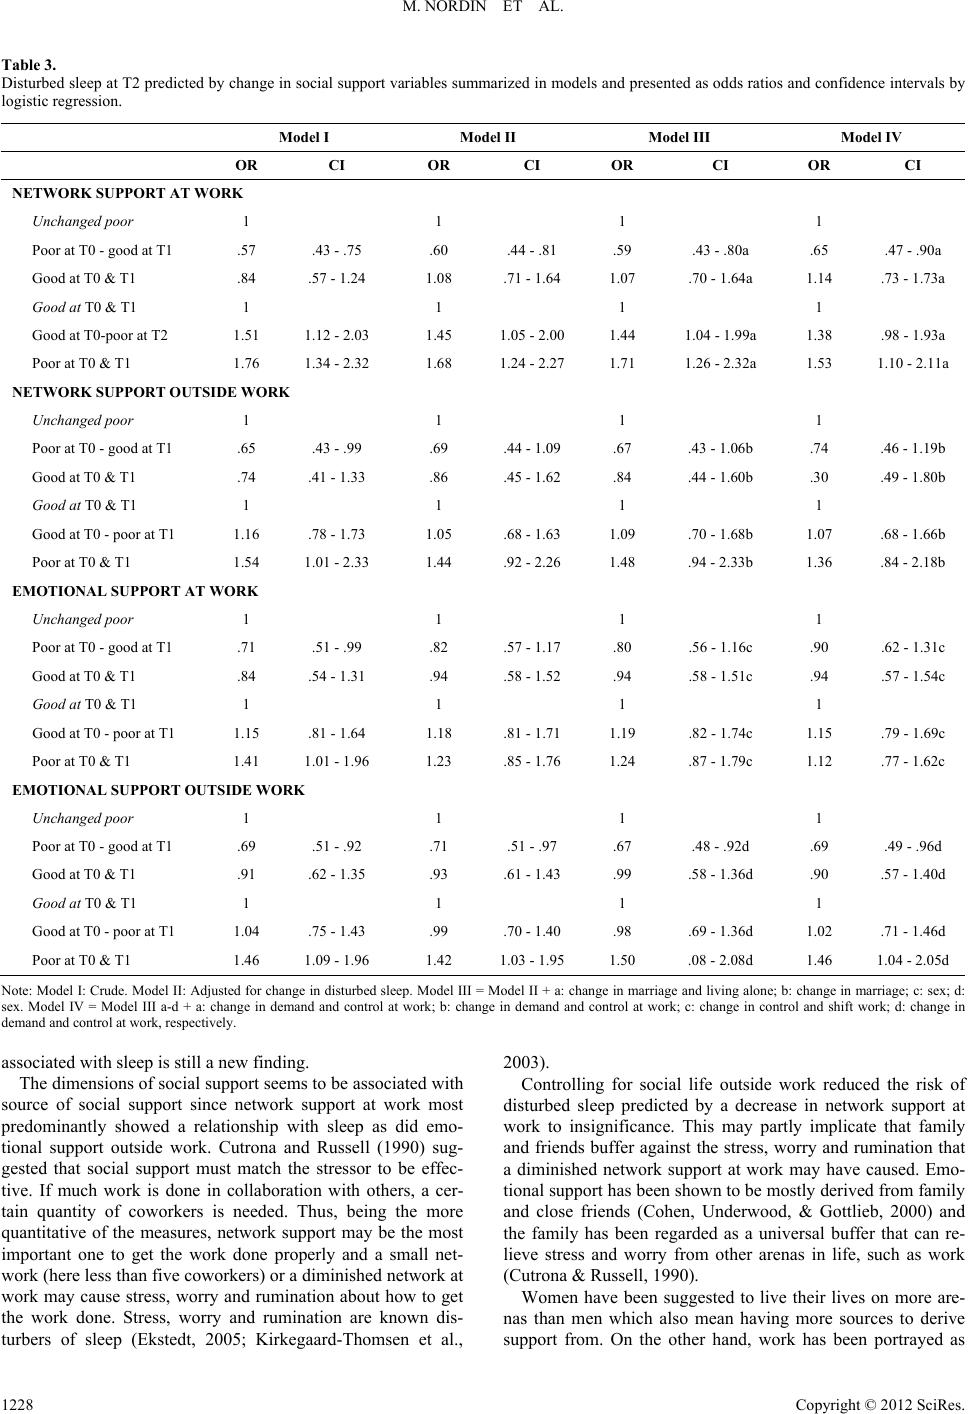 M. NORDIN ET AL. Copyright © 2012 SciRes. 1228 Table 3. Disturbed sleep at T2 predicted by change in social support variables summarized in models and presented as odds ratios and confidence intervals by logistic regression. Model I Model II Model III Model IV OR CI OR CI OR CI OR CI NETWORK SUPPORT AT WORK Unchanged poor 1 1 1 1 Poor at T0 - good at T1 .57 .43 - .75 .60 .44 - .81 .59 .43 - .80a .65 .47 - .90a Good at T0 & T1 .84 .57 - 1.24 1.08 .71 - 1.64 1.07 .70 - 1.64a 1.14 .73 - 1.73a Good at T0 & T1 1 1 1 1 Good at T0- poor at T2 1.51 1.12 - 2.03 1.45 1.05 - 2. 00 1.44 1.04 - 1.99a 1.38 .98 - 1.93a Poor at T0 & T1 1.76 1.34 - 2.32 1.68 1.24 - 2.27 1.71 1.26 - 2.32a 1.53 1.10 - 2.11a NETWORK SUPPORT OUTSIDE WORK Unchanged poor 1 1 1 1 Poor at T0 - good at T1 .65 .43 - .99 .69 .44 - 1.09 .67 .43 - 1.06b .74 .46 - 1.19b Good at T0 & T1 .74 .41 - 1.33 .86 .45 - 1.62 .84 .44 - 1.60b .30 .49 - 1.80b Good at T0 & T1 1 1 1 1 Good at T0 - p oor at T1 1.16 .78 - 1.73 1.05 .68 - 1.63 1.09 .70 - 1.68b 1.07 .68 - 1.66b Poor at T0 & T1 1.54 1.01 - 2.33 1.44 .92 - 2.26 1.48 .94 - 2.33b 1.36 .84 - 2.18b EMOTIONAL SUPPORT AT WORK Unchanged poor 1 1 1 1 Poor at T0 - good at T1 .71 .51 - .99 .82 .57 - 1.17 .80 .56 - 1.16c .90 .62 - 1.3 1c Good at T0 & T1 .84 .54 - 1.31 .94 .58 - 1.52 . 94 .58 - 1.51c .94 .57 - 1.5 4c Good at T0 & T1 1 1 1 1 Good at T0 - p oor at T1 1.15 .81 - 1.64 1.18 .81 - 1.71 1.19 .82 - 1.74c 1.15 .79 - 1.69c Poor at T0 & T1 1.41 1.01 - 1.96 1.23 .85 - 1.76 1.24 .87 - 1.79c 1.12 .77 - 1.62c EMOTIONAL SUPPORT OUTSIDE WORK Unchanged poor 1 1 1 1 Poor at T0 - good at T1 .69 .51 - .92 .71 .51 - .97 .67 .48 - .92d .69 .49 - .96d Good at T0 & T1 .91 .62 - 1.35 .93 .61 - 1.43 . 99 .58 - 1.36d .90 .57 - 1.40d Good at T0 & T1 1 1 1 1 Good at T0 - p oor at T1 1.04 .75 - 1.43 .99 .70 - 1.40 .98 .69 - 1.36d 1.02 .71 - 1.46d Poor at T0 & T1 1.46 1.09 - 1.96 1.42 1.03 - 1.95 1.50 .08 - 2.08d 1.46 1.04 - 2.05d Note: Model I: Crude. Model II: Adjusted for change in disturbed sleep. Model III = Model II + a: change in marriage and living alone; b: change in marriage; c: sex; d: sex. Model IV = Model III a-d + a: change in demand and control at work; b: change in demand and control at work; c: change in control and shift wo rk; d: change in demand and control at work, respectively. associated with sleep is still a new finding. The dimensions of social support seems to be associated with source of social support since network support at work most predominantly showed a relationship with sleep as did emo- tional support outside work. Cutrona and Russell (1990) sug- gested that social support must match the stressor to be effec- tive. If much work is done in collaboration with others, a cer- tain quantity of coworkers is needed. Thus, being the more quantitative of the measures, network support may be the most important one to get the work done properly and a small net- work (here less than five coworkers) or a diminished network at work may cause stress, worry and rumination about how to get the work done. Stress, worry and rumination are known dis- turbers of sleep (Ekstedt, 2005; Kirkegaard-Thomsen et al., 2003). Controlling for social life outside work reduced the risk of disturbed sleep predicted by a decrease in network support at work to insignificance. This may partly implicate that family and friends buffer against the stress, worry and rumination that a diminished network support at work may have caused. Emo- tional support has been shown to be mostly derived from family and close friends (Cohen, Underwood, & Gottlieb, 2000) and the family has been regarded as a universal buffer that can re- lieve stress and worry from other arenas in life, such as work (Cutrona & Russell, 1990). Women have been suggested to live their lives on more are- nas than men which also mean having more sources to derive support from. On the other hand, work has been portrayed as  M. NORDIN ET AL. the most important source of support for men (Shumaker & Hill, 1991). In this light, the increased chance of better sleep due to the report of constant good network support at work only in men is not surprising. Reversed Causation Even if causality cannot be established in a study design like this, the results support the commonly tested hypothesis that social support affects sleep. However, one result that deserves special attention is the report of a constant poor sleep quality increasing the risk of reporting a poor network support outside work, whereas an improvement of sleep quality decreased this risk. Speculating on these results, disturbed sleep quality may deplete energy resources i.e., resources needed to interact with friends in order to perceive belongingness (Hagerty, Lynch- Sauer, Patusky, Bouwsema, & Collier, 1992). The energy that remains, despite a disturbed sleep, may foremost be spent at work, interacting with coworkers. This prioritization may be required for the work to run smoothly. However, when return- ing home, the energy depletion due to disturbed sleep (and presumably a hard day’s work) may have taken its toll resulting in the perception of low network support since there is no en- ergy left to engage in family and friends. Strengths and Limitati ons In interpreting the results, strengths and limitations need to be considered carefully. The fact that the present study is a three wave longitudinal study is an obvious strength as it gives the possibility to study changes over time and reversed causa- tion and consequently elucidate temporal sequence of social support and sleep. Moreover, the extensive questionnaire in- cluded in the study give the possibility of careful confounding control, even if there may be yet other confounding variables at play than those considered here. However, the long periods in between the follow-ups (five and seven years respectively) limit the possibilities to draw conclusions since, especially sleep quality, may have fluctuated several times over the years due to different causes. The fact that the women are outnumbered by the men in this study may have lead to somewhat skewed re- sults in the interaction analyses. Moreover, the sleep quality index was not perfectly comparable over the years because at T0 and T1 the participants were asked to assess their sleep dur- ing the past 12 months but at T2 this assessment period was reduced to three months. This may have lead to an underesti- mation of disturbed sleep according to the criteria of insomnia at T0 and T1 and diluted the results somewhat. Conclusion This study shows that the perception of social support is a human strength and an asset in promoting sleep. Both dimen- sion (structure and function) and source (at and outside work) of support matter in sleep quality and seems to be related since the structural aspect (network support) is more likely to affect sleep when derived from work, whereas the functional aspect (emotional support) affected sleep quality if it was provided from outside work. Also bi-directional relationships were found as social support preceded disturbed sleep quality simultane- ously to disturbed sleep quality preceding the report of per- ceived social support. More research on how to strengthen both social support and sleep would benefit health and well-being in the general population. REFERENCES Åkerstedt, T., Ingre, M., Broman, J.-E., & Kecklund, G. (2008). Dis- turbed sleep in shift workers, day workers, and insomniacs. Chrono- biology International, 25 , 333-348. doi:10.1080/07420520802113922 Antonucci, T. C. (1994). A life-span view of women’s social relations. In B. Turner, & L. Troll (Eds.), Women growing older: Psychologi- cal perspectives (pp. 239-269). Thousand Oaks: Sage Publications. Berkman, L. F., &Syme, L. S. (1979). Social networks, host resistance, and mortality: A nine-year follow-up study of Alameda County resi- dents. American Journal of Epidemiology, 109, 186-2 04. Brugha, T. S., Weich, S., Singleton, N., Lewis, G., Bebbington, P. E., Jenkins, R., et al. (2005). Primary group size, social support, gender, and future mental health status in a prospective study of people living in private households throughout Great Britain. Psychological Medi- cine, 35, 705-714. doi:10.1017/S0033291704003903 Buysse, D. J., Ancoli-Israel, S., Edinger, J. D., Lichstein, K. L., & Morin, C. M. (2006). Recommendations for a standard research as- sessment of insomnia. Sleep, 29, 1155-1173. Cohen, S., Underwood, L. G., & Gottlieb, B. H. (Eds.) (2000). Social support measurement and intervention. A guide for health and social scientists. New York: Oxford University Press. Cutrona, C. E., & Russell, D. W. (1990). Type of social support and specific stress: Toward a theory of optimal matching. In B. R. Sara- son, I. G. Sarason, & G. R. Pierce (Eds.), Social support: An interac- tional view (pp. 319- 366). New York: John Wiley & sons. Ekstedt, M (2005). Burnout and sleep. Dissertation Karolinska Insti- tutet. Hagerty, B. M. K., Lynch-Sauer, J., Patusky, K. L., Bouwsema, M., & Collier, P. (1992). Sense of belonging: A vital mental health concept. Archives of Psychiatric Nursing, 6, 172-177. doi:10.1016/0883-9417(92)90028-H Hanson, B. S., & Östergren, P. O. (1987). Different social network and social support characteristics, nervous problems and insomnia: Theoretical and methodological aspects on some results from the population study “Men born in 1914”, Malmö, Sweden. Social Sci- ence Medicine, 25, 849-859. doi:10.1016/0277-9536(87)90043-8 Healy, E. S., Kales, A., Mo nroe, L. J., Bixler, E. O., Chamberlin, K ., & Soldatos, C. R. (1981). Onset of insomnia: Role of life-stress events. Psychosomatic Medicine, 4 3 , 439-451. Henderson, S., Duncan-Jones, P., Byrne, D. G., & Scott, R. (1980). Measuring social relationships: The interview schedule for social in- tegration. Psyc ho lo gi ca l M ed ic in e, 10, 723-734. doi:10.1017/S003329170005501X House, J. S., Landis, K. R., & Umberson, D. (1988). Social relationship and health. Science, 241, 540-545. doi:10.1126/science.3399889 Karasek, R., & Theorell, T. (1990). Healthy work. Stress, productivity, and the reconstruction of worki ng li fe. New York: Basic Books. Kirkegaard, T. D., Mehlsen, M. Y., Christensen, S., & Zachariae, R. (2003). Rumination—Relationship with negative mood and sleep quality. Persona lity and Individual Differences, 34, 1293-1301. doi:10.1016/S0191-8869(02)00120-4 Kivimäki, M., Virtanen, M., Vartia, M., Elovainio, M., Vahtera, J., & Keltikangas-Järvinen, L. (2003). Workplace bullying and the risk of cardiovascular disease and depression. Occupational Environmental Medicine, 60, 779-783. doi:10.1136/oem.60.10.779 Mankowski, E. S., & Wyer, R. S. J. (1997). Cognitive causes and con- sequences of perceived social support. In G. R. Pierce, B. Lakey, I. G. Sarason, & B. G. Sarason (Eds.), Sourcebook of social support and personality (pp. 141-165). New York: Plenum Press. Nakata, A., Haratani, T., Takahashi, M., Kawakami, N., Arito, H., Fujioka, Y. et al. (2001). Job stress, social support at work, and in- somnia in Japanese shift workers. Journal of Human Ergology, 30, 203-209. Nordin, M., Knutsson, A., & Sundbom, E. (2008). Is disturbed sleep a mediator in the association between social support and myocardial infarction? Journal o f H e al t h Psychology, 13, 55-63. Copyright © 2012 SciRes. 1229  M. NORDIN ET AL. Copyright © 2012 SciRes. 1230 doi:10.1177/1359105307084312 Nordin, M., Knutsson A., Sundbom E., &Stegmayr, B. (2005). Psy- chosocial factors, gender and sleep. Journal of Occupational Health Psychology, 10, 54-63. doi:10.1037/1076-8998.10.1.54 Ohayon, M. M., Caulet, M., & Guilleminault, C. (1997). How a general population perceives its sleep and how this relates to the complaint of insomnia. Sleep, 20, 715-723. Ohayon, M. M. (2002). Epidemiology of insomnia: What we know and what we still need to learn. Sleep Medicine Reviews, 6, 97-111. doi:10.1053/smrv.2002.0186 Pelfrene, E., Vlerick, P., Kittel, F., Mak, R. P., Kornitzer, M., & De Backer, G. (2002). Psychosocial work environment and psychology- cal well-being: Assessment of the buffering effect on the job de- mand-control (-support) model in BELSTRESS. Stress and Health, 18, 43-56. doi:10.1002/smi.920 Pilcher, J. J., & Huffcutt, A. I. (1996). Effects of sleep deprivation on performance: A meta-analysis. Sleep, 19, 318-326. Schwartz, S., McDowell Anderson, W., Cole, S. R., Cornoni-Huntley, J., Hays, J. C., & Blazer, D. (1999). Insomnia and heart disease: A review of epidemiologic studies. Journal of Psychosomatic Research, 47, 313-333. doi:10.1016/S0022-3999(99)00029-X Shumaker, S. A., & Hill, D. R. (1991).Gender differences in social support and physical h ea l t h. Health Psychology, 10, 102-111. doi:10.1037/0278-6133.10.2.102 Sinokki M., Ahola, K., Hinkka, K., Sallinen, M., Härmä, M., Puukka, P., Klaukka T, Lönnqvist J., Virtanen, M. (2010). The association of social support at work and in private life with sleeping problems in the Finnish Health 2000 Study. JOEM, 52, 54-61. Tsuno, N., Besset, A., & Richie, K. (2005). Sleep and depression. Journal of Clinical Psychia t ry , 66, 1254-1269. doi:10.4088/JCP.v66n1008 Tynjälä, J., Kannas, L., Levälahti, E., & Välimaa, R. (1999). Perceived sleep quality and its precursors in adolescents. Health Promotion International, 14, 155-16 6. doi:10.1093/heapro/14.2.155 Undén, A.-L., & Orth-Gomér, K. (1984). Socialt stöd och hälsa delrapport 2: Utveckling av en enkätmetod för att mäta socialt stöd i befolkningsstudier (Nr. 178). Stockholm: Institutet för psykosocial milj ö medi cin . Vosvick, M., Gore-Felton, C., Ashton, E., Koopman, C., Fluery, T., Israelski, D., & Spiegel, D. (2004). Sleep disturbance among HIV- positive adults: The role of pain, stress and social support. Journal of Psychosomatic Research, 57, 459-463. doi:10.1016/S0022-3999(04)00445-3 Wahlstedt, K. G. I., & Edling, C. (1997). Organizational changes at a postal sorting terminal—Their effects upon work satisfaction, psy- chosomatic complaints and sick leave.Work & Stress, 11, 279-291. doi:10.1080/02678379708256841
|