Paper Menu >>
Journal Menu >>
 Journal of Environmental Protection, 2010, 1, 284-292 doi:10.4236/jep.2010.13034 Published Online September 2010 (http://www.SciRP.org/journal/jep) Copyright © 2010 SciRes. JEP The Combined Application of WTP and WTA in Contingent Valuation Methods Jianjun Cao, Yuanyuan Ren, Guozhen Du* MOE Key Laboratory of Arid and Grassland Ecology, Lanzhou University, Lanzhou, China. Email: caojj06@163.com, *guozdu@lzu.edu.cn. Received March 13th, 2010; revised May 6th, 2010; accepted May 8th, 2010. ABSTRACT The In most contingent valuation (CV) studies, WTP (Willingness to pay) and WTA (Willingness to accept) were often used separa tely, so protesting or no resp onse or even babbling answers are increasing, and the debate persists over the reliability of CV in economic policy ana lysis. In order to improve the reliability o f CV, WTP and WTA is used synchro- nously to estimate the restoration cost of Maqu grassland ecosystem. Data were partly from questionnaire survey, and partly from interviews and authorities. Before conclusions were derived, we assumed these data that came from inter- views and authorities were right. The main result is: If we assumed that the degraded grassland of Maqu needs 10 years to be restored, and divided the restoring period into two stages, then the restoration cost was 0.85 × 10⁸ RMB per year in former 4 years, 0.022 × 10⁸ RMB per year in latter 6 years. The total cost of Maqu grassland restoration was 3.62 × 10⁸ RMB. For all the costs of restoration, WTA occupied 94% and WTP only occupied 6%, suggesting that local g rass- land degradation was mainly caused by overgrazing and that the overloading livestock must be eliminated in order to achieve restoration successfully. Our research also showed that combining WTP and WTA in contingent valuation is very useful in estimating the cost of environmental improvement projects. Of course, whether these results are right or not, further researches are needed in the future, especially for the actual number of livestock in Maqu gra ssland. Keywords: Contingent Valuation Method (CV), Restoring Cost, Willingness to Pay (WTP), Willingness to Accepted (WTA), Anchored Payment Card (APC) 1. Introduction CV is a survey-based value elicitation approach which queries responders in systematic ways to state their will- ingness to pay (WTP) or willing to accept (WTA) hypo- thetical changes in some marketed and non-marketed goods or services. It has been widely used by economists to determine numerous environmental amenities or dam- age values, wetland restoration, nature protection, reduc- ing health risk, drainage basin, public policy, welfare analysis, culture goods and other fields. Economists have been using and refining the method for well over two decades [1-7]. The contingent valuation method has been used extensively and described and reviewed elsewhere [8]. One of the insistent tropes of the contingent valua- tion literature is that we constantly ask individuals to estimate both their WTA and their WTP. The individ- ual’s willingness to incur the proposed costs reveals in- formation about the value placed on the environmental improvements, while the individual’s willingness to accept the income change reveals information about the com- pensating variation that they associate with the proposed environmental change. WTA is just a method of weigh- ing opportunity costs. Individuals can judge how much money they would need compensation considering the market experience [9,10]. Literally thousands of CV studies have been done by the world. However, in most previous CV studies, the economic value or cost of the posed environmental improvements were only from indi- vidual’ WTP, researchers have spent much less energy on understanding the WTA measures because people often like to use willingness to pay rather than willing- ness to accept questions and someone may regard the problem with WTA exhibits a substantial hypothetical bias [11,12]. For lack of understanding WTA, protesting or no response or even babbling answers are increasing, and the debate persists over the reliability of CV in eco- nomic policy analysis [13]. Therefore, some researchers recommended that in CVM survey we should consider synchronously WTP and WTA of responders for unbi-  The Combined Application of WTP and WTA in Contingent Valuation Methods Copyright © 2010 SciRes. JEP 285 ased in cost-benefit analyses [14]. In this paper, we will try to combine WTP and WTA synchronously to esti- mate the restoration cost of Maqu degraded grassland ecosystem. 2. Methods 2.1. Study Area Maqu grassland ecosystem is the main body of the Maqu counties which is located on the eastern Qinghai-Tibet plateau, Gansu province, China (101°-101° E, 34°-35° N) (Figure 1). The altitude ranges from 2900 m to 4000 m with an annual rainfall of 450-780 mm. The annual av- erage temperature is 1.8℃ with below –10.7℃ in Janu- ary and 11.7℃ in July, the highest temperature during the growth season can reach 23.6℃ to 28.9℃, and there are, on average, 270 frost days annually. The grassland area is about 0.0087 × 10⁸ hm2 and 59.32% of it belongs to alpine meadow. Maqu is composed of 7 villages and 1 town (sub-admi- nistrative unit) with 0.04 million inhabitants, 73.4% of them being Tibetans. The county could be classified as a pure grazing area with 1.08 × 10⁸ RMB animal h usband r y income in 2004, accounted for 99% of the total agricul- ture income. Grassland of Maqu acts as local resource supplement and natural ecological barrier of Yellow River. Yellow River comes from Qinghai Province, then flows around Maqu about 433 kilometers and again en- ters into Qinghai. The water su pplement is 27 × 10 8 m3/s, so it is well known as the ‘water tower of plateau ’. However, under the consistent interference of natural and human factors, grassland degradation raised in recent Figure 1. Study area geography. years with its equilibrium broken, structures altered, and functions handicapped [15,16]. As degradation occurred, the average flux of Yellow River has been down from 478.8 m3/S to 393.8 m3/S, and the enhancements in lo cal living standards were also limited [17,18]. Facing with these issues, governments have taken some measures, such as rotation herding, deratization etc. [19]. However, almost all restoration projects lacked lo- cal inhabitants’ participation, and were controlled by governments, For lack of participation, restoration was slow and inefficient [20]. Therefore, in order to achieve degraded grassland restoration successfully, local herders must be guided to participate. Based on Ma [21], two approaches are often employed together to restore de- graded ecosystem. One is natural approach by ecosystem pressure reduced and its resilience capability promoted. Another is to restructure or rebuild it by human actions. To local herders of Maqu, reducing grassland pressure is to dwindle in numbers of livestock because overgrazing is the key factor that caused Maqu grassland degradation [22]. While for degraded grassland restructured or rebuilt, herders have to raise funds to guarantee costs for materi- als. To summarize degraded grassland restoration, two type costs must be considered. In this paper, we can re- gard WTA the least compensation for herders to willing- ness accept due to forgoing their livestock, and WTP as the largest willingn ess to pay for degraded grassland res- toration, which can enhance ecologic processes and stru- ctures, preserve regional and historical context, and en- courage sustainable cultural practices and uses [23]. 2.2. Questionnaire Construction and Investigation It is the first time for local herders, who have no experi- ence in making a price in the simulated market, to touch CV, so they can hardly express their WTP or WTA di- rectly. Based on Cuena [24], Anchored Payment Card (APC) was employed as eliciting tools of CV because it can avoid starting point bias and can establish the context in which the bids should be submitted. The bid value as well as its interval derived from the pilot survey with open-ended format. 2.2.1. Open-Ended Survey In order to gain bid value for APC, the open-ended for- mat questionnaire was designed, and 150 questionnaires were completed. Among 150 qu estionnaires, one third of them were handed out to local officials who were very familiar with grassland degradation and restoration. Ad- ditional 100 questionnaires were completed by 50 herd- ers who were near Maqu city, and by 50 graduates who came from the State Key Lab of Arid-Agriculture of Lanzhou University. The main part of the open-ended format questionnaire is:  The Combined Application of WTP and WTA in Contingent Valuation Methods Copyright © 2010 SciRes. JEP 286 Assume that local government was preparing an inte- grated project to improve the grassland quality and mitigate conflict caused by grassland and livestock. The project needs herders to support if grassland restored like 20 years ago. There are two ways for herders to support, including payment and reducing the number of livestock. Which one would you like to take? If you choose the payment way, then answer question (1), else answer question (2). 1) In next 10 years, how much money would you pay for supporting the plan from your family income per year? ___RMB. 2) If the government wants to buy your livestock for mitigating the pressure on the grassland. Please could you tell me the compensation that would like to accept for reducing your livestock by one cattle or one sheep? ___ RMB per cattle, ___RMB per sheep 2.2.2. Pil ot Survey In order to form the final survey that respondents under- stood and accepted the main description reasonably well, careful pilot survey was conducted by us as Arrow sug- gested [25]. Based on open-ended format survey, an APC format questionnaire was designed. Then, we did pilot survey through 50 local herders investigated with random sampling. Finally, according to recommendations given by some experts of Lanzhou University, bid value and its interval was adjusted moderately, and the formal ques- tionnaire was shaped. Comparison formal questionnaire to open-ended format questionnaire, contents changed a little except closed or half-closed questions substitution for some open-ended questions, the main part of formal questionnaire is: 1) In next 10 years, how much money (RMB) would you pay for supporting the plan from your family income per year? Please choose the corresponding numerical value that described as below 0 5 10 20 30 50 100 150 200 300 400 500 600 700 800 1000 1200 1500 1800 2000 2500 3000 a) If your selection is zero, then the reason (s) is (are) A With the limit of income B Believing that government could raise enough from others C The project may not get expected results D Others b) If your selection is not zero, then choose a corre- sponding payment tool A restoring fee B Donations C Labour D Others 2) According to two circs as described below, please choose the least compensation that you are willingness to accept separately a) cattle per (RMB) 600 800 1000 1200 1500 2000 2500 3000 3500 4000 4500 5000 5500 6000 6500 7000 8000 9000 10000 15000 20000 b) sheep per (RMB) 250 300 350 400 450 500 550 600 650 700 750 800 850 900 950 1000 2.3. Formal Investigation Using randomized cluster sampling, we selected 100 households in each village and one town, then adopted an in-person investigation because it generally leads to the highest survey response and generally reduces the likeli- hood of sample selection bias and provides more control over the order. It also offers practical advantages in main- taining respondent motivation and allows the use of gr aphic supplements [13,25,26]. Six inquirers were trained before the formal investigation, including three graduates of Lanzhou University and three local translators who were teaching in local elementary schools. The administration of the questionnaire took place during May 2005. Before interview, we gave each inves- tigated household certain gifts as compensation for the possible inconvenience of being interviewed. In inter- view time, respondents were reminded of the available range of the budget constraints, and that their willingness to pay for the environmental program in question would reduce their expenditures for private good or other public goods [2,25]. There are seven villages and one town in Maqu Country, the planning sample was 800 households. However, survey was suspended for some reasons in august 2005 and on ly 559 qu estionn aires we re completed. In order to avoid the estimated value wildly and implau- sibly, based on Arrow and Veiten [25,27], 19 question- naires were eliminated for their WTP in excess of 2% of their income. Also, 13 questionnaires were eliminated for no response, and one was eliminated for its respondent under the age of 18. Besides these and the lost one, 525 questionnaires were valid, accounting for 94% of the total questionnaires. 3. Results In many previous CV studies, only personal income was considered by researchers, and expenditure was always excluded, so information was insufficient in integrated economic factors analysis. Here, we brought expenditure into analysis in order to understand local economic state entirely and the economic factors related to WTP and WTA . 3.1. Socio-Economic Characters of the Respondents The preliminary findings and summary statistics of the sample of 525 respondents were presented in Table 1, 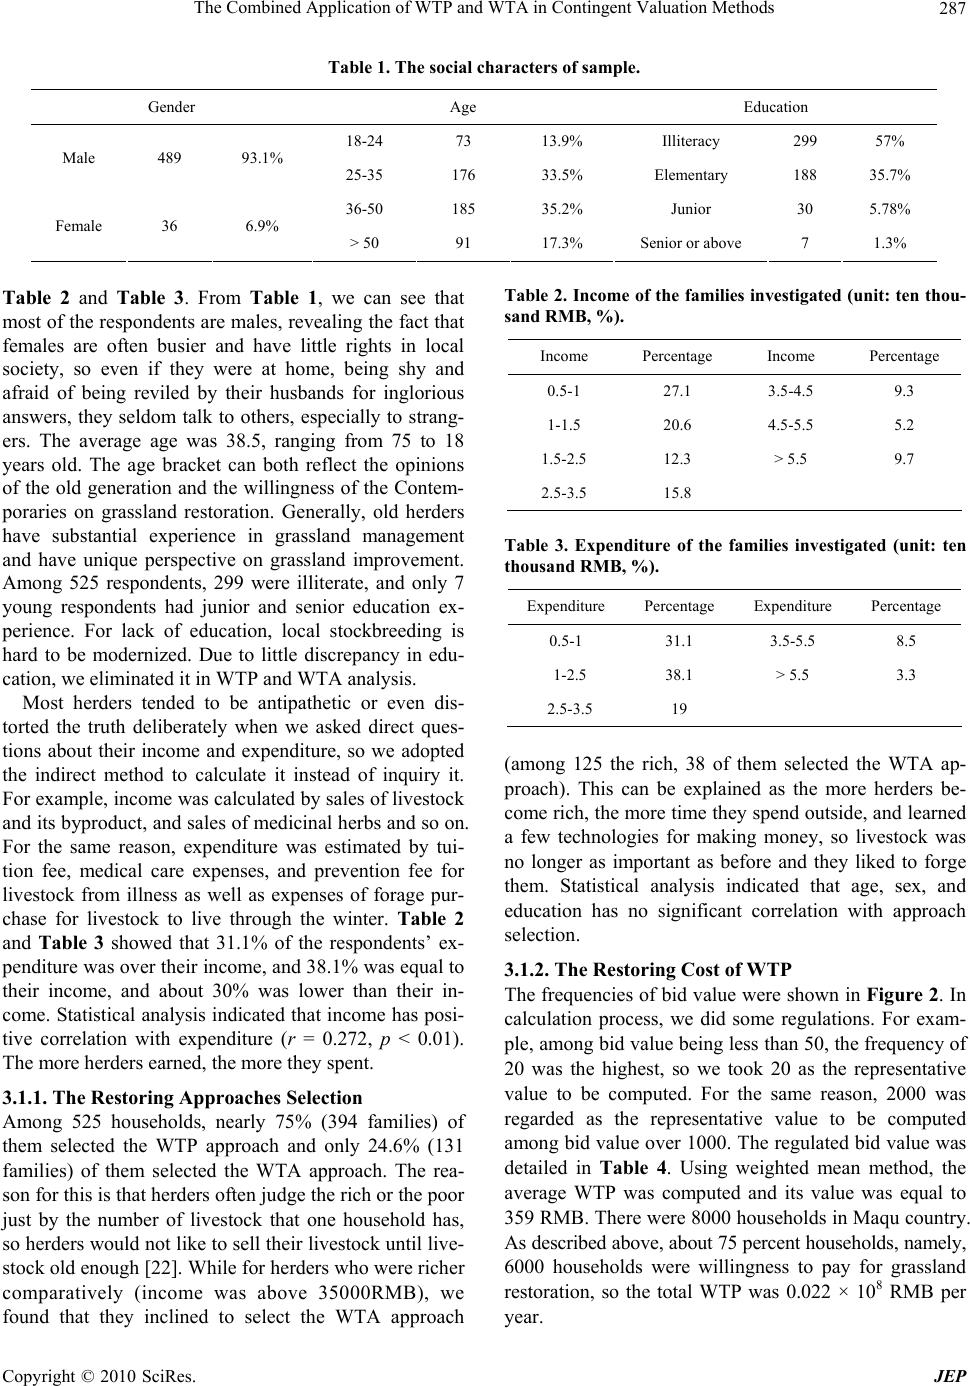 The Combined Application of WTP and WTA in Contingent Valuation Methods Copyright © 2010 SciRes. JEP 287 Table 1. The social characters of sample. Gender Age Education 18-24 73 13.9% Illiteracy 299 57% Male 489 93.1% 25-35 176 33.5% Elementary 188 35.7% 36-50 185 35.2% Junior 30 5.78% Female 36 6.9% > 50 91 17.3% Senior or above 7 1.3% Table 2 and Table 3. From Table 1, we can see that most of the respondents are males, revealing the fact that females are often busier and have little rights in local society, so even if they were at home, being shy and afraid of being reviled by their husbands for inglorious answers, they seldom talk to others, especially to strang- ers. The average age was 38.5, ranging from 75 to 18 years old. The age bracket can both reflect the opinions of the old generation and the willingness of the Contem- poraries on grassland restoration. Generally, old herders have substantial experience in grassland management and have unique perspective on grassland improvement. Among 525 respondents, 299 were illiterate, and only 7 young respondents had junior and senior education ex- perience. For lack of education, local stockbreeding is hard to be modernized. Due to little discrepancy in edu- cation, we eliminated it in WTP and WTA analysis. Most herders tended to be antipathetic or even dis- torted the truth deliberately when we asked direct ques- tions about their income and expenditure, so we adopted the indirect method to calculate it instead of inquiry it. For example, income was calculated by sales of livestock and its byproduct, and sales of medicinal herbs and so on. For the same reason, expenditure was estimated by tui- tion fee, medical care expenses, and prevention fee for livestock from illness as well as expenses of forage pur- chase for livestock to live through the winter. Table 2 and Table 3 showed that 31.1% of the respondents’ ex- penditure was over their income, and 38.1% was equal to their income, and about 30% was lower than their in- come. Statistical analysis indicated that income has posi- tive correlation with expenditure (r = 0.272, p < 0.01). The more herders earned, the more they spent. 3.1.1. The Res toring Approaches Selection Among 525 households, nearly 75% (394 families) of them selected the WTP approach and only 24.6% (131 families) of them selected the WTA approach. The rea- son for this is that herders often judge the rich or the poor just by the number of livestock that one household has, so herders would not like to sell their livestock un til live- stock old enough [22]. While for herders who were richer comparatively (income was above 35000RMB), we found that they inclined to select the WTA approach Table 2. Income of the families investigated (unit: ten thou- sand RMB, %). Income Percentage Income Percentage 0.5-1 27.1 3.5-4.5 9.3 1-1.5 20.6 4.5-5.5 5.2 1.5-2.5 12.3 > 5.5 9.7 2.5-3.5 15.8 Table 3. Expenditure of the families investigated (unit: ten thousand RMB, %). Expenditure Percentage Expenditure Percentage 0.5-1 31.1 3.5-5.5 8.5 1-2.5 38.1 > 5.5 3.3 2.5-3.5 19 (among 125 the rich, 38 of them selected the WTA ap- proach). This can be explained as the more herders be- come rich, the more time they spend outside, and learned a few technologies for making money, so livestock was no longer as important as before and they liked to forge them. Statistical analysis indicated that age, sex, and education has no significant correlation with approach selection. 3.1.2. The Restori ng Cost of WTP The frequencies of bid value w ere shown in Figure 2. In calculation process, we did some regulations. For exam- ple, among bid value being less than 50, the frequency of 20 was the highest, so we took 20 as the representative value to be computed. For the same reason, 2000 was regarded as the representative value to be computed among bid value over 1000. The regulated bid value was detailed in Table 4. Using weighted mean method, the average WTP was computed and its value was equal to 359 RMB. There were 8000 households in Maqu country. As described above, about 75 percent households, namely, 6000 households were willingness to pay for grassland restoration, so the total WTP was 0.022 × 10⁸ RMB per year. 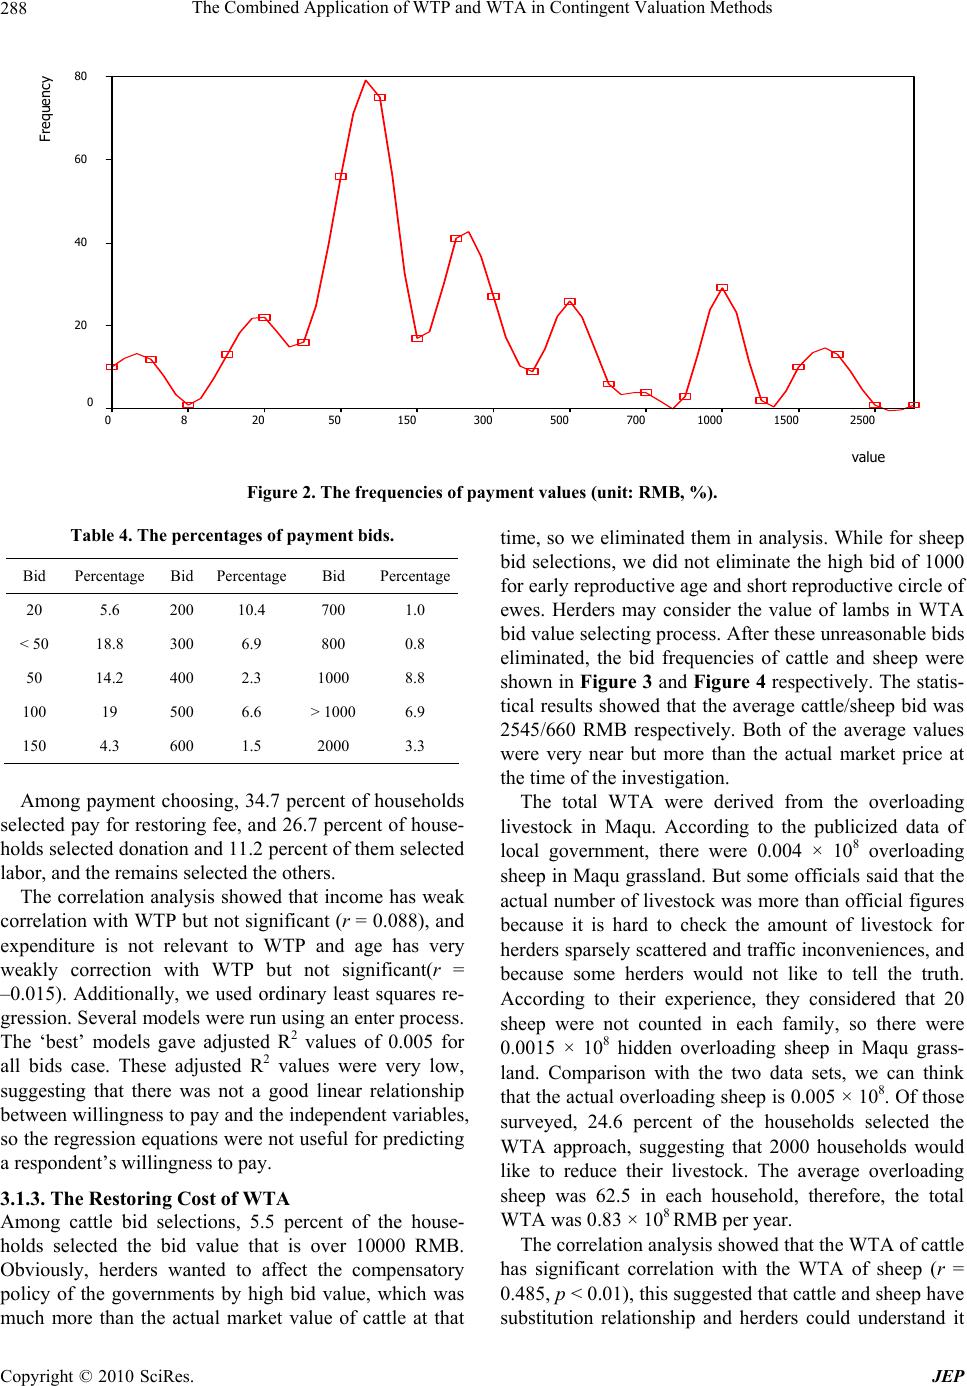 The Combined Application of WTP and WTA in Contingent Valuation Methods Copyright © 2010 SciRes. JEP 288 value 250015001000700500300150502080 Frequency 80 60 40 20 0 Figure 2. The frequenc ie s of payment values (unit: RMB, %). Table 4. The percentages of payment bids. Bid Percentage Bid Percentage Bid Percentage 20 5.6 200 10.4 700 1.0 < 50 18.8 300 6.9 800 0.8 50 14.2 400 2.3 1000 8.8 100 19 500 6.6 > 1000 6.9 150 4.3 600 1.5 2000 3.3 Among payment choosing, 34.7 percent of households selected pay for restoring fee, and 26.7 percent of house- holds selected donation and 11.2 percent of them selected labor, and the remains selected the others. The correlation analysis showed that income has weak correlation with WTP but not significant (r = 0.088), and expenditure is not relevant to WTP and age has very weakly correction with WTP but not significant(r = –0.015). Additionally, we used ordinary least squares re- gression. Several models were run using an enter process. The ‘best’ models gave adjusted R2 values of 0.005 for all bids case. These adjusted R2 values were very low, suggesting that there was not a good linear relationship between willingness to pay and the independent variables, so the regression equations were not u seful for predicting a respondent’s willingness to pay. 3.1.3. The Restori ng Cost of WTA Among cattle bid selections, 5.5 percent of the house- holds selected the bid value that is over 10000 RMB. Obviously, herders wanted to affect the compensatory policy of the governments by high bid value, which was much more than the actual market value of cattle at that time, so we eliminated them in analysis. While for sheep bid selections, we did not eliminate the high bid of 1000 for early reproductive age and short reproductive circle of ewes. Herders may consider the value of lambs in WTA bid value selecting process. After these unreasonable bids eliminated, the bid frequencies of cattle and sheep were shown in Figure 3 and Figure 4 respectively. The statis- tical results showed that the average cattle/sheep bid was 2545/660 RMB respectively. Both of the average values were very near but more than the actual market price at the time of the investigation. The total WTA were derived from the overloading livestock in Maqu. According to the publicized data of local government, there were 0.004 × 10⁸ overloading sheep in Maqu grassland. But some officials said that the actual number of livestock was more than official figures because it is hard to check the amount of livestock for herders sparsely scattered and traffic inconveniences, and because some herders would not like to tell the truth. According to their experience, they considered that 20 sheep were not counted in each family, so there were 0.0015 × 10⁸ hidden overloading sheep in Maqu grass- land. Comparison with the two data sets, we can think that the actual overloading sheep is 0.005 × 10⁸. Of those surveyed, 24.6 percent of the households selected the WTA approach, suggesting that 2000 households would like to reduce their livestock. The average overloading sheep was 62.5 in each household, therefore, the total WTA was 0.83 × 10⁸ RMB per year. The correlation analysis showed that the WTA of cattle has significant correlation with the WTA of sheep (r = 0.485, p < 0.01), this suggested that cattle and sheep have substitution relationship and herders could understand it 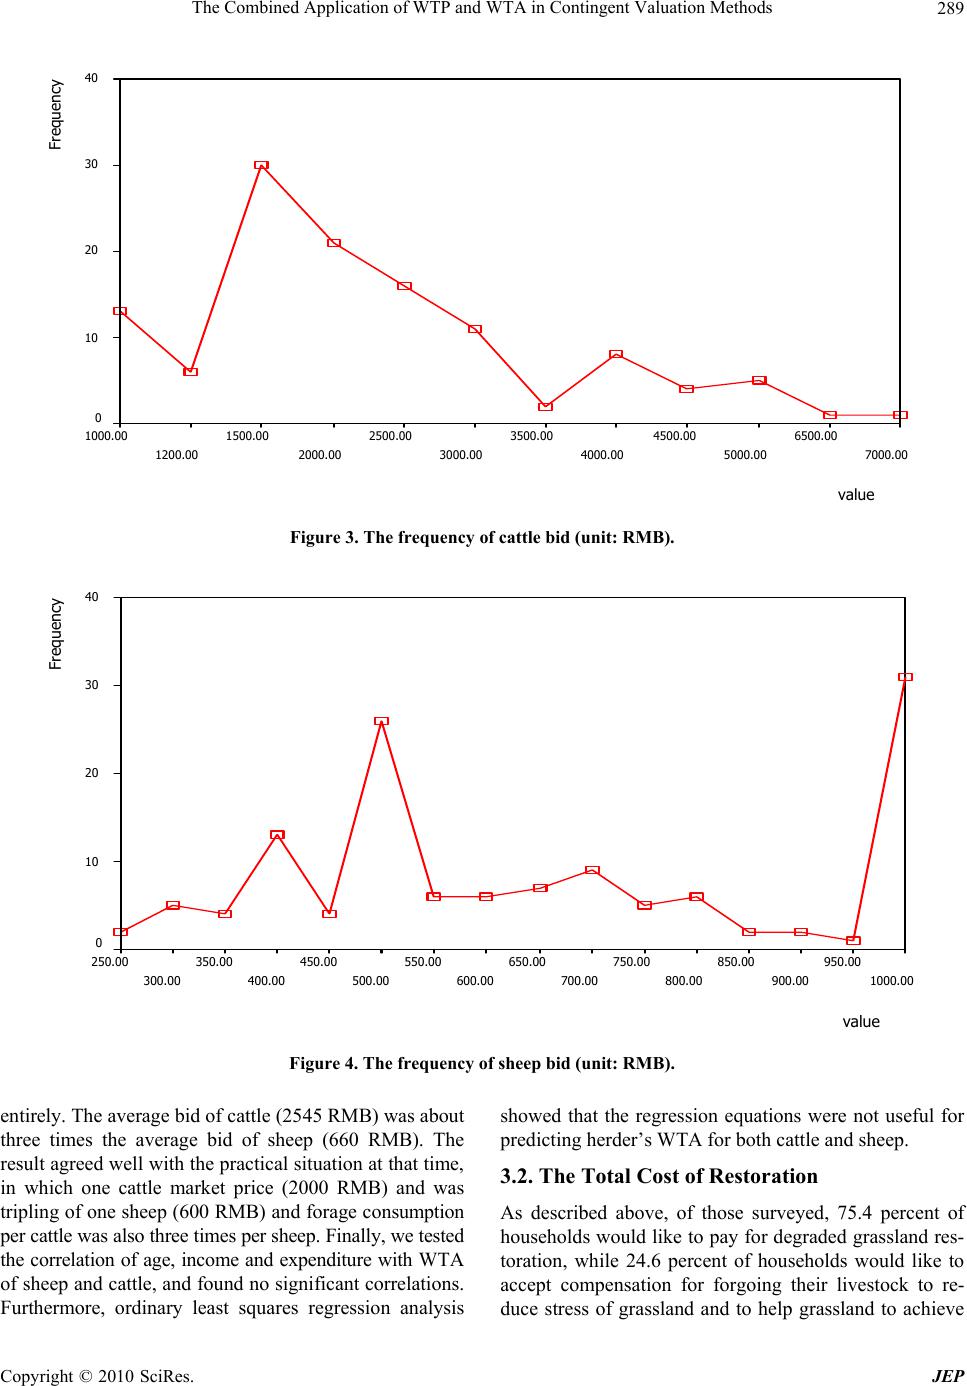 The Combined Application of WTP and WTA in Contingent Valuation Methods Copyright © 2010 SciRes. JEP 289 value 7000.00 6500.00 5000.00 4500.00 4000.00 3500.00 3000.00 2500.00 2000.00 1500.00 1200.00 1000.00 Frequency 40 30 20 10 0 Figure 3. The frequency of cattle bid (unit: RMB). value 1000.00 950.00 900.00 850.00 800.00 750.00 700.00 650.00 600.00 550.00 500.00 450.00 400.00 350.00 300.00 250.00 Frequency 40 30 20 10 0 Figure 4. The frequency of sheep bid (unit: RMB). entirely. The averag e b id of cattle (25 45 RMB) was about three times the average bid of sheep (660 RMB). The result agreed well with the practical situation at that time, in which one cattle market price (2000 RMB) and was tripling of one sheep (600 RMB) and forage consumption per cattle was also three times per sheep. Finally, we tested the correlation of age, income and expenditure with WTA of sheep and cattle, an d found no significant co rrelations. Furthermore, ordinary least squares regression analysis showed that the regression equations were not useful for predicting herder’s WTA for both cattle and sheep. 3.2. The Total Cost of Restoration As described above, of those surveyed, 75.4 percent of households would like to pay for degraded grassland res- toration, while 24.6 percent of households would like to accept compensation for forgoing their livestock to re- duce stress of grassland and to help grassland to achieve  The Combined Application of WTP and WTA in Contingent Valuation Methods Copyright © 2010 SciRes. JEP 290 natural restoration, so the total cost of Maqu grassland restoration is the sum of WTP and WTA. If we assumed that 0.0125 × 10⁸ sheep (2000 households times 62.5) will be forgone per year by households, then the total overloading sheep would be eliminated within 4 years. Meanwhile, if we assumed that the degraded grassland of Maqu needs 10 years to be restored, and divided the re- storing period into two stages, then the restoration cost was 0.85 × 10⁸ RMB per year in former 4 years, and was 0.022 × 10⁸ RMB per year in latter 6 years. The total cost of Maqu grassland restoration was 3.62 × 10⁸ RMB. For all the cost of restoratio n, WTA occupied 94% and WTP only occupied 6%, suggesting that local grassland degra- dation was mainly caused by overgrazing [22] and that the overloading livestock must be eliminated in order to achieve restoration successfully. 4. Conclusions and Discussions Ecosystem degradation is one of the most prominent global environmental problems. Therefore, to keep food safe and sustain a healthy environment, to prevent land from degrading, to restore and reconstruct degraded eco- systems, and to take effective actions to make the sus- tainable use of land resources becomes the hot spots of government organizations, non-government organizations, scientific communities, and the public alike. But in the field of restoration ecology, numerous articles address the ecological obstacles to restoring damaged ecosystems and strategies for overcoming these obstacles, little has been written regarding the question of how society to take strategies. The development of restoration ecology needs the cooperation of scientists, the government, and common people to restore the degraded ecosystem rap- idly via the processes of exchanging information, meth- ods, and experience [28,29]. CV as a social survey method, it provides a taking and communication platform to all kinds of groups that related to the environmental projects. By this platform, each group can obtain a lot of reliable information, enhancing the restoration projects process and efficiency. Based on our research, we can find that two ways can be adopted by local herders to take measures to overcome degradation. The first way is WTP way, namely, herders help degraded grassland to restore by willingness to pay for supplemental seeding and deratization and so on. The second wa y is WTA way, in which herders will be compensated for forgoing their livestock to reduce grazing press and to accelerate the natural restoration of degraded grassland. This is the first time for us to combine WTP and WTA in one question- naire. From the results of research, at present, our sug- gestion for local degraded grassland restoration is that governments would use financial fund to buy the over- loading livestock but not to fence. According to Gao [19], from 1998 to 2002, the total cumulative cost of fencing ran up to 3.9 × 10⁸ RMB. The inten tion of fenc ing was to limit the number of livestock by grassland use rights as- signed to individual households. A few years passed, the decrease in amount of livestock was little. For example, from 2000 to 2002, only 16190 livestock decreased. The average decrease was 5393 per year. If we regarded 5393 as the normal decrease in the future, then the total over- loading livestock needs approximately 100 years or so to be eliminated. Comparing the cost between fence and restoration, it is very clear that government should use fencing fund to buy the overloading livestock, but not to fence continuously. Furthermore, government should make full use of the fund collected from the local herders to cooperate the natural restoration of the degraded grassland. This will shorten the period of restoration. Another achievement resulting from our study is, in developing countries, that it is very necessary to com- pensate respondents during investigation although it is still a hot dispute topic in CV study. Based on Whitting- ton [8], CV researches working in developing countries must determine what compensation is fair for the time spend in an interview. The compensation paid must be neither too low nor too high, but ‘just right’, ‘just right’ can be based on the minimum wage or the wages of an unskilled worker. However, as he pointed out, for the truly destitute in many developing countries, almost any payment could be perceived as coercive and thus deemed unethical. This may explain intuitively that the market economy and wage mechanism in developing countries is not mature yet so that researchers could not determine the right wage, so could the responders. From what he said it is inferable that CV researchers working in developing counties need not to compensate respondents. But based on our previous surveys, we found it is unwise for CV researchers not to carry out compensation because re- spondents may be not serious-mined and patient for free answering. In order to avoid this, compensation must be taken. Although we cannot determine the right compen- sation, we can determine the necessary compensation by customs, attitudes to time of locals and by the content of survey and so on. For example, in Maqu prides of herders would be hurt if we give money to them directly, so we decided to use gifts (candy, fruit, taking pictures) as compensation methods, and found that they inclined to accept these gifts. Therefore, compensation has no fix form, and CV researches can adopt various forms ac- cording to experience of themselves and culture and pre- ferences of studied areas. The issues in this paper are: during surveying, we just permitted respondents to select one approach from be- tween the two options of WTP and WTA, and excluded those who want to take both, this may have little effects 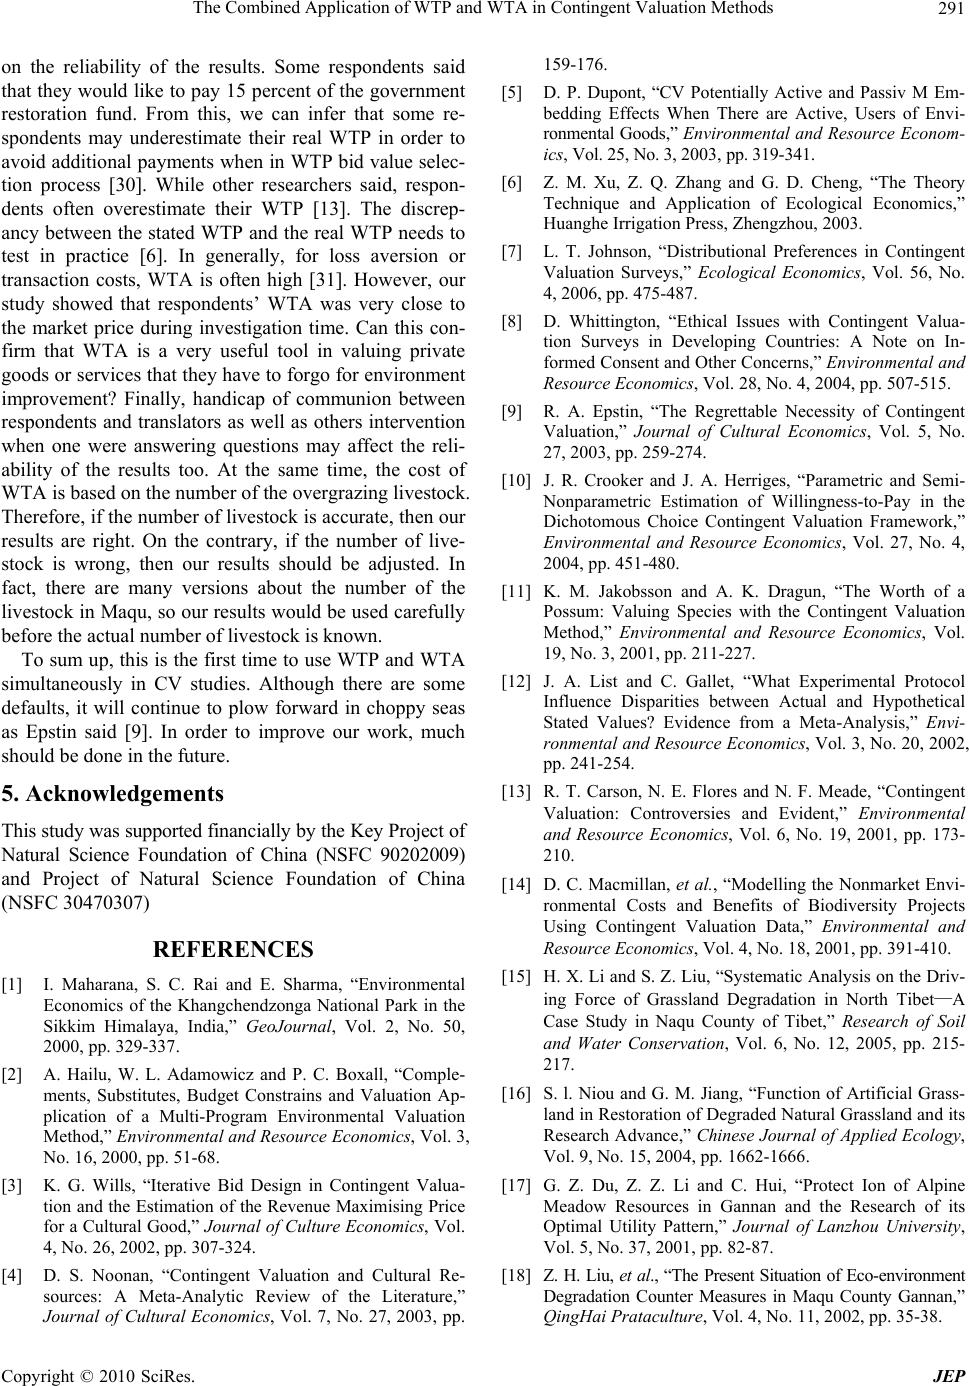 The Combined Application of WTP and WTA in Contingent Valuation Methods Copyright © 2010 SciRes. JEP 291 on the reliability of the results. Some respondents said that they would like to pay 15 percent of the government restoration fund. From this, we can infer that some re- spondents may underestimate their real WTP in order to avoid additional payments when in WTP bid value selec- tion process [30]. While other researchers said, respon- dents often overestimate their WTP [13]. The discrep- ancy between the stated WTP and the real WTP needs to test in practice [6]. In generally, for loss aversion or transaction costs, WTA is often high [31]. However, our study showed that respondents’ WTA was very close to the market price during investigation time. Can this con- firm that WTA is a very useful tool in valuing private goods or services that they have to forgo for environment improvement? Finally, handicap of communion between respondents and translators as well as others intervention when one were answering questions may affect the reli- ability of the results too. At the same time, the cost of WTA is based on the number of the overgrazing livestock. Therefore, if the number of livestock is accurate, then our results are right. On the contrary, if the number of live- stock is wrong, then our results should be adjusted. In fact, there are many versions about the number of the livestock in Maqu, so our results would be used carefu lly before the actual number of livestock is known. To sum up, this is the first time to use WTP and WTA simultaneously in CV studies. Although there are some defaults, it will continue to plow forward in choppy seas as Epstin said [9]. In order to improve our work, much should be done in the future. 5. Acknowledgements This study was supported financially by the Key Project of Natural Science Foundation of China (NSFC 90202009) and Project of Natural Science Foundation of China (NSFC 30470307) REFERENCES [1] I. Maharana, S. C. Rai and E. Sharma, “Environmental Economics of the Khangchendzonga National Park in the Sikkim Himalaya, India,” GeoJournal, Vol. 2, No. 50, 2000, pp. 329-337. [2] A. Hailu, W. L. Adamowicz and P. C. Boxall, “Comple- ments, Substitutes, Budget Constrains and Valuation Ap- plication of a Multi-Program Environmental Valuation Method,” Environmental and Resource Economics, Vol. 3, No. 16, 2000, pp. 51-68. [3] K. G. Wills, “Iterative Bid Design in Contingent Valua- tion and the Estimation of the Revenue Maximising Price for a Cultural Good,” Journal of Culture Economics, Vol. 4, No. 26, 2002, pp. 307-324. [4] D. S. Noonan, “Contingent Valuation and Cultural Re- sources: A Meta-Analytic Review of the Literature,” Journal of Cultural Economics, Vol. 7, No. 27, 2003, pp. 159-176. [5] D. P. Dupont, “CV Potentially Active and Passiv M Em- bedding Effects When There are Active, Users of Envi- ronmental Goods,” Environmental and Resource Econom- ics, Vol . 25 , No. 3 , 2003, pp. 319-341. [6] Z. M. Xu, Z. Q. Zhang and G. D. Cheng, “The Theory Technique and Application of Ecological Economics,” Huanghe Irrigation Press, Zhengzhou, 2003. [7] L. T. Johnson, “Distributional Preferences in Contingent Valuation Surveys,” Ecological Economics, Vol. 56, No. 4, 2006, pp. 475-487. [8] D. Whittington, “Ethical Issues with Contingent Valua- tion Surveys in Developing Countries: A Note on In- formed Consent and Other Concerns,” Environmental and Resource Economics, Vol. 28, No. 4, 2004, pp. 507-515. [9] R. A. Epstin, “The Regrettable Necessity of Contingent Valuation,” Journal of Cultural Economics, Vol. 5, No. 27, 2003, pp. 259-274. [10] J. R. Crooker and J. A. Herriges, “Parametric and Semi- Nonparametric Estimation of Willingness-to-Pay in the Dichotomous Choice Contingent Valuation Framework,” Environmental and Resource Economics, Vol. 27, No. 4, 2004, pp. 451-480. [11] K. M. Jakobsson and A. K. Dragun, “The Worth of a Possum: Valuing Species with the Contingent Valuation Method,” Environmental and Resource Economics, Vol. 19, No. 3, 2001, pp. 211-227. [12] J. A. List and C. Gallet, “What Experimental Protocol Influence Disparities between Actual and Hypothetical Stated Values? Evidence from a Meta-Analysis,” Envi- ronmental and Resource Economics, Vol. 3, No. 20, 2002, pp. 241-254. [13] R. T. Carson, N. E. Flores and N. F. Meade, “Contingent Valuation: Controversies and Evident,” Environmental and Resource Economics, Vol. 6, No. 19, 2001, pp. 173- 210. [14] D. C. Macmillan, et al., “Modelling the Nonmarket Envi- ronmental Costs and Benefits of Biodiversity Projects Using Contingent Valuation Data,” Environmental and Resource Economics, Vol. 4, No. 18, 2001, pp. 391-410. [15] H. X. Li and S. Z. Liu, “Systematic Analysis on the Driv- ing Force of Grassland Degradation in North Tibet—A Case Study in Naqu County of Tibet,” Research of Soil and Water Conservation, Vol. 6, No. 12, 2005, pp. 215- 217. [16] S. l. Niou and G. M. Jiang, “Function of Artificial Grass- land in Restoration of Degraded Natural Grassland and its Research Advance,” Chinese Journal of Applied Ecology, Vol. 9, No. 15, 2004, pp. 1662-1666. [17] G. Z. Du, Z. Z. Li and C. Hui, “Protect Ion of Alpine Meadow Resources in Gannan and the Research of its Optimal Utility Pattern,” Journal of Lanzhou University, Vol. 5, No. 37, 2001, pp. 82-87. [18] Z. H. Liu, et al., “The Present Situation of Eco-environment Degradation Counter Measures in Maqu County Gannan,” QingHai Prataculture, Vol. 4, No. 11, 2002, pp. 35-38.  The Combined Application of WTP and WTA in Contingent Valuation Methods Copyright © 2010 SciRes. JEP 292 [19] X. C. Gao, A. Y. Jiang and J. M. Li, “An Institutional Explanation of ‘Over Grazing’ and Institutional Design of a Control System,” Journal of Lanzhou University, Vol. 4, No. 32, 2004, pp. 116-120. [20] W. Z. Zhang, et al., “Design of Participatory Scheme of Action of Local Sustainable Development Planning,” Progress in Geography, Vol. 4, No. 24, 2004, pp. 1-10. [21] Y. S. Ma, et al., “Study on Rehabilitating and Rebuilding Technologies for Degenerated Alpine Meadow in the Changjiang and Yellow River Source Region,” Pratacul- tural Science, Vol. 19, No. 9, 2002, pp. 1-5. [22] D. X. Yue, W. L. Li and Z. Z. Li, “Analysis of AHP St ra- tegic Decision for Grazing Management System and Eco- logical Restoration in the Alpine Wetland at Gannan in Gansu,” Acta Bot Boreal Occident Since, Vol. 2, No. 24, 2004, pp. 248-253. [23] A. Clewell, J. Rieger and J. Munro, “Guidelines for De- veloping and Managing Ecological Restoration Projects,” 2nd Edition, Society for Ecological Restoration, 2000. http://www.ser.org/ [24] C. E. Cuena, et al., “An Experimental Validation of Hy- pothetical WTP for a Recyclable Product,” Environmental and Resource Economics, Vol. 3, No. 27, 2004, pp. 313- 335. [25] K. Arrow, et al., “Report of the NOAA Panel on Contin- gent Valuation Report to the General Council of the US National Oceanic and Atmospheric Administration,” Re- sources for the Future, Washington, D.C., 1993. [26] A. L. D. Nunes, C. J. M. Jeroen and D. Bergh, “Can Peo- ple Value Proection against Invasive Marine Specise? Evidence from a Joint TC-CV Survey in the Netherlands,” Environmental and Resource Economics, Vol. 5, No. 28, 2004, pp. 517-532. [27] K. Veiten, H. F. Hoen and J. Strand, “Sequencing and the Adding-up Property in Contingent Valuation of Endan- gered Species: Are Contingent Non-Use Values Economic Values,” Environmental and Resource Economics, Vol. 6, No. 29, 2004, pp. 419-433. [28] K. D. Holl and R. B. Howarth, “Paying for Restoration,” Society for Ecological Restoration, Vol. 3, No. 8, 2000, pp. 260-276. [29] H. Ren, et al., “Degraded Ecosystem in China: Statue, Causes, and Restoration Efforts,” Landscape and Eco- logical Engineering, Vol. 3, No. 1, 2007, pp. 1-13. [30] Y. Qian and X. Y. Tang, “Environmental Protection and Sustainable Development,” Higher Education Press, Bei- jing, 2004. [31] W. M. Hanemann, “The Economic Theory of WTP and WTA,” In: I. J. Bateman and K. G. Willis, Eds., Valuing Environmental Preferences: Theory and Practice of the Contingent Valuation Method in the US, EU, and Devel- oping Countries, Oxford University Press, Edward Elgar Press, Great Britain, 1999, pp. 43-93. |