Paper Menu >>
Journal Menu >>
 Journal of Environmental Protection, 2010, 1, 278-283 doi:10.4236/jep.2010.13033 Published Online September 2010 (http://www.SciRP.org/journal/jep) Copyright © 2010 SciRes. JEP Van Panchayats as an Effective Tool in Conserving Biodiversity at Local Level Vardan Singh Rawat, Yashwant Singh Rawat Department of Botany, D.S.B. Campus, Kumaun University, Nainital, India. Email: singhvardan@rediffmail.com Received April 3rd, 2010; revised May 13th, 2010; accepted May 15th, 2010. ABSTRACT Forest vegetation of a community managed forest was studied along four aspects. Quercus leucotrichophora and Pinus roxburghii was the dominant species on each of the two aspects. Across the aspects the total tree density ranged be- tween 193 to 324.3 in d /ha, sapling density between 119 to 258.6 ind/ha and seedling density from 249.98 to 845 ind/ha. The shrub density varied from 199.99 to 406.32 ind/ha and herb density from 9466.66 to 52483.33 ind/ha. The total basal area varied from 0.06 to 7.15 m2/ha at eastern and north facing aspect for Quercus leucotrichophora and Pinus roxburghii respectively showing that the forest is in young stage. Species diversity value for tree layer varied from 0.21 to 1.23 while concentration of dominance value ranged from 0.56 to 0.94. It was noticed that with an increase in spe- cies diversity concentration of dominance value decreases indicating inverse relationship between diversity and domi- nance. Keywords: Van Panchayat, Aspect, Diversity, Bhatkholi, Community Managed Forest 1. Introduction The Central Himalaya, accounts for 8.68% of the total Indian Himalayan area (59436 km2) and harbours rich biodiversity due to geographical and geological peculi- arities subtending a wide range of vegetation types [1]. The Himalayan biodiversity is severely threatened by natural and anthropogenic means. The various distur- bances present in the area are eroding this rich biological diversity day by day and have led to the expansion of xerophytic conditio ns [2]. The majority of the populatio n in the region is agricultural and pastoral. Forests present around the agricultural fields are highly degraded due to continuous anthropogenic disturbances. Villagers fre- quently graze their cattle in the adjoining forest which influence the pressure beside this accidental fire also the main cause for degradations the forest. The exploitive management practices and the biotic stress exerted by hill population in relation to oak sp ecies have enco uraged the pine in various ways [3]. Much of the area now occu- pied by pine was originally under the potential natural vegetation of oaks [4]. Conversion of oak forests to pine is still proceeding on larger scale this trend may lead to ultimate disappearance of the oak forest from the region. A reversal of this trend requires a through evaluation of current management practices including local people participation. The proportion of the old growth forests are being removed at a faster rate than young forests are being constitu ted, as a result the prop ortion of the middle aged forest is not stabilized, but is instead increasing [3]. In order to maintain such a structure of forests indefi- nitely, heavy subsidy in the form of cultural practices is required. Conservation of biological resources under community based conservation system is a key tool to lessen the depletion of biodiversity. Various program- mmes have been implemented, for the conservation of biological resources in the Indian Himalaya under the protected area network. The active participation and involvement of local peo- ple either at community or individual level is essential towards conservation of the forest and other natural re- sources. The Van Panchayats represent one of the largest and most diverse experiments in devolved common property management ever developed [5]. Most of the Van Panchayat in Uttarakhand were initiated after for- mation of Van Panchayat Act in 1931, on degraded sites under the control of the State Revenue Department. The Van Panchayats have been sustainably managing their forests for decades without any financial support. Ac- cording to recent estimates, there are about 12,089 Van  Van Panchayats as an Effective Tool in Conserving Biodiversity at Local Level Copyright © 2010 SciRes. JEP 279 Panchayats managing an area of 544965 hectares. The area under each Van Panchayat ranges from a fraction of a hectare up to over 2000 hectares [6]. The Community forests managed in accordance with Van Panchayat Act is a hybrid of state ownership and community responsi- bility. In contrast to civil forests, community forests are not open forests. Access and use of forests is guided by rules elaborately designed and implemented by the communities. A major objective of Van Panchayat is to rejuvenate and manage patches of civil soyam forests for local use; it also prevents neighbouring villages from intruding into this zone, once formally demarcated as a Van Panchayat forest. In the present study we have tried to access the impor- tance of management practices of the Van Panchayat on conserving and regenerating forest under their control. 2. Materials and Method The present study has been carried out in the Van Pan- chayat forest of Bhatkhoi situated between 29°32.98’- 29°34.32’ N latitud es and 79°41.44'-79 °43.2' E longitude of Lamgara Developmental Block of Almora District (Uttarakhand), where villagers pu t efforts to conserve the surrounding forest (approximately 10.12 ha). The basic climate pattern is governed by the monsoon rhyth m. The annual rainfall varied from 832.0 mm to 921.9 mm, mean maximum temperature from 16.7℃ to 32.6℃ and the mean minimum temperature from 5.8℃ to 19.5℃ [7]. Rock types mainly comprises of schist, micaceous quar- tizimeta morphism, plutonic bodies of granodiorites and granites [8]. The vegetation type mainly co mpris es H ima- layan moist temperate oak forest, subtropical pine forest. The dominated tree species of the Van Panchayat are Quercus leucotrichophora, Pinus roxburghii, Rhododen- dron arboreum, and Myrica esculenta. Information re- garding the vegetation was collected through question- naires which will be distributed to the villagers of the Van Panchayats. The house holds were selected ran- domly on the basis of number of family members and categorized in to small (< 4), medium (5 -9) and larger (> 10). Estimations also made by actual observations of the number of head loads removed daily, actual number of days in a year in which collection is done, number of hours and the frequency of collection by each family. Four aspects south west, east, north west, and north were identified with in each aspect trees were analysed by placing randomly 10,100 m2 circular quadrats, the size and number of samples was determined following [9]. Sapling, seedling and shru b were studied in 10, 5 × 5 m2 quardrats placed randomly. The vegetational data were calculated for density, frequency, abundance [10]. Im- portance value index for trees was determined as the sum of the relative density relative frequency, relative domi- nance [11]. Individuals of the tree species were divided in to three classes, Trees were consider to be individual > 30 cm cbh (Circumference at breast height), Sapling 10-30 cm cbh and seedling < 10 cm cbh [3]. Species richness was determined following [12]. Species diversity was computed by using Shannon-Wiener’s Index [13] and Concentration of dominance (CD) was calculated fol- lowing [14] . 3. Results 3.1. Tree Layer The total tree density ranged between 193 to 324.3 ind/ha and total basal area ranged between 5.26 and 9.41 m2/ha among all the aspects (Table 1). The highest tree density was that of Pinus roxb urghii (275 ind/ha) at north facing aspect, where the lowest tree density was that of Rhodo- dendron arboreum and Quercus leucotrichophora (6.6 ind/ha each) at north west and eastern aspect respectively. The Pinus roxburghii was the most dominant species in term of the total basal area and IVI (7.15 m2/ha and 287.97%) at north and eastern aspect respectively. Spe- cies diversity value for trees varied from 0.21 to 1.23 at east and north west facing aspect where as the concentra- tion of dominance value ranged from 0.56 to 0.94 on north west and eastern aspect. 3.2. Sapling Layer The total sapling density ranges from 119 to 258.6 (ind/ ha) at eastern and north west aspect. Across all the aspect the total sapling density of individual species ranged from 6.6 ind/ha to 173 ind/ha each at north west aspect for Pinus roxburghii and Quercus leucotrichophora. The most dominant species was Pinus roxburghii (IVI = 228.71%) at eastern aspect, however the total basal area was highest for the same species (0.49 m2/ha) at northern aspect (Table 2). Species diversity value for sapling layer varied from 0.75 to 1.32 which was highest on north west aspect and lowest on east where as the concentration of dominance value ranged from 0.45 to 0.66 at south west and eastern aspect (Table 3). 3.3. Seedling Layer The total seedling density varied from 249.98 to 845 ind/ha at north and north west aspect respectively. The seedling density was highest for Quercus leucotrichoph- ora at the north west aspect (626 ind/ha) and lowest on north facing aspect for Quercus leucotrichophora (16.66 ind/ha). Species diversity value for seedling layer varied from 1.06 to 1.64 on south west and north facing aspect respectively while the concentration of dominance value ranged from 0.09 to 0.58 on north and north west aspect respectively (Table 3).  Van Panchayats as an Effective Tool in Conserving Biodiversity at Local Level Copyright © 2010 SciRes. JEP 280 Table 1. Vegetational parameters for tree and sapling layers. Tree Sapling Aspect Species Density (ind/ha) TBA (m2/ha) IVI (%) Density (ind/ha) TBA (m2/ha) IVI (%) Quercus leucotrichophora 153 4.13 219.84 86 0.34 160.32 Pinus roxburghii 20 0.32 35.17 60 0.28 116.63 Myrica esculenta 20 0.84 45 13 0.03 23.04 South West Total 193 5.29 300 159 0.658 299.99 Quercus leucotrichophora 173 4.33 182.59 173 0.6 192.16 Rhododendron arboreum 6.6 0.86 21.08 53 0.18 42.63 Pinus roxburghii 26 0.41 38.89 6.6 0.02 53.07 Myrica esculenta 33 1.09 57.44 26 0.18 12.13 North West Total 238.6 6.69 300.00 258.6 0.98 299.99 Quercus leucotrichophora 6.6 0.061 12.04 26 0.11 71.28 Pinus roxburghii 200 5.2 287.97 93 0.34 228.71 East Total 206.6 5.26 300 119 0.45 299.99 Quercus leucotrichophora 8.3 0.15 11.31 40 0.1 68.52 Rhododendron arboreum 16 0.74 27.1 - - - Pinus roxburghii 275 7.15 225.05 93 0.49 192.74 Myrica esculenta 25 1.37 36.53 13 0.03 38.73 North Total 324.3 9.41 300 146 0.62 299.99 3.4. Shrub Layer The shrub density is highest for Pyracantha crenulata (366.66 ind/ha) at north west aspect while lowest 6.66 ind/ha each for Urtica dioica, Carex nubigena and Ber- beris asiatica at south west, north west and east facing aspect respectively (Table 2). The Species diversity value was highest on north west facing aspect (0.63) and low- est on north west aspect (0.21), however the concentra- tion of dominance value varied from 0.79 to 0.93 on north and east aspect respectively. 3.5. Herb Layer The total herb density varied from 7866.66 to 52,483.33 ind/ha at east and northern aspect respectively. Among all the aspect Apluda mutica was the most abundant herb present on all the four aspect having highest density value 11333.34 ind/ha on north west aspect. The least density were shown by Ocimum americanum (66.67 ind/ ha) on the north west aspect. The Species diversity value was highest on south west (2.01) and lowest on north west aspect (0.84), however the concentration of domi- nance value ranged from 0.39 to 0.69 on south west and north west aspect respectively (Table 3). 3.6. Regeneration The population structure of some dominant species is given in Figure 1. The seedlings and saplings of Quercus leucotrichophora were present on all the aspect. On east- ern aspect number of Quercus leucotrichophora seed- lings was higher where as saplings was higher on north- ern aspect. Trees of Quercus leucotrichophora were pre- sent in the younger girth classes (30-60 cm) indicating good regeneration status of this species while Pinus rox- burghii saplings and seedlings were higher at south western aspect, similarly the majority of trees of this species was that of younger and in the girth class of 30-60 cm (Figure 1(c)). Conversion of seedlings to sap- lings and saplings to trees of Quercus leucotrichophora was satisfactory indicating well regeneration pattern and effective forest management. 4. Discussion The value of total tree density (193 to 324.3 ind/ha) re- ported in the present study falls within the range values reported earlier by [6,15,16] for different central Hima-  Van Panchayats as an Effective Tool in Conserving Biodiversity at Local Level Copyright © 2010 SciRes. JEP 281 Table 2. Density (ind/ha) for seedling, shrub and herb layers. Species Aspect Seedling South West North West East North Quercus leucotrichophora 266 626 173 16.66 Rhododendron arboreum - 20 - 33.33 Myrica esculenta 73 173 53 133.33 Pinus roxburghii 26 26 26 66.66 Total 365 845 252 249.98 Shrub Prinsepia utilis 13.33 - - - Pyracantha crenulata 240 366.66 193.33 325 Urtica dioica 6.66 - - - Berberis asiatica - 20 6.66 33.33 Rubus ellipticus - - - 8.33 Carex nubigena - 6.66 - - Pyrus pashia - 13 - - Total 259.99 406.32 199.99 366.66 Herb Apluda mutica 11200 11333.34 6933.34 6266.67 Galium aparine 800 - - 266.68 Themeda anathera 2100 - 133.34 - Rosea brocera 1000 - - - Setaria homonyma 2200 - - - Hypericum elodeoides 250 - - - Anaphalis contor ta 600 - - 266.67 Desmodium podocarpum 800 200 666.67 533.34 Anaphalis busua - - - 2266.68 Oplismenus compositus - 2066.67 133.34 - Micromeria biflora - 133.34 - - Ocimum americanum - 66.67 - 266.67 Carex nubigena - - - 400 Total 18,950 13,800 7,866.66 52,483.33 layan oak and pine forest (280-1680 ind/ha). The sap- lings and seedling density of Quercus leucotrichophora were higher on north western aspect where as eastern aspect shows least density. The lower density on eastern was due to encr o achmen t of fuelwo od, fodder and an imal grazing by villagers. Conversion of seedlings to saplings and saplings to trees of Quercus leucotrichophora was satisfactory indicating well regeneration pattern and ef- fective forest management. It is interesting that the previous research on chirpine indicates that pine is good reproducer not only in its own forest but also in other forest [9] and the replacement of 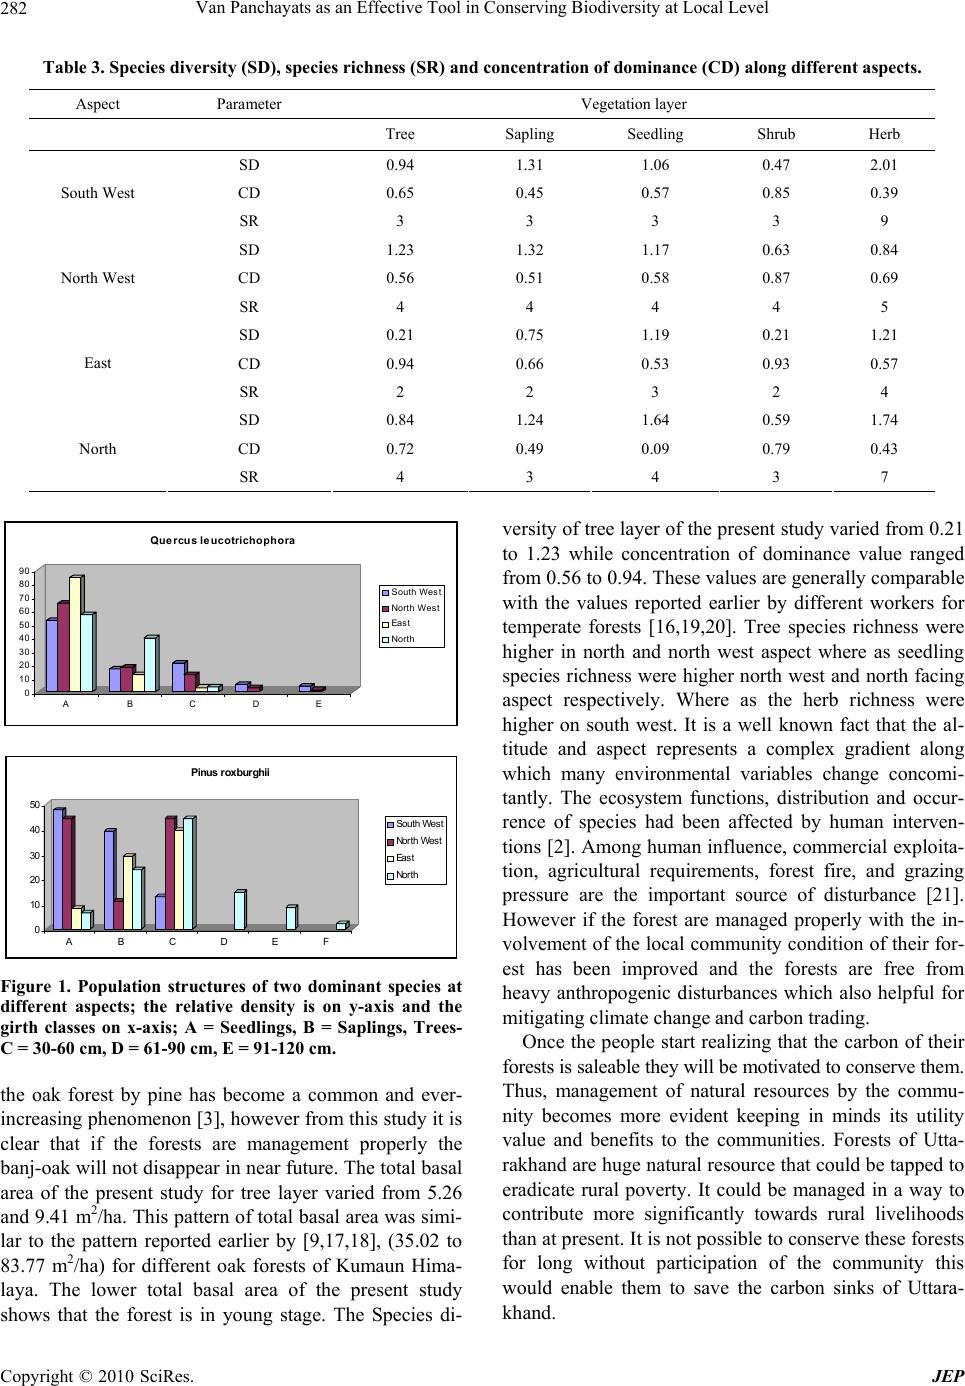 Van Panchayats as an Effective Tool in Conserving Biodiversity at Local Level Copyright © 2010 SciRes. JEP 282 Table 3. Species diversity (SD), species richness (SR) and concentration of dominance (CD) along different aspects. Aspect Parameter Vegetation layer Tree Sapling Seedling Shrub Herb SD 0.94 1.31 1.06 0.47 2.01 CD 0.65 0.45 0.57 0.85 0.39 South West SR 3 3 3 3 9 SD 1.23 1.32 1.17 0.63 0.84 CD 0.56 0.51 0.58 0.87 0.69 North West SR 4 4 4 4 5 SD 0.21 0.75 1.19 0.21 1.21 CD 0.94 0.66 0.53 0.93 0.57 East SR 2 2 3 2 4 SD 0.84 1.24 1.64 0.59 1.74 CD 0.72 0.49 0.09 0.79 0.43 North SR 4 3 4 3 7 0 10 20 30 40 50 60 70 80 90 ABCDE Quercus leucotrichophora South West Nor t h W e st East North 0 10 20 30 40 50 ABCDEF Pinus roxburghii So uth We st North West Eas t North Figure 1. Population structures of two dominant species at different aspects; the relative density is on y-axis and the girth classes on x-axis; A = Seedlings, B = Saplings, Trees- C = 30-60 cm, D = 61-90 cm, E = 91-120 cm. the oak forest by pine has become a common and ever- increasing phenomenon [3], howeve r from this study it is clear that if the forests are management properly the banj-oak will not disappear in n ear future. The total basal area of the present study for tree layer varied from 5.26 and 9.41 m2/ha. This p attern of total basal area was simi- lar to the pattern reported earlier by [9,17,18], (35.02 to 83.77 m2/ha) for different oak forests of Kumaun Hima- laya. The lower total basal area of the present study shows that the forest is in young stage. The Species di- versity of tree layer of the present study varied from 0.21 to 1.23 while concentration of dominance value ranged from 0.56 to 0.94. These values are generally comparable with the values reported earlier by different workers for temperate forests [16,19,20]. Tree species richness were higher in north and north west aspect where as seedling species richness were higher north west and north facing aspect respectively. Where as the herb richness were higher on south west. It is a well known fact that the al- titude and aspect represents a complex gradient along which many environmental variables change concomi- tantly. The ecosystem functions, distribution and occur- rence of species had been affected by human interven- tions [2]. Among human influence, commercial exploita- tion, agricultural requirements, forest fire, and grazing pressure are the important source of disturbance [21]. However if the forest are managed properly with the in- volvement of the local community co ndition of their for- est has been improved and the forests are free from heavy anthropogenic disturbances which also helpful for mitigating climate change and carbon trading. Once the people start realizing that the carbon of their forests is saleab le they will be motivated to conserve them. Thus, management of natural resources by the commu- nity becomes more evident keeping in minds its utility value and benefits to the communities. Forests of Utta- rakhand are huge natural resource that could be tapped to eradicate rural poverty. It could be managed in a way to contribute more significantly towards rural livelihoods than at present. It is not po ssible to conserve these forests for long without participation of the community this would enable them to save the carbon sinks of Uttara- khand.  Van Panchayats as an Effective Tool in Conserving Biodiversity at Local Level Copyright © 2010 SciRes. JEP 283 5. Acknowledgements Authors are thankful to Dr. Ashish Tewari department of forestry Kumaun University, Nainital for valuable sug- gestions and Department of Forestry and Botany for pro- viding necessary facilities and en co urag ement thro ugh ou t the study period. Authors are also thankful to G.B. Pant Institute of Himalayan Environment and Development (GBPIHED) Kosi Katarmal, Almora (Uttarakhand) for financial assistance. REFERENCES [1] H. C. Rikhari, B. S. Adhikari and Y. S. Rawat, “Woody Species Composition of Temperate Forests along an Ele- vational Gradient in Indian Central Himalaya,” Journal of Tropical Forest Science, Vol. 10, No. 2, 1997, pp. 197- 211. [2] J. S. Singh and S. P. Singh, “Forest Vegetation of the Himalaya,” Botanical Review, Vol. 53, No. 1, 1987, pp. 80-192. [3] A. K. Saxena, S. P. Singh, and J. S. Singh, “Population Structure of Forest of Kumaun Himalaya: Implications for Management,” Journal of Environment Management, Vol. 19, 1984, pp. 307-324. [4] H. G. Champion and S. K. Seth, “A Revised Survey of the Forest Types of India,” Government of India, Pub. Division, New Delhi, 1968, p. 404. [5] J. E. M. Arnold and W. C. Stewart, “Common Property Resource Management in India,” Oxford Forestry Insti- tute, Oxford, 1991, p. 14. [6] B. S. Jina, “Monitoring and Estimation of Carbon Se- questration in Oak and Pine Forest of Varying level of Disturbances in Kumaun Central Himalaya,” Ph.D. The- sis, Kumaun University, Nainital, 2006. [7] B. S. Jina, P. Sah, M. D. Bhatt and Y. S. Rawat, “Esti- mating Carbon Sequestration Rates and Total Carbon Stockpile in Degreded and Non-Degreded Sites of Oak and Pine Forest of Kumaun Central Himalaya,” Ecoprint, Vol. 15, 2008, pp. 75-81. [8] K. S. Valdiya, “Geology of Kumaun Lesser Himalaya,” Wadia Institute of Himalayan Geology, Dehradun, 1980, p. 291. [9] A. K. Saxena and J. S. Singh, “A Phytosociological Ana- lysis of Woody Species in Forest Communities of a Part of Kumaun Himalaya,” Vegetation, Vol. 50, No. 1, 1982, pp. 3-22. [10] J. T. Curtis and R. P. McIntosh, “The Interrelations of Certain Analytic and Synthetic Phytosociological Char- acters,” Ecology, Vol. 31, No. 3, 1950, pp. 438-455. [11] J. T. Curtis, “The Vegetation of Wiscousin. An Ordina- tion of Plant Community,” University Wisconsin Press, Madison, 1959, p. 657. [12] R. H. Whittaker, “Evolution and Measurement of Species Diversity,” Taxon, Vol. 21, No. 2-3, 1972, pp. 213-251. [13] C. E. Shannon and W. Weaver, “The Mathematical The- ory of Communication,” University of Illinois Press, Ur- bana, 1949. [14] E. H. Simpson, “The Measurement of Diversity,” Nature, 1949, pp. 163-688. [15] S. P. Singh, B. S. Adhikari and D. B. Zobel, “Biomass Productivity, Leaf Longevity and Forest Structure in Central Himalaya,” Ecological Monographs, Vol. 64, No. 4, 1994, pp. 401-421. [16] G. Kharkwal, “Qualitative Analysis of Tree Species in Evergreen Forests of Kumaun Himalaya, Uttarakhand, India,” African Journal of Plant Science, Vol. 3, No. 3, 2009, pp. 49-52. [17] N. Upreti, “A Study on Phytosociology and State of Re- generation of Oak Forests of Nainital,” Ph.D. Thesis, Kumaun University, 1982, p. 481. [18] P. K. Ralhan, A. K. Saxena and J. S. Singh, “Analysis of Forest Vegetation in and around Nainital in Kumaun Hi- malaya,” Proceedings of the Indian National Science Academy, Vol. 48, 1982, pp. 122-138. [19] V. S. Rawat and A. Chandhok, “Phytosociological Analysis and Distribution Patterns of Tree Species: A Case Study from Govind Pashu Vihar, National Park, Uttarakhand,” New York Science Journal, Vol. 2, No. 4, 2009, pp. 58-63. [20] A. K. Srivastava, A. Tewari, S. Shah and B. Tewari, “Species Composition and Regeneration Pattern along a Transect Perpendicular to a River Course in Foot Hill Deciduous Tropical Forest of Kumaun,” Indian Journal of Forestry, Vol. 31, No. 1, 2008, pp. 7-12. [21] J. S. Singh and S. P. Singh, “Forest of Himalaya: Struc- ture, Functioning and Impact of Man,” Gyanodaya Prakashan, Nanital, 1992. |