Paper Menu >>
Journal Menu >>
 Vol.2, No.9, 989-996 (2010) Health doi:10.4236/health.2010.29146 Copyright © 2010 SciRes. Openly accessible at http://www.scirp.org/journal/HEALTH/ An exploratory study on perceived relationship of alcohol, caffeine, and physical activity on hot flashes in menopausal women Jay Kandiah, Valerie Amend* Department of Family and Consumer Sciences, Ball State University, Muncie, USA; *Corresponding Author: vaamend@bsu.edu Received 30 May 2010; revised 25 June 2010; accepted 1 July 2010. ABSTRACT This study examined the effects of caffeine, al- cohol, and physical activity (PA) on the per- ceived frequency and severity of hot flashes in menopausal women. Female employees at a Mid-Western university were invited to partici- pate in an on-line survey. The 26-itemized Wo- men’s Health Survey (WHS) included questions regarding demographics, menopausal stage, ex- perience of hot flashes, consumption of caf- feinated beverages and alcohol, and participa- tion in PA. One-hundred and ninety-six women completed the study. Ordinary Least Squares regressions revealed PA, caffeine, and alcohol intake were significant in predicting the severity of hot flashes (R2 = 0.068, F(6,180) = 2.195, p = 0.046), though they did not predict frequency of hot flashes (R2 = 0.043, F(6,184) = 1.39, p = 0.221). Participation in aerobic PA increased frequency of hot flashes (p = 0.031); while higher intensity of aerobic PA had an inverse relationship on both frequency and severity of hot flashes (p = 0.011, p = 0.003, respectively). Spearman corre- lations demonstrated a positive relationship between caffeinated soda intake and frequency (r = 0.17, p = 0.06) and severity (r = 0.19, p = 0.04) of hot flashes. Beverage consumption and PA may predict severity of hot flashes in women. Less frequent, higher intensity aerobic PA may lead to fewer, less severe hot flashes. Keywords: Hot Flashes; Caffeine; Alcohol; Physical Activity 1. INTRODUCTION Menopausal hot flashes, with varying degrees of severity, are a significant concern for women across the world. There are more than 40 million women in the United States over the age of 40, and it is estimated that ap- proximately 46 million women in the U.S. will have reached menopause by the year 2020 [1]. Seventy-five percent of women over the age of 50 will experience hot flashes to some degree. For some, eight to ten flashes a day is not uncommon, interfering with their daily lives (North American Menopause Society) [2]. Episodes may last from 30 seconds to five minutes, generally averag- ing four minutes [1]. Women with hot flashes are more likely to experience disturbed sleep, depressive symp- toms and significant reductions in quality of life as compared to asymptomatic women [3]. These symptoms may continue to occur for 5 years or more [4]. Geo- graphic variation in the frequency of this phenomenon may be related to the diet and lifestyle of the area [1]. However, little research is available on the relationship of these factors to hot flashes. A hot flash is described as a transient episode of flush- ing, sweating and a sensation of heat, often accompanied by palpitations and a feeling of anxiety, and sometimes followed by chills [5]. While the exact cause and mecha- nism is not well understood, there is a prevailing theory. As estrogen levels are decreased in women, due to sur- gery, chemicals, or age, the temperature regulation me- chanism in the hypothalamus is affected. As a result, the core body temperature is lowered, and the threshold be- tween acceptable and unacceptable body heat levels is more easily crossed. This causes signals to be sent to the rest of the body to release heat, causing perspiration from the sweat glands, leading to the dramatic rise in skin temperature associated with menopausal hot flashes [5]. Several factors have been studied for their contribu- tions to the severity and frequency of hot flashes in menopausal women. Among those are dietary intake, biological factors, and modifiable behaviors. Studies  J. Kandiah et al. / HEALTH 2 (2010) 989-996 Copyright © 2010 SciRes. Openly accessible at http://www.scirp.org/journal/HEALTH/ 990 have also demonstrated a link between inten sity and frequency of physical activity and characteristics of hot flashes. Some have found that increased activity leads to increase in menopausal symptoms; while others show that a more active lifestyle may lead to a decrease in occurrence [6-10]. According to current studies, women have reported alcohol consumption as precursors to hot flashes, with research both supporting and refuting this claim [1-3,5,9-11]. Others report a link between caffeine ingestion and menopausal symptoms; however, minimal research has been completed on this factor [7]. With new data regarding the association between these variables and characteristics of menopausal hot flashes, the need to more clearly define lifestyle recom- mendations for menopausal women has arisen. The pur- pose of this research study was to examine the effects of consumption of caffeine, alcoholic beverages, and phy- sical activity on the perceived frequency and severity of hot flashes in menopausal women. 2. METHODS 2.1. Participants Female employees at a Mid-Western University were invited to participate in an on-line survey. The inclusion criteria for participants were: 1) ≥ 40 years of age; 2) devoid of taking medications for treatment of meno- pausal symptoms; 3) absence of smoking; and 4) educa- tional status of sixth grade or higher. The recruitment email informed participants of the following parameters related to the study: their random selection, criteria for participating, purpose of research procedures, and ap- proximate time needed to participate in the study. Sub- jects were informed that by completing and submitting the survey, they were giving their consent. Duration for completion of the survey was one month. Ball State University’s Institutional Review Board approved all aspects of this study. 2.2. Instrumentation The 26-itemized Women’s Health Survey (WHS), de- veloped by the researchers, was accepted for face valid- ity by three experts (two dietitians, one physician). Re- liability was established by utilizing a small (n = 20) sample of subjects other than the study population who were of similar characteristics. Subjects took the survey twice, with two weeks between each administration. Test-retest results were observed from the same partici- pants to assess similarity of answers for each test. The Kappa coefficients from the test-retest ranged from a low of 0.44 to 1.00, with a median coefficient of 0.77. Except for two questions where the Kappa coefficient could not be calculated due to zero variance in responses, all coefficients were statistically significant (see Appen- dix). The WHS included questions regarding demographics, stage of menopause, hot flashes, average daily consump- tion of caffeinated beverages, alcohol, and participation in physical activity. Caffeinated beverages were divided into subcategories based on usual number of servings. Weekly consumption of coffee, tea, and cocoa were listed as eight fluid ounces (236.56 mL), while energy drinks and soda were 12 fluid ounces (354.84 mL). In- take of caffeinated pills, diet pills containing caffeine, and dark chocolate were also recorded. Usual weekly intake of alcoholic beverages was divided into subcate- gories, namely, beer (12 fluid ounces, 354.84 mL), white wine or champagne (5 fluid ounces, 147.85 mL), red wine (5 fluid ounces, 147.85 mL), and mixed drinks (1.5-2 fluid ounces, 44.36-59.14 mL). Usual physical activity per week assessed separately 30 minute intervals of aerobic (e.g. running) and strength activity (e.g. weight lifting). Usual intensity of physical activity was measured using descriptors mild (don’t break a sweat during activity), moderate (break a light sweat), or heavy intensity (break a sweat, heart rate very increased). Usual daily frequency and severity of hot flashes were evaluated with rating scales. The subjective 10-point rating scale ranged from 1 being very mild (a warm sen- sation without sweating or disruption of normal activity) to 10 being very severe (heat sensation with sweating that may have interrupted daily activities) [5]. 2.3. Statistical Analysis Separate ordinary least squares (OLS) regressions were used to evaluate frequency and severity of hot flashes. Level of self-reported physical activity, average daily caffeine, and alcohol intake were the predictors. Spear- man rank correlations were used to examine the rela- tionships of categories of beverage intake levels with hot flash frequency and severity. This analysis was per- formed in order to look at beverages individually after excluding those who never consumed the beverage in the last week. Significance was established at p < 0.05. 3. RESULTS 3.1. Demographics and Menopausal Characteristics One-hundred and ninety-six women successfully com- pleted the study. As observed in Table 1, more than half were 50-59 years, Caucasian, and in the naturally post- menopausal reproductive stage. Most participants had experienced hot flashes (81.1%), and were not taking medications (92.9%) or using alternative therapies 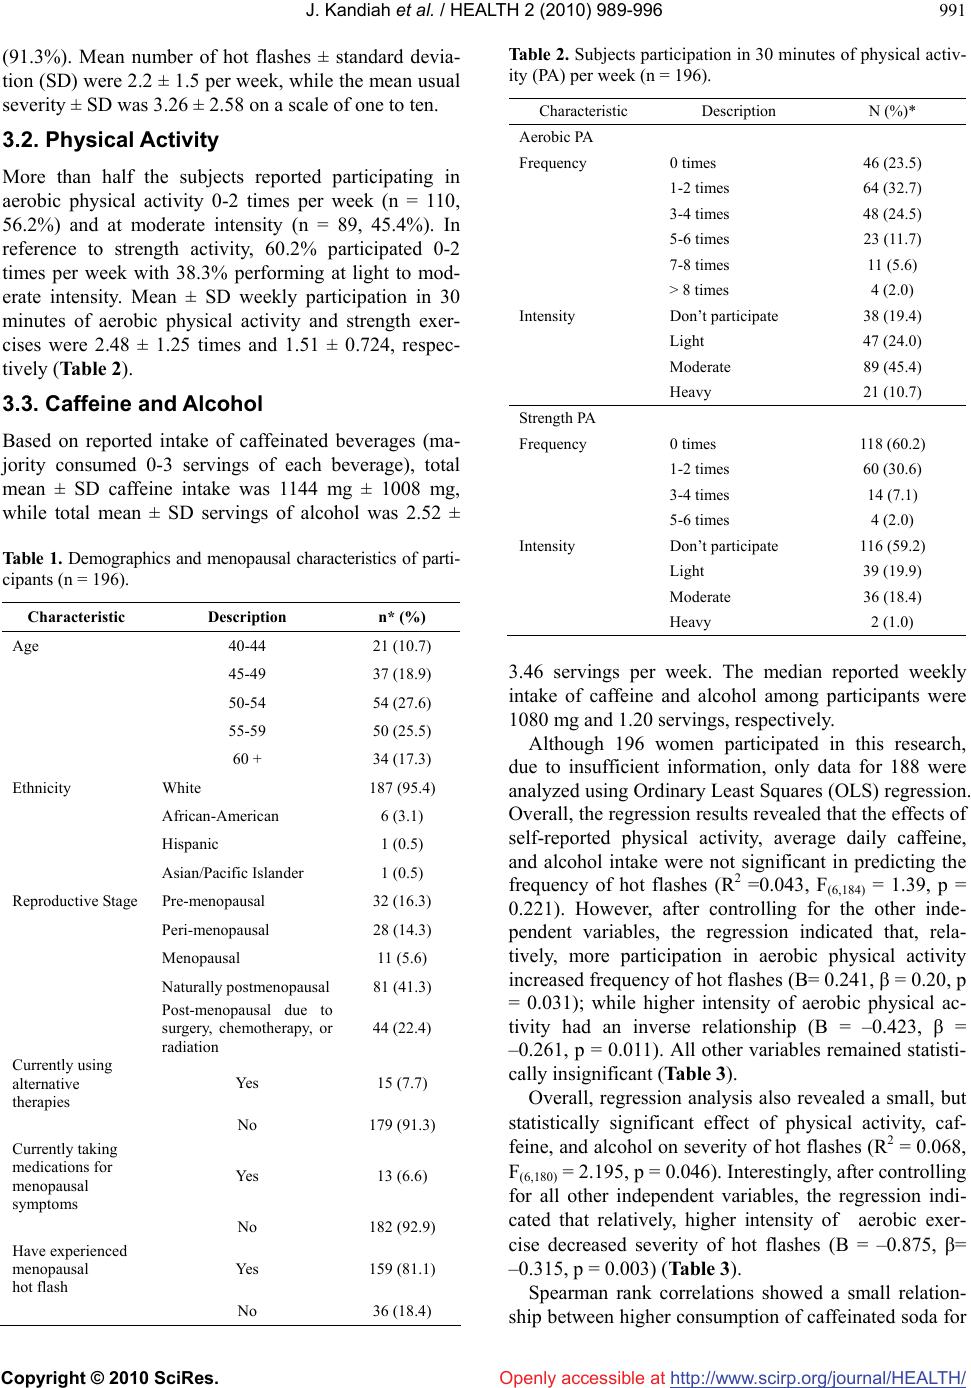 J. Kandiah et al. / HEALTH 2 (2010) 989-996 Copyright © 2010 SciRes. Openly accessible at http://www.scirp.org/journal/HEALTH/ 991 (91.3%). Mean number of hot flashes ± standard devia- tion (SD) were 2.2 ± 1.5 per week, while the mean usual severity ± SD was 3.26 ± 2.58 on a scale of one to ten. 3.2. Physical Activity More than half the subjects reported participating in aerobic physical activity 0-2 times per week (n = 110, 56.2%) and at moderate intensity (n = 89, 45.4%). In reference to strength activity, 60.2% participated 0-2 times per week with 38.3% performing at light to mod- erate intensity. Mean ± SD weekly participation in 30 minutes of aerobic physical activity and strength exer- cises were 2.48 ± 1.25 times and 1.51 ± 0.724, respec- tively (Table 2). 3.3. Caffeine and Alcohol Based on reported intake of caffeinated beverages (ma- jority consumed 0-3 servings of each beverage), total mean ± SD caffeine intake was 1144 mg ± 1008 mg, while total mean ± SD servings of alcohol was 2.52 ± Table 1. Demographics and menopausal characteristics of parti- cipants (n = 196). Characteristic Description n* (%) Age 40-44 21 (10.7) 45-49 37 (18.9) 50-54 54 (27.6) 55-59 50 (25.5) 60 + 34 (17.3) Ethnicity White 187 (95.4) African-American 6 (3.1) Hispanic 1 (0.5) Asian/Pacific Islander 1 (0.5) Reproductive Stage Pre-menopausal 32 (16.3) Peri-menopausal 28 (14.3) Menopausal 11 (5.6) Naturally postmenopausal 81 (41.3) Post-menopausal due to surgery, chemotherapy, or radiation 44 (22.4) Currently using alternative therapies Yes 15 (7.7) No 179 (91.3) Currently taking medications for menopausal symptoms Yes 13 (6.6) No 182 (92.9) Have experienced menopausal hot flash Yes 159 (81.1) No 36 (18.4) Table 2. Subjects participation in 30 minutes of physical activ- ity (PA) per week (n = 196). Characteristic Description N (%)* Aerobic PA Frequency 0 times 46 (23.5) 1-2 times 64 (32.7) 3-4 times 48 (24.5) 5-6 times 23 (11.7) 7-8 times 11 (5.6) > 8 times 4 (2.0) Intensity Don’t participate 38 (19.4) Light 47 (24.0) Moderate 89 (45.4) Heavy 21 (10.7) Strength PA Frequency 0 times 118 (60.2) 1-2 times 60 (30.6) 3-4 times 14 (7.1) 5-6 times 4 (2.0) Intensity Don’t participate 116 (59.2) Light 39 (19.9) Moderate 36 (18.4) Heavy 2 (1.0) 3.46 servings per week. The median reported weekly intake of caffeine and alcohol among participants were 1080 mg and 1.20 servings, respectively. Although 196 women participated in this research, due to insufficient information, only data for 188 were analyzed using Ordinary Least Squares (OLS) regression. Overall, the regression results revealed that the effects of self-reported physical activity, average daily caffeine, and alcohol intake were not significant in predicting the frequency of hot flashes (R2 =0.043, F(6,184) = 1.39, p = 0.221). However, after controlling for the other inde- pendent variables, the regression indicated that, rela- tively, more participation in aerobic physical activity increased frequency of hot flashes (B= 0.241, β = 0.20, p = 0.031); while higher intensity of aerobic physical ac- tivity had an inverse relationship (B = –0.423, β = –0.261, p = 0.011). All other variables remained statisti- cally insignificant (Table 3). Overall, regression analysis also revealed a small, but statistically significant effect of physical activity, caf- feine, and alcohol on severity of hot flashes (R2 = 0.068, F(6,180) = 2.195, p = 0.046). Interestingly, after controlling for all other independent variables, the regression indi- cated that relatively, higher intensity of aerobic exer- cise decreased severity of hot flashes (B = –0.875, β= –0.315, p = 0.003) (Table 3). Spearman rank correlations showed a small relation- ship between higher consumption of caffeinated soda for 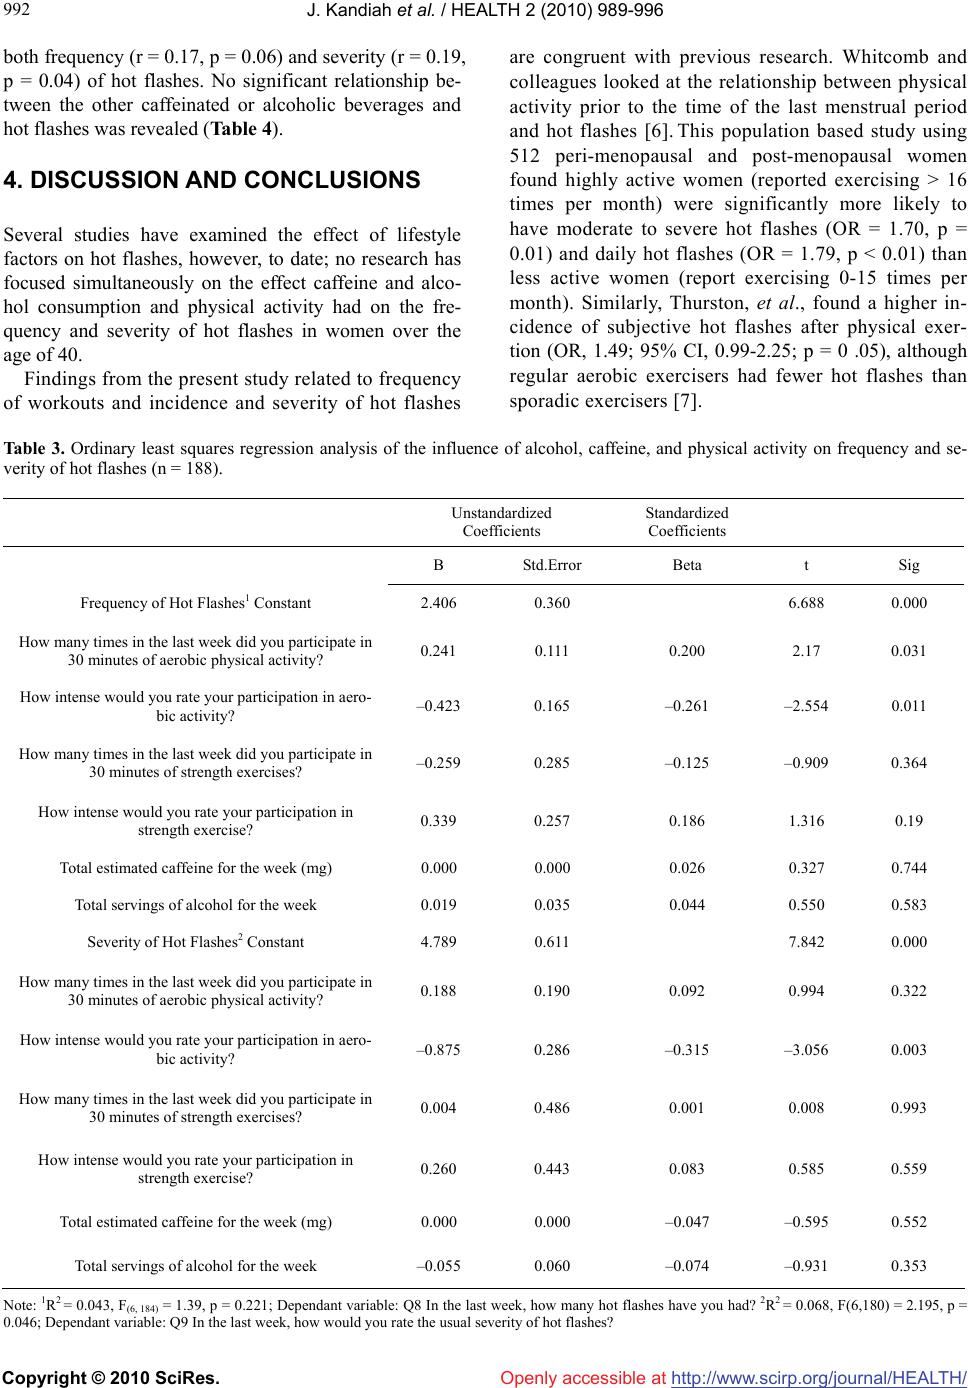 J. Kandiah et al. / HEALTH 2 (2010) 989-996 Copyright © 2010 SciRes. Openly accessible at http://www.scirp.org/journal/HEALTH/ 992 both frequency (r = 0.17, p = 0.06) and severity (r = 0.19, p = 0.04) of hot flashes. No significant relationship be- tween the other caffeinated or alcoholic beverages and hot flashes was revealed (Table 4). 4. DISCUSSION AND CONCLUSIONS Several studies have examined the effect of lifestyle factors on hot flashes, however, to date; no research has focused simultaneously on the effect caffeine and alco- hol consumption and physical activity had on the fre- quency and severity of hot flashes in women over the age of 40. Findings from the present study related to frequency of workouts and incidence and severity of hot flashes are congruent with previous research. Whitcomb and colleagues looked at the relationship between physical activity prior to the time of the last menstrual period and hot flashes [6]. This population based study using 512 peri-menopausal and post-menopausal women found highly active women (reported exercising > 16 times per month) were significantly more likely to have moderate to severe hot flashes (OR = 1.70, p = 0.01) and daily hot flashes (OR = 1.79, p < 0.01) than less active women (report exercising 0-15 times per month). Similarly, Thurston, et al., found a higher in- cidence of subjective hot flashes after physical exer- tion (OR, 1.49; 95% CI, 0.99-2.25; p = 0 .05), although regular aerobic exercisers had fewer hot flashes than sporadic exercisers [7]. Table 3. Ordinary least squares regression analysis of the influence of alcohol, caffeine, and physical activity on frequency and se- verity of hot flashes (n = 188). Note: 1R2 = 0.043, F(6, 184) = 1.39, p = 0.221; Dependant variable: Q8 In the last week, how many hot flashes have you had? 2R2 = 0.068, F(6,180) = 2.195, p = 0.046; Dependant variable: Q9 In the last week, how would you rate the usual severity of hot flashes? Unstandardized Coefficients Standardized Coefficients B Std.Error Beta t Sig Frequency of Hot Flashes1 Constant 2.406 0.360 6.688 0.000 How many times in the last week did you participate in 30 minutes of aerobic physical activity? 0.241 0.111 0.200 2.17 0.031 How intense would you rate your participation in aero- bic activity? –0.423 0.165 –0.261 –2.554 0.011 How many times in the last week did you participate in 30 minutes of strength exercises? –0.259 0.285 –0.125 –0.909 0.364 How intense would you rate your participation in strength exercise? 0.339 0.257 0.186 1.316 0.19 Total estimated caffeine for the week (mg) 0.000 0.000 0.026 0.327 0.744 Total servings of alcohol for the week 0.019 0.035 0.044 0.550 0.583 Severity of Hot Flashes2 Constant 4.789 0.611 7.842 0.000 How many times in the last week did you participate in 30 minutes of aerobic physical activity? 0.188 0.190 0.092 0.994 0.322 How intense would you rate your participation in aero- bic activity? –0.875 0.286 –0.315 –3.056 0.003 How many times in the last week did you participate in 30 minutes of strength exercises? 0.004 0.486 0.001 0.008 0.993 How intense would you rate your participation in strength exercise? 0.260 0.443 0.083 0.585 0.559 Total estimated caffeine for the week (mg) 0.000 0.000 –0.047 –0.595 0.552 Total servings of alcohol for the week –0.055 0.060 –0.074 –0.931 0.353  J. Kandiah et al. / HEALTH 2 (2010) 989-996 Copyright © 2010 SciRes. Openly accessible at http://www.scirp.org/journal/HEALTH/ 993 Table 4. Spearman correlations between caffeinated beverages and frequency of hot flashes. Frequency of Hot Flashes n r Sig. Energy drinks (12 fl. oz. serving) 2 NA** NA** Caffeinated hot tea (8 fl. oz. serving) 60 –0.005 0.969 Caffeinated iced tea (8 fl. oz. serving) 78 –0.016 0.887 Caffeinated soda (12 fl. oz. serving) 123 0.173 0.055 Hot chocolate or cocoa (8 fl. oz. serving) 19 0.214 0.378 Dark chocolate (8 fl. oz. serving) 99 0.102 0.314 Red wine (5 fl. oz. serving) 51 0.091 0.527 Alcoholic beer products (12 fl. oz. serving) 37 –0.025 0.881 White wine/champagne (8 fl. oz. serving) 55 0.097 0.481 Mixed drinks (1.5-2.0 fl. oz. serving) 30 –0.227 0.227 Severity of Hot Flashes Energy drinks (12 fl. oz. serving) 2 NA* NA* Caffeinated hot tea (8 fl. oz. serving) 60 0.033 0.804 Caffeinated iced tea (8 fl. oz. serving) 77 –0.087 0.449 Caffeinated soda (12 fl. oz. serving) 121 0.189 0.038 Chocolate or cocoa (8 fl. oz. serving) 20 –0.010 0.967 Dark chocolate (8 fl. oz. serving) 97 0.059 0.563 Red wine (5 fl. oz. serving) 49 0.229 0.114 Alcoholic beer products (12 fl. oz. serving) 34 –0.032 0.858 White wine/champagne (8 fl. oz. serving) 53 –0.015 0.918 Mixed drinks (1.5-2.0 fl. oz. serving) 28 –0.149 0.449 The inverse relationship found between intensity of physical activity and severity of hot flashes supports the findings of Sievert et al. [10]. Women who participated in heavy exercise (enough to speed up breathing and heart rate, at least two times per week) were significantly less likely to report both hot flashes and night sweats (p = 0.05) compared to those participating in minimal exer- cise (no exercise, or light exercise less than once per week). In contrast, Sternfield and colleagues investigated the effects of regular exercise prior to the final menstrual period [8]. There was no association between habitual physical activity and menopausal hot flashes. Research also revealed regular physical activity did not signifi- cantly affect the frequency of menopausal symptoms such as hot flashes (p = 0.291). Similar observations were reported by Riley et al., indicating no significant relationship exists between habitual exercise and fre- quency or intensity of hot flashes (OR = 1.3; 95% CI = 0.78-2.16) [9]. Limited studies have looked at the effect of caffeine on hot flashes. Even though the present study demon- strated a there was a perceived relationship between caf- feinated soda and frequency and severity of hot flashes (r = 0.17, p = 0.04; r = 0.19, p = 0.04), Thurston et al., found an increased likelihood of objective hot flashes (OR = 1.51; CI = 1.18-3.81; p = 0.003) after caffeine consumption [7]. Regression analysis revealed alcohol and caffeine consumption had no influence on frequency or severity of hot flashes. On the contrary, earlier studies have shown significant relationships existed between alcohol intake and hot flashes. Freeman and colleagues [11], found alcohol to be a significant predictor of hot flashes (OR 1.10, p = 0.002). Observations were also noted by Sievert et al. revealing daily alcohol consumption sig- nificantly increased the risk of hot flashes (p < 0.01) [10]. Riley and colleagues noted in peri-menopausal women a significant correlation prevailed with consumption of 1-5 drinks per day and bothersome hot flashes (OR = 0.52, CI = 0.31-0.86) [9]. This research was limited to a homogeneous ethnic group of faculty and staff at a Mid-Western University. Recommendations for future research related to hot flashes include: 1) assessment of participants BMI; 2) incorporation of a larger and diverse ethnic group, with varying age and geographical location; 3) comparison of recreational activity to various levels and types of aero- bic activity; 4) treatment of hot flashes using comple- mentary and alternative medicine; 5) measurement of actual hot flashes using objective and subjective infor- mation; 6) comparison of co-morbidities such as obesity, diabetes, and hypertension and their contributory roles to menopausal symptoms and hot flashes. Health professionals and scientists need to find a con- nection to other modifiable behaviors to decrease the occurrence and symptoms of hot flashes. In doing so, a better understanding of the physiological challenges women face can be gained, so appropriate intervention 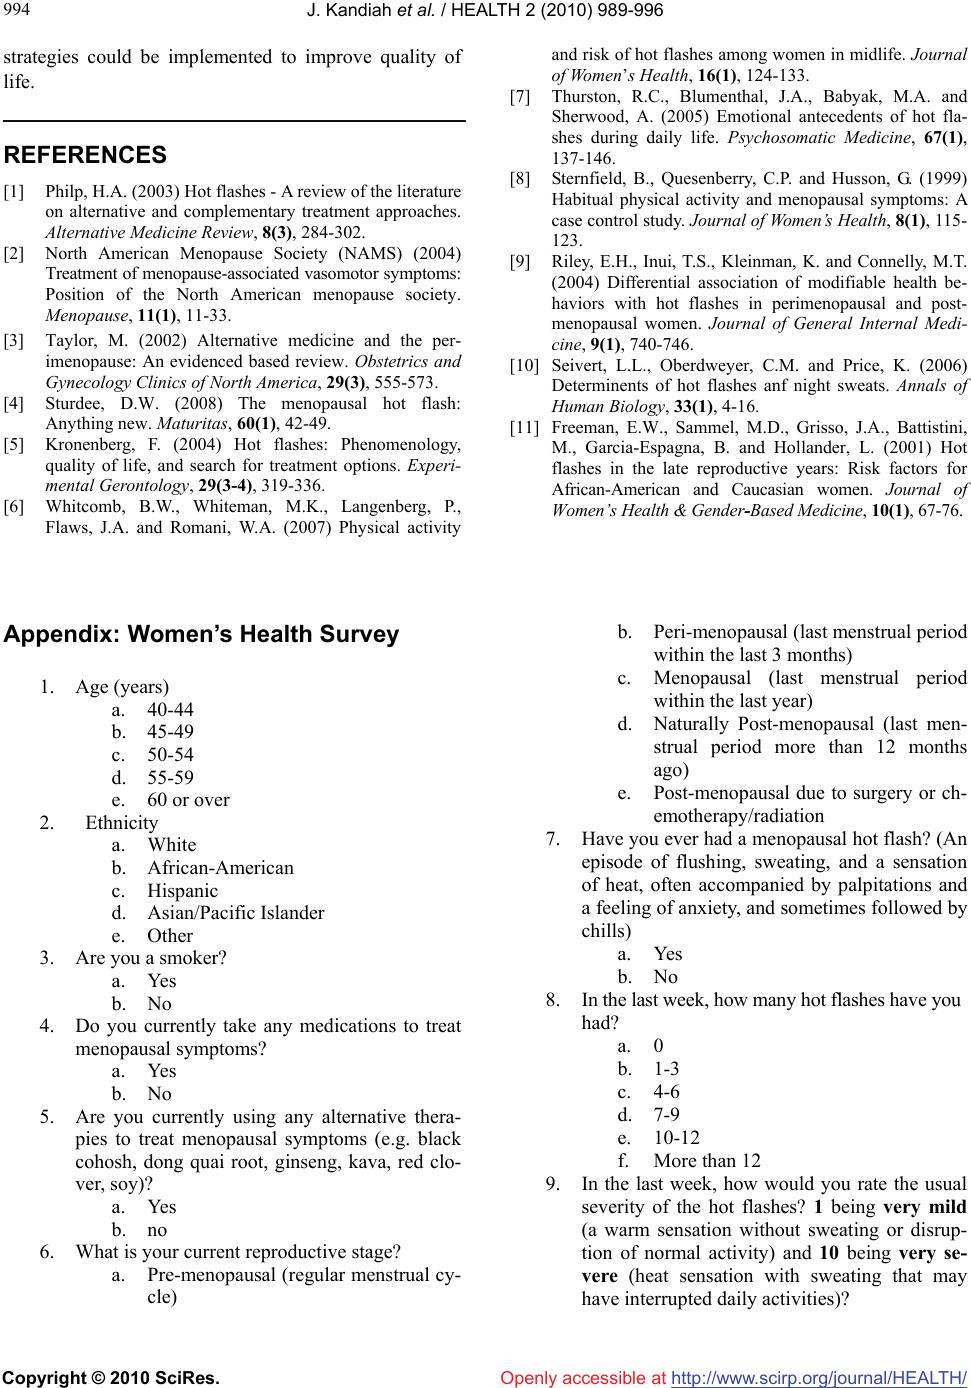 J. Kandiah et al. / HEALTH 2 (2010) 989-996 Copyright © 2010 SciRes. Openly accessible at http://www.scirp.org/journal/HEALTH/ 994 strategies could be implemented to improve quality of life. REFERENCES [1] Philp, H.A. (2003) Hot flashes - A review of the literature on alternative and complementary treatment approaches. Alternative Medicine Review, 8(3), 284-302. [2] North American Menopause Society (NAMS) (2004) Treatment of menopause-associated vasomotor symptoms: Position of the North American menopause society. Menopause, 11(1), 11-33. [3] Taylor, M. (2002) Alternative medicine and the per- imenopause: An evidenced based review. Obstetrics and Gynecology Clinics of North America, 29(3), 555-573. [4] Sturdee, D.W. (2008) The menopausal hot flash: Anything new. Maturitas, 60(1), 42-49. [5] Kronenberg, F. (2004) Hot flashes: Phenomenology, quality of life, and search for treatment options. Experi- mental Gerontology, 29(3-4), 319-336. [6] Whitcomb, B.W., Whiteman, M.K., Langenberg, P., Flaws, J.A. and Romani, W.A. (2007) Physical activity and risk of hot flashes among women in midlife. Journal of Women’s Health, 16(1), 124-133. [7] Thurston, R.C., Blumenthal, J.A., Babyak, M.A. and Sherwood, A. (2005) Emotional antecedents of hot fla- shes during daily life. Psychosomatic Medicine, 67(1), 137-146. [8] Sternfield, B., Quesenberry, C.P. and Husson, G. (1999) Habitual physical activity and menopausal symptoms: A case control study. Journal of Women’s Health, 8(1), 115- 123. [9] Riley, E.H., Inui, T.S., Kleinman, K. and Connelly, M.T. (2004) Differential association of modifiable health be- haviors with hot flashes in perimenopausal and post- menopausal women. Journal of General Internal Medi- cine, 9(1), 740-746. [10] Seivert, L.L., Oberdweyer, C.M. and Price, K. (2006) Determinents of hot flashes anf night sweats. Annals of Human Biology, 33(1), 4-16. [11] Freeman, E.W., Sammel, M.D., Grisso, J.A., Battistini, M., Garcia-Espagna, B. and Hollander, L. (2001) Hot flashes in the late reproductive years: Risk factors for African-American and Caucasian women. Journal of Women’s Health & Gender-Based Medicine, 10(1), 67-76. Appendix: Women’s Health Survey 1. Age (years) a. 40-44 b. 45-49 c. 50-54 d. 55-59 e. 60 or over 2. Ethnicity a. White b. African-American c. Hispanic d. Asian/Pacific Islander e. Other 3. Are you a smoker? a. Yes b. No 4. Do you currently take any medications to treat menopausal symptoms? a. Yes b. No 5. Are you currently using any alternative thera- pies to treat menopausal symptoms (e.g. black cohosh, dong quai root, ginseng, kava, red clo- ver, soy)? a. Yes b. no 6. What is your current reproductive stage? a. Pre-menopausal (regular menstrual cy- cle) b. Peri-menopausal (last menstrual period within the last 3 months) c. Menopausal (last menstrual period within the last year) d. Naturally Post-menopausal (last men- strual period more than 12 months ago) e. Post-menopausal due to surgery or ch- emotherapy/radiation 7. Have you ever had a menopausal hot flash? (An episode of flushing, sweating, and a sensation of heat, often accompanied by palpitations and a feeling of anxiety, and sometimes followed by chills) a. Yes b. No 8. In the last week, how many hot flashes have you had? a. 0 b. 1-3 c. 4-6 d. 7-9 e. 10-12 f. More than 12 9. In the last week, how would you rate the usual severity of the hot flashes? 1 being very mild (a warm sensation without sweating or disrup- tion of normal activity) and 10 being very se- vere (heat sensation with sweating that may have interrupted daily activities)? 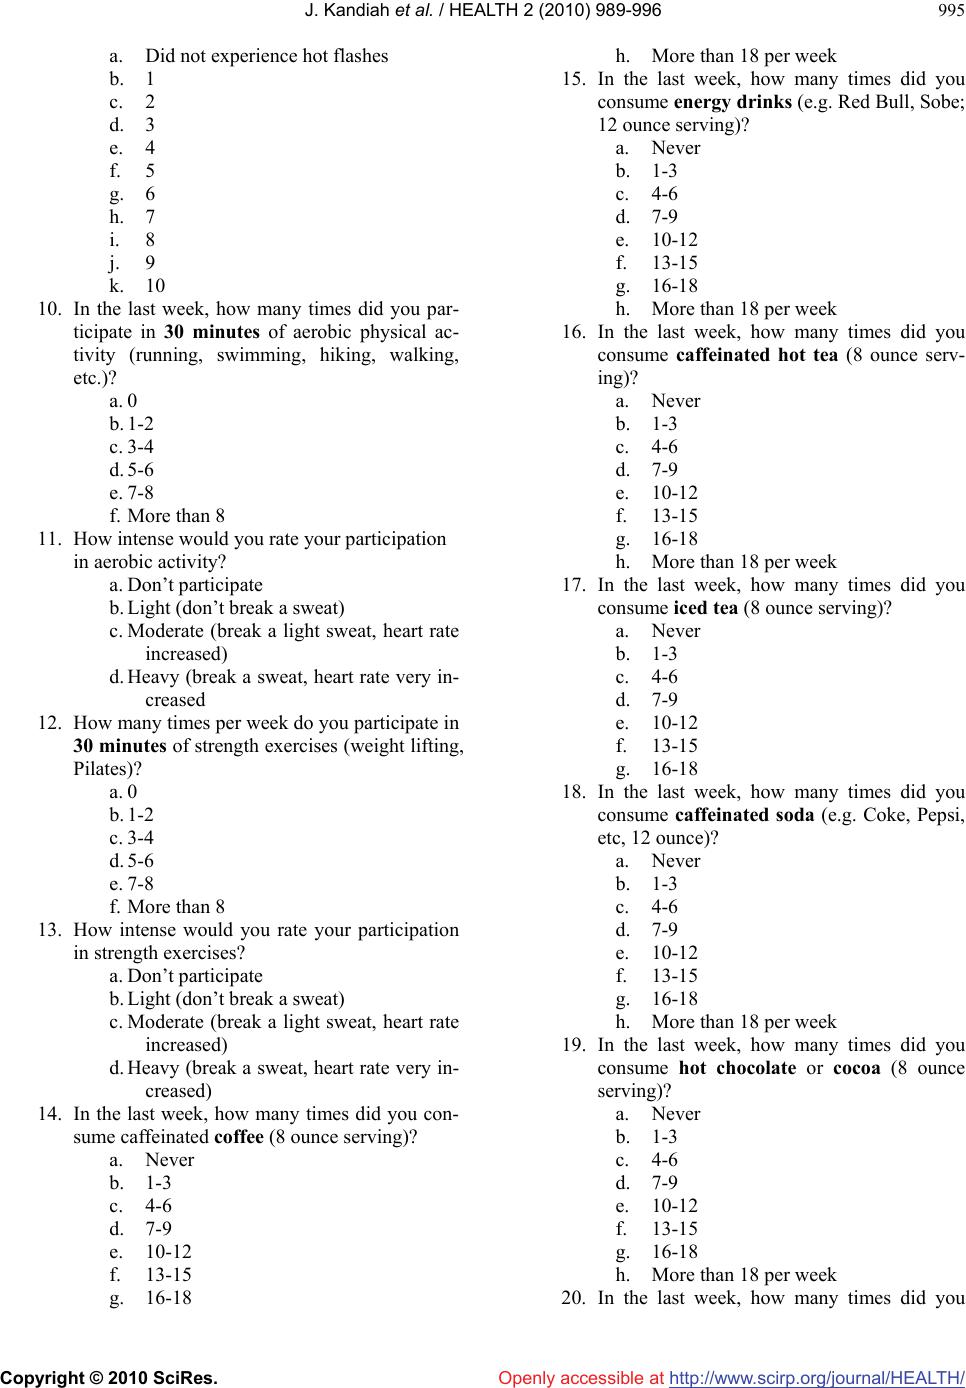 J. Kandiah et al. / HEALTH 2 (2010) 989-996 Copyright © 2010 SciRes. Openly accessible at http://www.scirp.org/journal/HEALTH/ 995 a. Did not experience hot flashes b. 1 c. 2 d. 3 e. 4 f. 5 g. 6 h. 7 i. 8 j. 9 k. 10 10. In the last week, how many times did you par- ticipate in 30 minutes of aerobic physical ac- tivity (running, swimming, hiking, walking, etc.)? a. 0 b. 1-2 c. 3-4 d. 5-6 e. 7-8 f. More than 8 11. How intense would you rate your participation in aerobic activity? a. Don’t participate b. Light (don’t break a sweat) c. Moderate (break a light sweat, heart rate increased) d. Heavy (break a sweat, heart rate very in- creased 12. How many times per week do you participate in 30 minutes of strength exercises (weight lifting, Pilates)? a. 0 b. 1-2 c. 3-4 d. 5-6 e. 7-8 f. More than 8 13. How intense would you rate your participation in strength exercises? a. Don’t participate b. Light (don’t break a sweat) c. Moderate (break a light sweat, heart rate increased) d. Heavy (break a sweat, heart rate very in- creased) 14. In the last week, how many times did you con- sume caffeinated coffee (8 ounce serving)? a. Never b. 1-3 c. 4-6 d. 7-9 e. 10-12 f. 13-15 g. 16-18 h. More than 18 per week 15. In the last week, how many times did you consume energy drinks (e.g. Red Bull, Sobe; 12 ounce serving)? a. Never b. 1-3 c. 4-6 d. 7-9 e. 10-12 f. 13-15 g. 16-18 h. More than 18 per week 16. In the last week, how many times did you consume caffeinated hot tea (8 ounce serv- ing)? a. Never b. 1-3 c. 4-6 d. 7-9 e. 10-12 f. 13-15 g. 16-18 h. More than 18 per week 17. In the last week, how many times did you consume iced tea (8 ounce serving)? a. Never b. 1-3 c. 4-6 d. 7-9 e. 10-12 f. 13-15 g. 16-18 18. In the last week, how many times did you consume caffeinated soda (e.g. Coke, Pepsi, etc, 12 ounce)? a. Never b. 1-3 c. 4-6 d. 7-9 e. 10-12 f. 13-15 g. 16-18 h. More than 18 per week 19. In the last week, how many times did you consume hot chocolate or cocoa (8 ounce serving)? a. Never b. 1-3 c. 4-6 d. 7-9 e. 10-12 f. 13-15 g. 16-18 h. More than 18 per week 20. In the last week, how many times did you 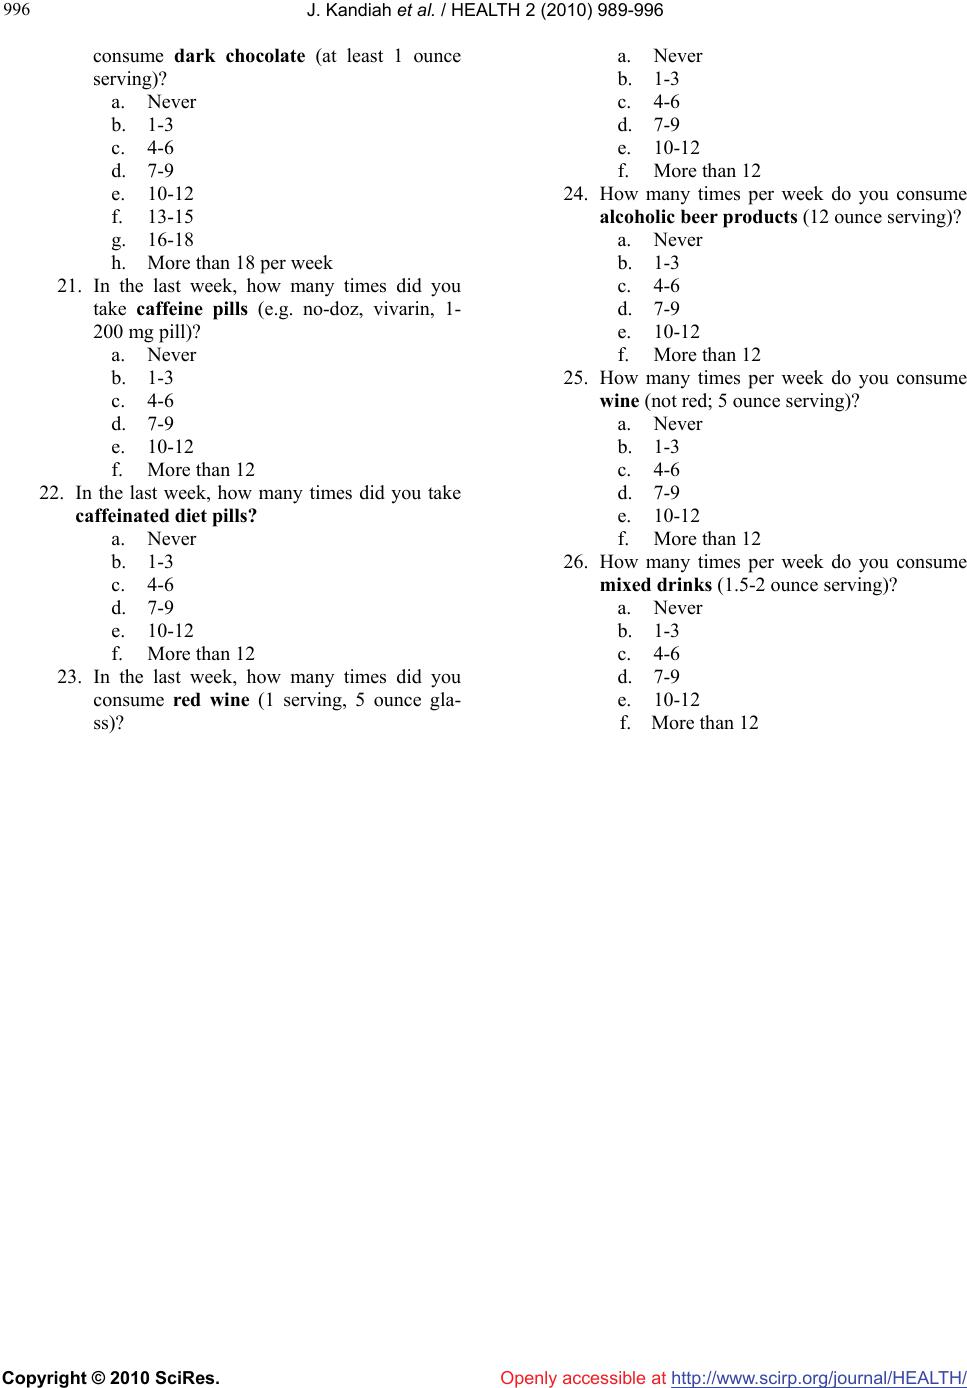 J. Kandiah et al. / HEALTH 2 (2010) 989-996 Copyright © 2010 SciRes. Openly accessible at http://www.scirp.org/journal/HEALTH/ 996 consume dark chocolate (at least 1 ounce serving)? a. Never b. 1-3 c. 4-6 d. 7-9 e. 10-12 f. 13-15 g. 16-18 h. More than 18 per week 21. In the last week, how many times did you take caffeine pills (e.g. no-doz, vivarin, 1- 200 mg pill)? a. Never b. 1-3 c. 4-6 d. 7-9 e. 10-12 f. More than 12 22. In the last week, how many times did you take caffeinated diet pills? a. Never b. 1-3 c. 4-6 d. 7-9 e. 10-12 f. More than 12 23. In the last week, how many times did you consume red wine (1 serving, 5 ounce gla- ss)? a. Never b. 1-3 c. 4-6 d. 7-9 e. 10-12 f. More than 12 24. How many times per week do you consume alcoholic beer products (12 ounce serving)? a. Never b. 1-3 c. 4-6 d. 7-9 e. 10-12 f. More than 12 25. How many times per week do you consume wine (not red; 5 ounce serving)? a. Never b. 1-3 c. 4-6 d. 7-9 e. 10-12 f. More than 12 26. How many times per week do you consume mixed drinks (1.5-2 ounce serving)? a. Never b. 1-3 c. 4-6 d. 7-9 e. 10-12 f. More than 12 |

