Health
Vol.5 No.12(2013), Article ID:41089,6 pages DOI:10.4236/health.2013.512287
Spatial patterns of health clinic in Malaysia
![]()
1Institute for Public Health, MOH, Kuala Lumpur, Malaysia; hazrin@iku.moh.gov.my
2Family Health Development Divisions, MOH, Kuala Lumpur, Malaysia
Copyright © 2013 H. Hazrin et al. This is an open access article distributed under the Creative Commons Attribution License, which permits unrestricted use, distribution, and reproduction in any medium, provided the original work is properly cited.
Received 1 October 2013; revised 8 November 2013; accepted 25 November 2013
Keywords: Clinic; GIS; Spatial
ABSTRACT
Background: This manuscript aimed to map the spatial distributions of health clinics for public and private sectors in Malaysia. It would assist the stakeholders and responsible authorities in the planning for health service delivery. Methods: Data related to health clinic were gathered from stakeholders. The location of health facilities was geo-coded using a Global Positioning System (GPS) handheld. The average nearest neighbour was used to identify whether health clinics were spatially clustered or dispersed. Hot spot analysis was used to assess high density of health clinics to population ratio and average distance of health clinics distribution. A Geographically Weighted Regression (GWR) was used to analyse the requirement of health clinic in a sub-district based on population density and number of health clinics with significant level (p < 0.001). Results: The results of the average nearest neighbour analysis revealed that the distribution of public health clinics was dispersed (p < 0.001) with z-scores 3.95 while the distribution of private clinics was clustered (p < 0.001) with z-score −29.26. Several locations especially urban area was also identified as high density in the sub-district. Conclusions: There is a significant difference in the spatial pattern of public health clinics and private clinics in Malaysia. The information can assist stakeholder and responsible authorities in planning health service delivery.
1. INTRODUCTION
Information on the location of health clinics and their distribution is required to enhance optimisation of effectiveness, reduce costs and resources utilization among service providers. Geographic Information System (GIS) has a potential to access the patterns of health clinics to identify geographic regions most in need of health clinic access. GIS is currently recognized as a set of strategic and analytic tools for public health, so the design and implementation of an information system for health clinic distribution with GIS capacity should be considered [1].
Since independence, Malaysia has seen tremendous improvements in its healthcare delivery system. The country now enjoys a fairly comprehensive range of health services provided by a dual system involving health care providers from the public and private sectors [2]. Health clinic is one of the components of health care facilities in the health care delivery system providing health services to the community. In Malaysia, health clinic services are provided by the public and private sectors. In the public sector, the health clinic is the prominent provider of primary health care, recognised for its role in maintaining population health at relatively low cost, more easily delivered than specialty care and most efficient in preventing disease progression on a large scale [3].
Among the important aspects in planning for the development of new clinics are the spatial patterns of the existing health clinics and the population distribution. Spatial analysis and mapping of community access were first described in 1977 when Farley, Boisseau and Froom began mapping patients in relationship to their clinics [3]. In 2009, Andrew Bazemore, Robert and Thomas integrated and analysed clinical data with population data in Baltimore, Canada by using GIS [4]. This can support decision making by policy makers, especially in the Planning and Development Division of the Ministry of Health Malaysia.
However, when dealing with problems of space, the step beyond simple cartography and mapping is spatial analysis, which in geographical research is the tool used to compare the spatial distribution of a set of features to a hypothetically-based random spatial distribution. These spatial distributions, or patterns, are of interest to many areas of geographic research because they can help to identify and quantify patterns of features in space so that the underlying cause of the distribution can be determined [3]. In health research, spatial analysis is used to detect and quantify the patterns of disease distribution that may offer an insight into the epidemiology of a disease. Although spatial analytical techniques rarely give reasons why spatial patterns occur, they do identify the locations of the spatial patterns. Within the realms of health research, this provides a useful means to hypothesize about the health outcomes or to identify spatial issues that need to be further investigated [4].
This study aimed to map and study the spatial distributions of health clinics for both public and private sectors in Malaysia via a combination of Geographic Information System (GIS) and spatial statistical tools.
2. METHODOLOGY
2.1. Study Area
The study area, Malaysia, covers about 330,803 km2 and consists of thirteen states and three Federal Territories. Approximate location is between 99˚25′ to 119˚33′ latitude and 0˚19′ to 7˚52′ longitude. The neighbouring countries of Malaysia are Thailand, Brunei, Singapore and Indonesia (Figure 1). The total population of Malaysia in 2010 was 28.3 million and the population density stood at 86 persons per square kilometre [5]. This study used the sub-district, the smallest local governing unit in Malaysia, as the spatial zoning boundary.
2.2. Data Collection
Data on health clinics were obtained and incorporated in GIS environment and overlaid with demographic data. These data were gathered from various sources. Health clinic data reported in the year 2010 was used in this study. Public health clinic data were obtained from Health Informatics Centre, Ministry of Health Malaysia,
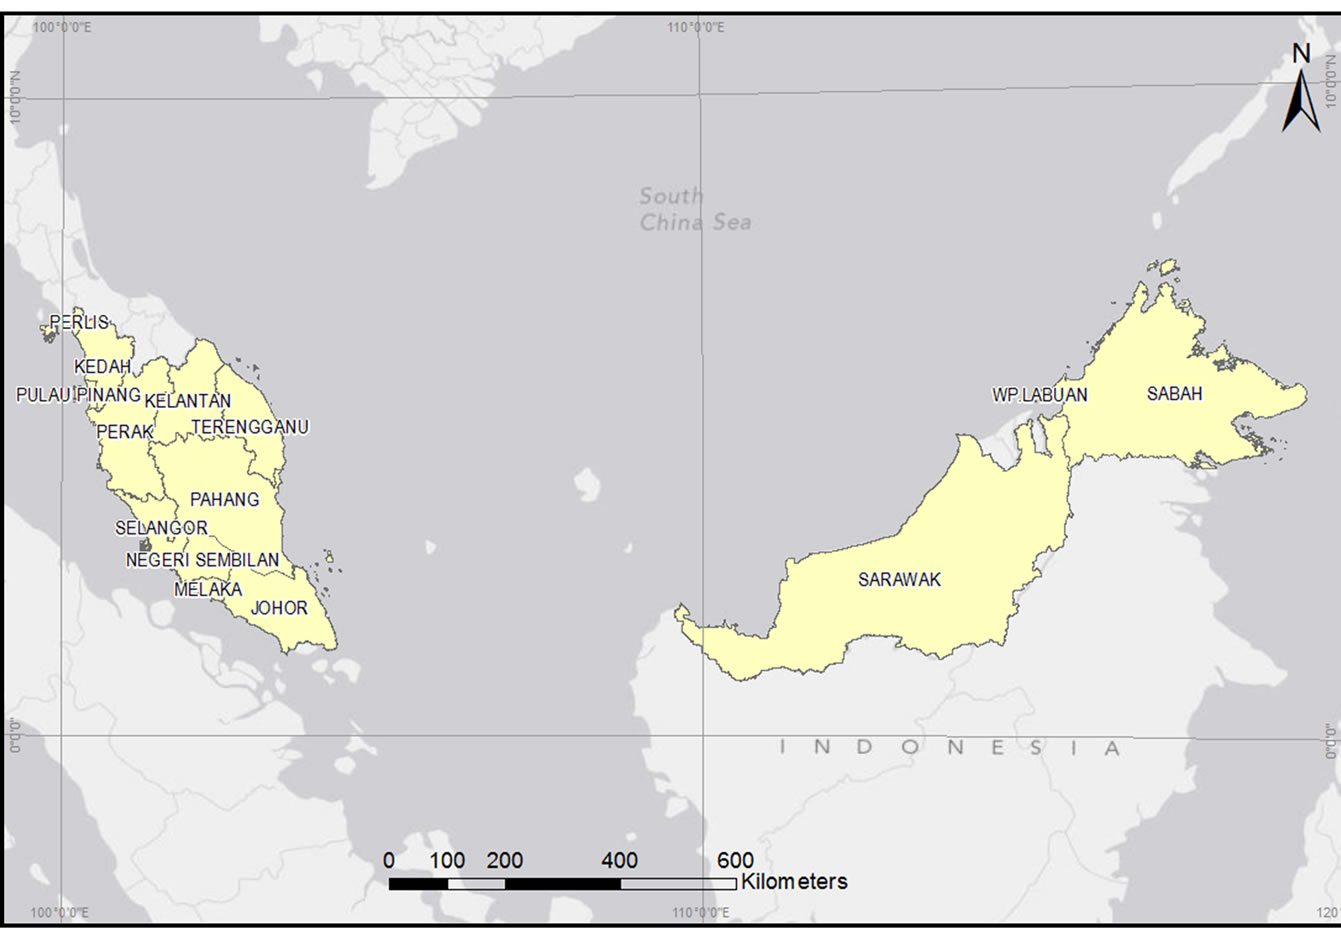
Figure 1. Map of Malaysia.
whereas data on private health clinics were obtained from the Medical Practice Division, Ministry of Health, Malaysia. The population information based on the Population Census of Malaysia in 2010 was obtained from the Department of Statistic, Malaysia. The entire lists were documented in Microsoft Excel program. In situ data collection was also carried out using handheld GPS Trimble to locate the spatial location (coordinates) of the health clinics. A base map which contained state boundaries, district and sub-district boundaries, main road networks, river, main buildings and facilities was provided by the Malaysia Centre for Geospatial Data Infrastructure (MaCGDI), a centre established under the Ministry of Natural Resources and Environment (NRE) to manage and promote the development of geospatial data infrastructure in Malaysia. In order to synchronize all the digital data coordinate system, we used the World Geodetic System (WGS 84) which serve the x, y of an object by longitude and latitude.
2.3. Implementation of GIS and Analysis
The spatial distribution of health clinics in Malaysia was examined using spatial statistics method. The average nearest neighbour was used to analyse whether health clinics are clustered, random or dispersed. It measured the distance between each feature centroid and its nearest neighbour’s centroid location. It then averaged all these nearest neighbour distances. If the average distance was is less than the average of a hypothetical random distribution, the distribution of the features being analysed was is considered clustered. If the average distance was greater than a hypothetical random distribution, the features were considered dispersed. The average nearest neighbour ratio was calculated as the observed average distance divided by the expected average distance (with expected average distance being based on a hypothetical random distribution with the same number of features covering the same total area) [6].
2.4. Statistical Analysis
A Geographically Weighted Regression (GWR) was used to analyse the requirement of health clinic in a sub-district based on population density and number of health clinics with significant level (p < 0.001). The GWR generated a separate regression equation for every sub-district layer analysed in a sample dataset as a means to address spatial variation. The GWR tool gave separate regression coefficients for each of the sub-district for public sector and private sector in the study area. These coefficients were mapped as raster surfaces, and the population density according to spatially varying regression coefficients was generated using the GWR tool in ArcGis [7]. All the analysis was done using ArcGIS 10.0.
3. RESULTS
This study identified that public health clinics within the sub-districts were spatially dispersed (Figure 2), while private health clinics were spatially clustered (Figure 3). Results from analysis showed that the average nearest neighbour ratio for public health clinics and private health clinics was 0.059 (p < 0.001) and 0.464 (p < 0.001) respectively. The z-score for public health clinics within the sub-district was 3.95 (p < 0.001) while for private health clinic was −29.26 (p < 0.001).
In this study, the null hypothesis of no spatial pattern among health clinics in Malaysia was rejected. Public sector gave a large z-score which indicated that there was less than 1% likelihood that this dispersed pattern could
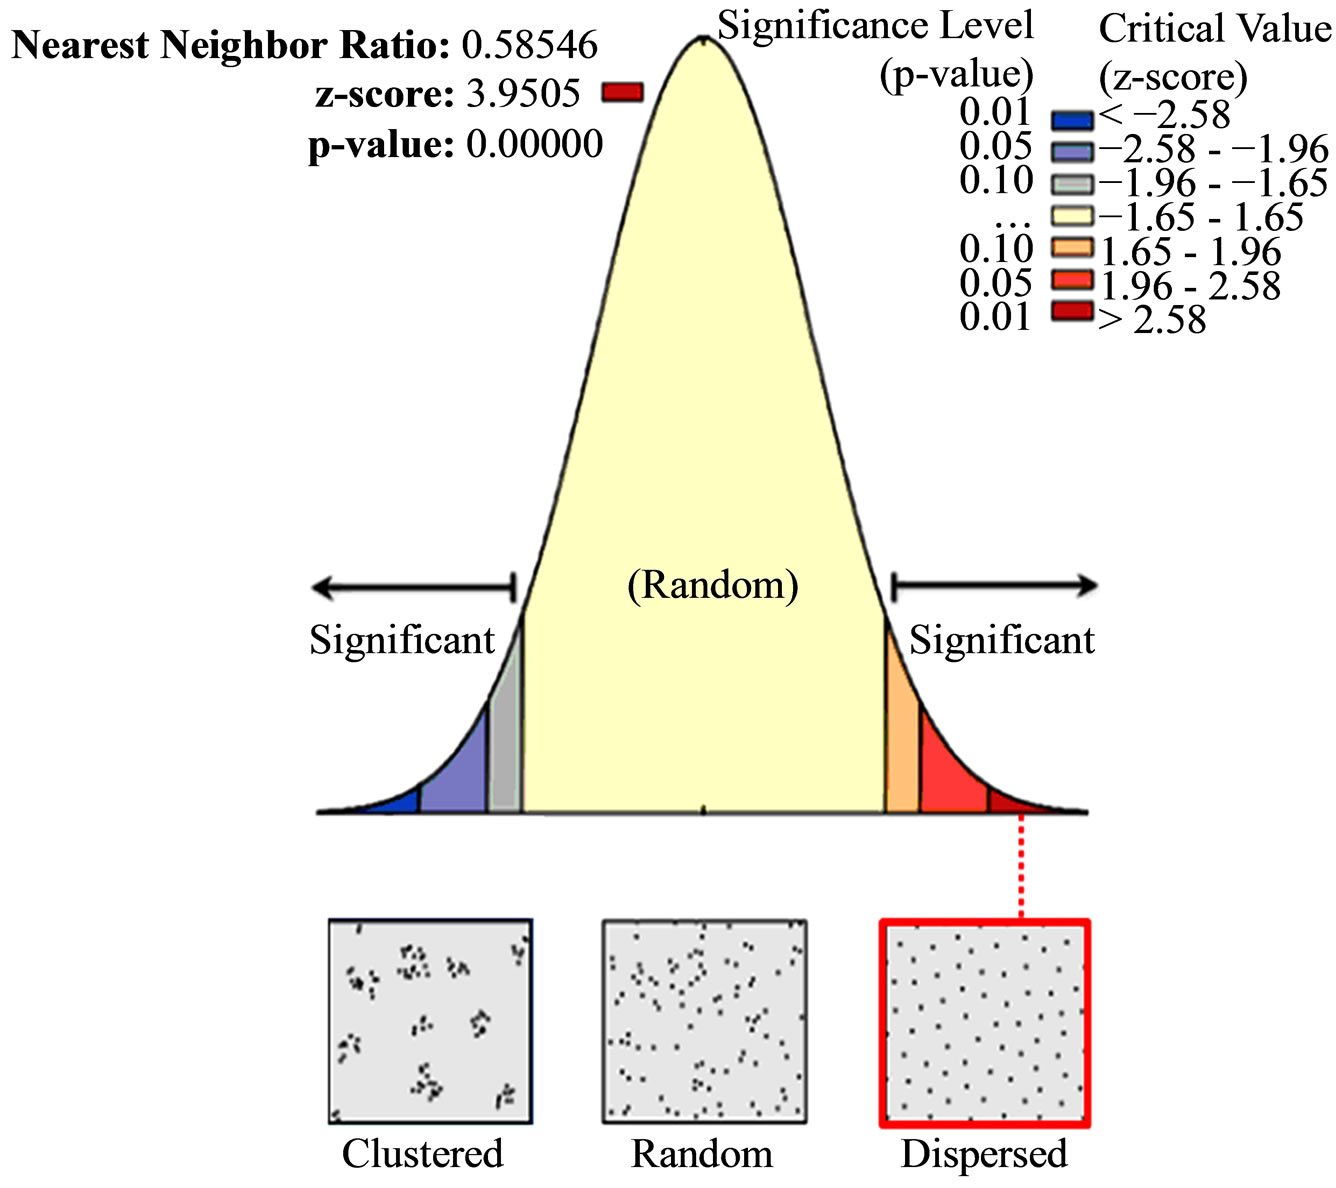
Figure 2. Average nearest neighbour result of public clinics.
be the result of random chance. Meanwhile, the private clinics gave a small z-score, which indicated that there was less than 1% likelihood that this clustered pattern could be the result of random chance. It was also shown that there was significant spatial autocorrelation of public health clinic’s coverage at an average distance of 9.71 kilometres while for the private clinic; it was at an average distance of 0.472 kilometres.
In GWR analysis, total health clinic to population ratio provided an overall pattern of the density of health clinic distribution. The red-colored areas in Figures 4 and 5 denote the high density of health clinics in relation to the population size. The blue-colored areas indicate low density of health clinics in relation to the size of the population.
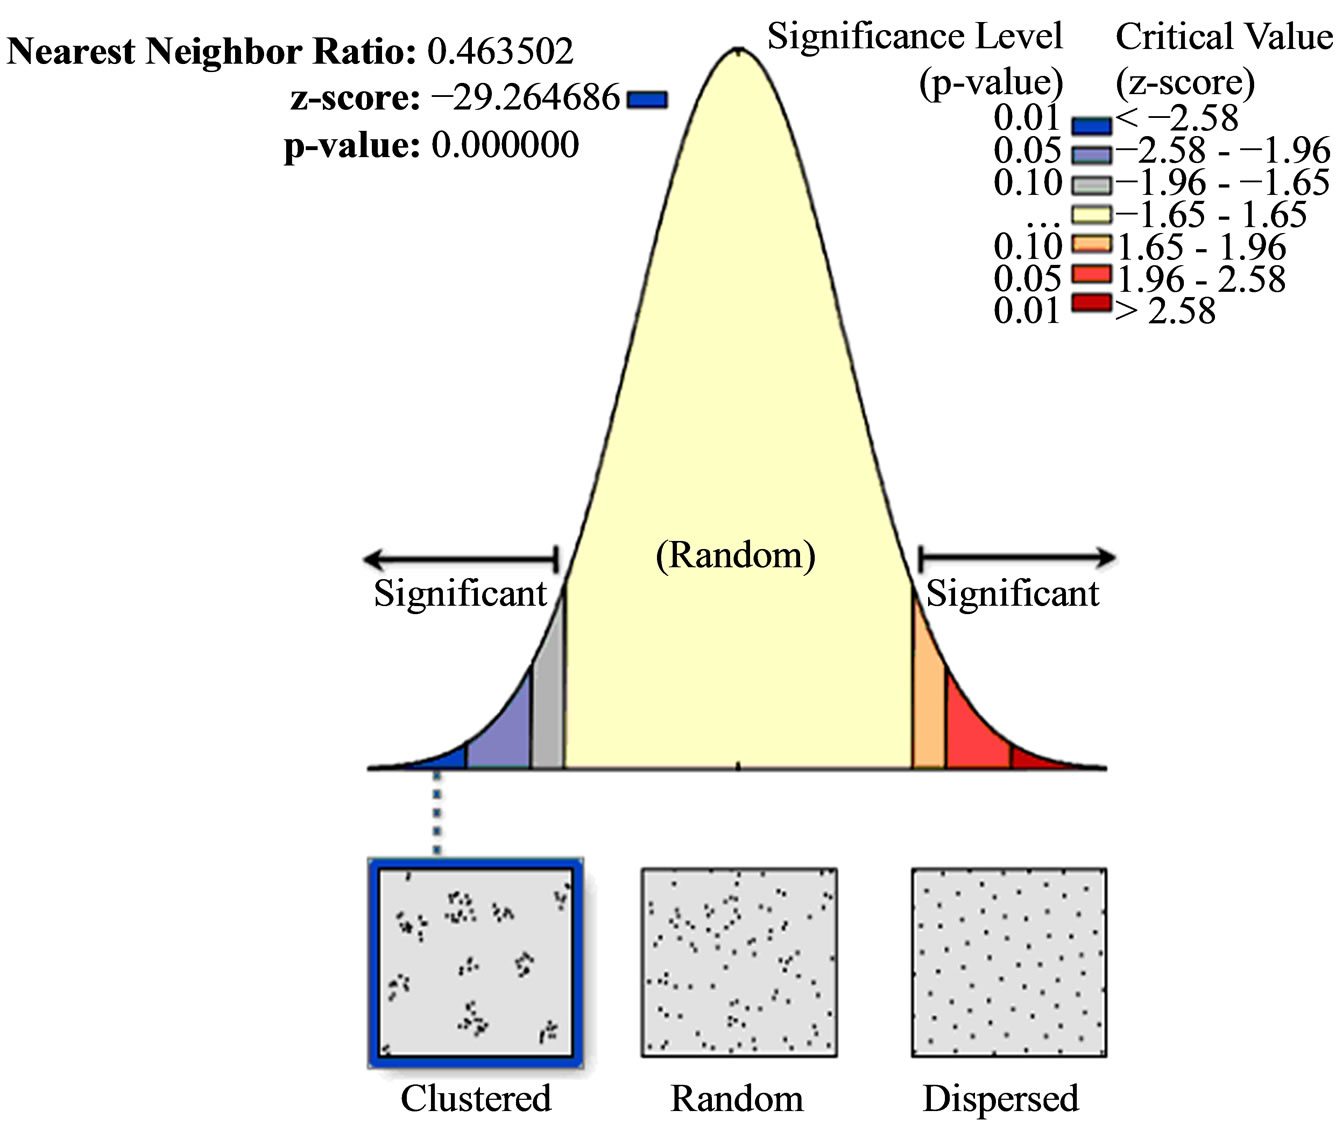
Figure 3. Spatial pattern of private clinics.
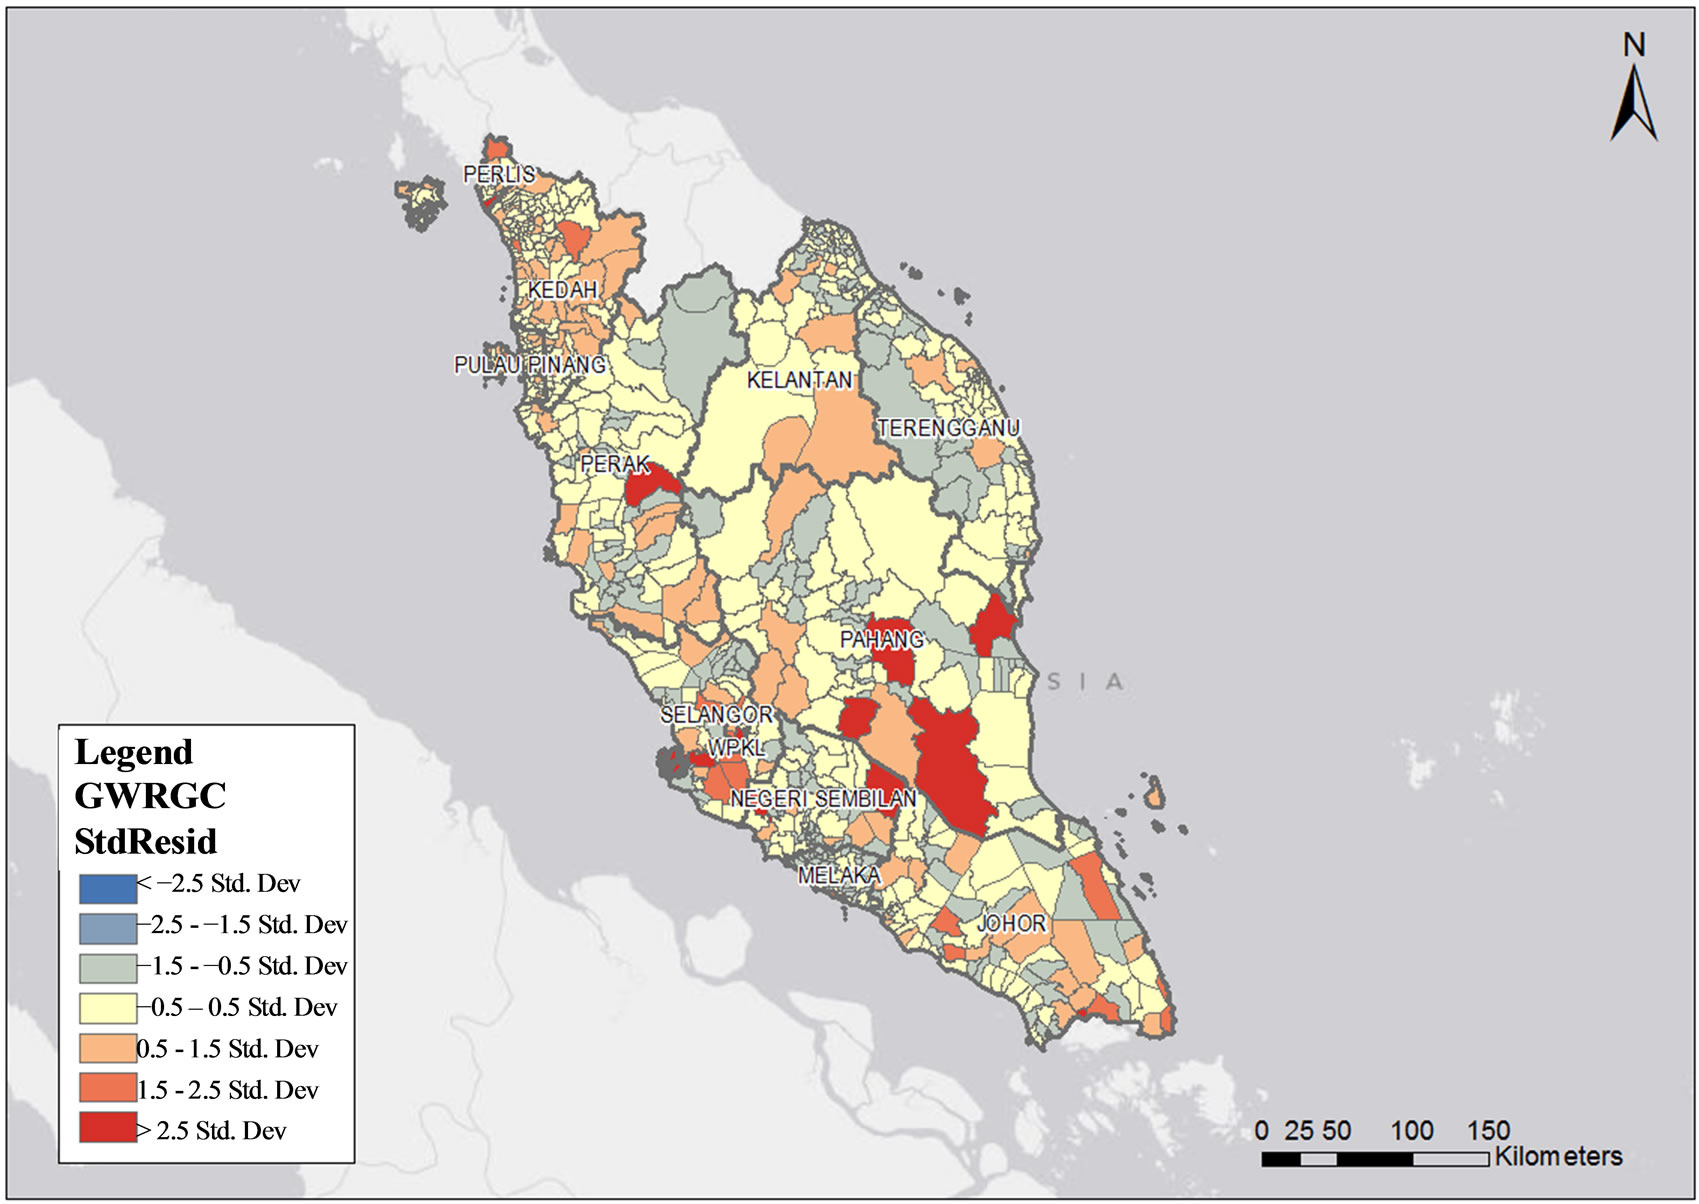
Figure 4. Public health clinics density in relation to population size by sub-district in Peninsular Malaysia.
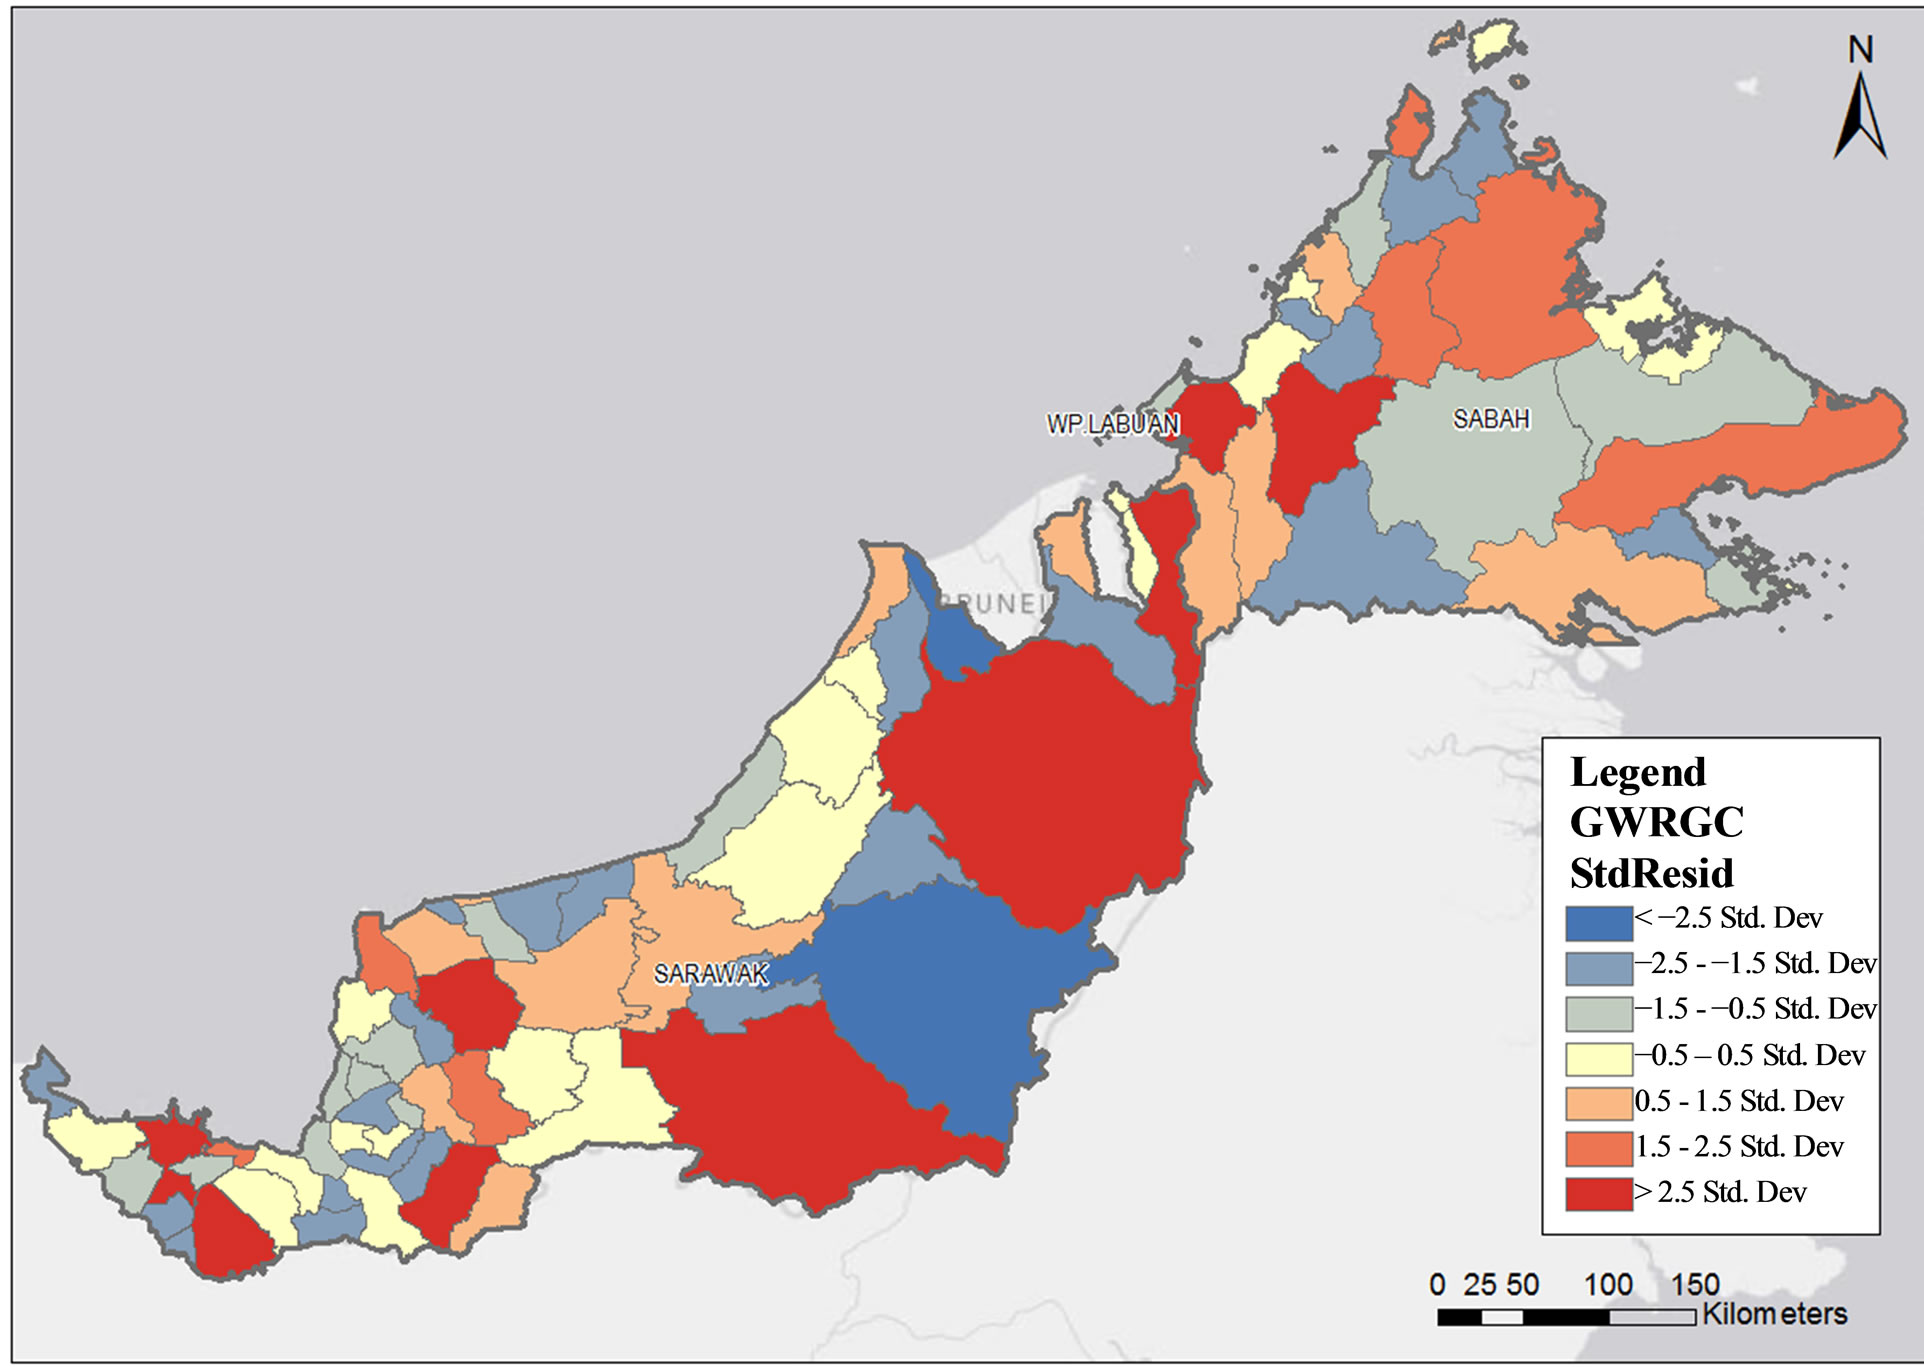
Figure 5. Public health clinics density in relation to population size by sub-district in Sabah and Sarawak.
GWR analysis identified 70 areas with a high density of public health clinics and 36 low density areas in Malaysia with standard residuals of more than 1.5 (p < 0.001). The high density localities in Peninsular Malaysia were nine in Johor (Sri Medan, Bukit Kepong, Sungai Balang, Johor Baharu, Mersing, Sedili Besar, Penggerang, Pantai Timur and Simpang Kanan), four in Pahang (Keratong, Rompin, Triang and Chenor), four in Negeri Sembilan (Labu, Repah, Gemencheh and Gemas), five in Selangor (Bandar Klang, Rawang, Dengkil, Tanjong Dua Belas and Bagan Nakhoda Omar), three in Perak (Ulu Kinta, Pasir Salak and Batu Yon), two in Kedah (Tekai and Tawar), two in Kelantan (Perupok and Kangkong), two in Terengganu (Jerangau and Hulu Nerus), one in Melaka (Melaka city), one in Pulau Pinang (Mukim 7) and one in Kuala Lumpur (Kuala Lumpur city) (Figure 4).
Meanwhile, in Sarawak, 11 localities were identified as high density localities, i.e. (Serian, Asajaya, Engkili, Lubok Antu, Pakan, Julau, Song, Tatau, Selangau, Long Lama and Lawas). In Sabah, five localities were identified as high density localities. They are Beaufort, Keningau, Tuaran, Ranau, Beluran and Lahad Datu.
The GWR analysis has also identified 15 high density areas of private health clinics in Peninsular Malaysia with standardized residuals of more than 1.5 (p < 0.001). Four high density areas were identified in Selangor (Damansara, Petaling Jaya, Bandar Klang and Sungai Buloh), two in Kuala Lumpur (Kuala Lumpur and Kuala Lumpur city), two in Perak (Ulu Kinta and Kampar), one in Pulau Pinang (Georgetown city), one in Kedah (Kota Setar), one in Kelantan (Kota Bharu), one in Negeri Sembilan (Seremban), one in Melaka (Melaka city) and one in Johor (Johor Baharu) (Figure 6). The highest density was noted in Klang Valley and Ipoh, with standardized residuals of more than 2.5. Meanwhile, there were no high density private health clinic areas identified in Sabah and Sarawak (Figure 7).
4. DISCUSSION
Primary health care services in Malaysia are delivered through an extensive network of static public and private health clinics throughout the country, complemented by community clinics and mobile clinics [2]. The spatial pattern of public health clinics in Malaysia showed a dispersed distribution in this study. This distribution reflects the conscious efforts of the Malaysian Ministry of Health in ensuring equitable distribution of health facilities in the country [2]. The coefficient surfaces generated using the GWR tool was helpful to identify the spatial patterns apparent in the study area. The utilisation of the density map was able to illustrate the variation in health clinics density within the plots. Because of the Government’s focus on rural development since independence, the public health clinics density in the major urban areas, such as in Kuala Lumpur, was relatively low because of the high population density. This relatively low density of public health clinics is complemented by the clustering of private clinics in the urban areas. However, as the concentration of private health clinics in the urban areas do not address equity in financial access to health care services, the ministry of health is addressing this issue
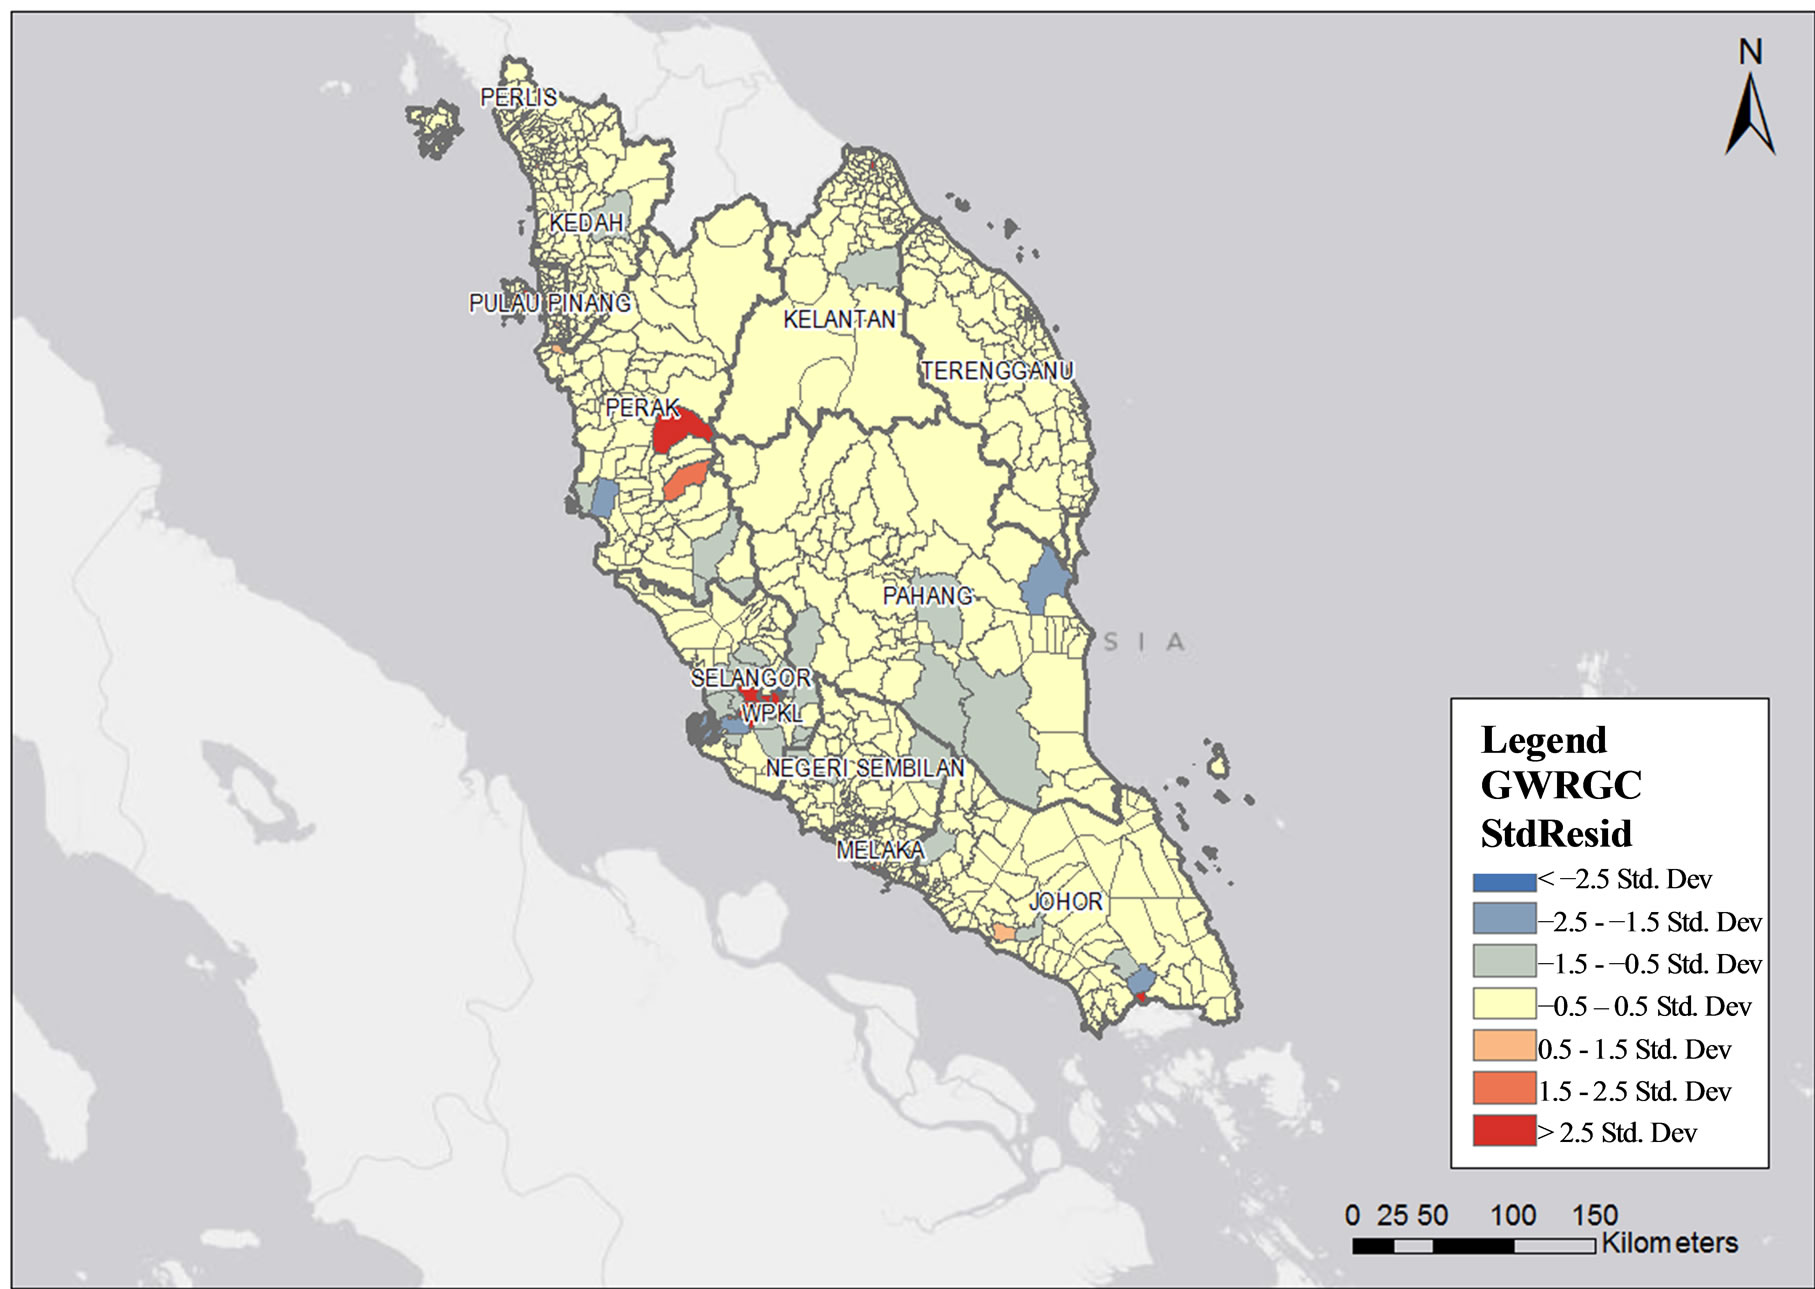
Figure 6. Private health clinics density in relation to population size by sub-district in Peninsular Malaysia.
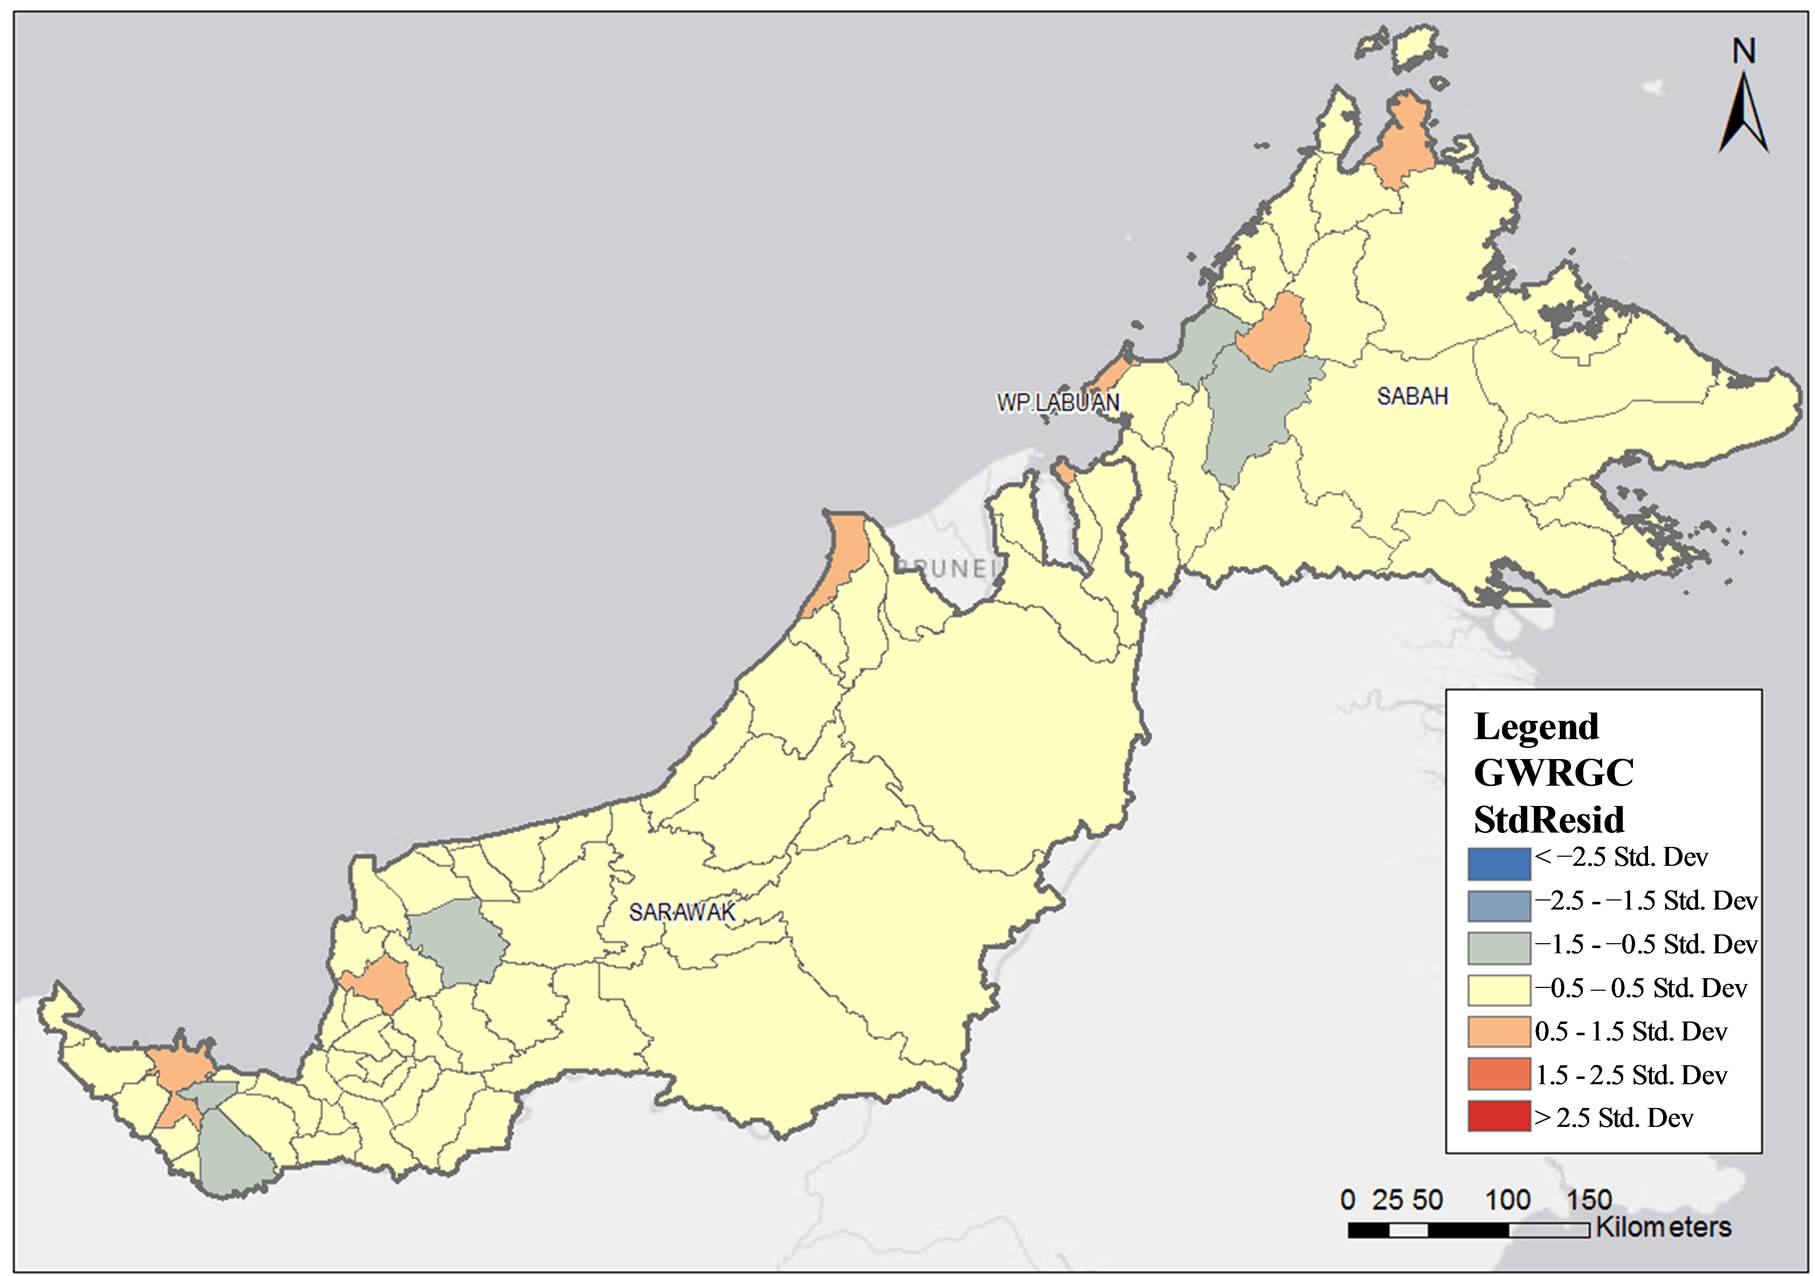
Figure 7. Private health clinics density in relation to population size by sub-district in Sabah and Sarawak.
with the development of alternative health facilities with smaller scope of health services delivered by paramedics, focusing on preventive care and curative care for minor ailments and procedures.
There were several states with a high density of public health clinics such as Johor, Pahang, Sarawak, Selangor and Perak. These are the geographically larger states and this finding reflects the focus given to ensuring geographical access by the development planners in the Ministry of Health. Although the norm for the sitting of a health clinic is based on population size (1:20,000 population) this norm is relaxed for the rural areas where geographical access poses a problem. In the remote areas of the country, even a population of less than 5000 will be considered for the development of a health clinic.
The clustered spatial distribution of private clinics concentrated in the urban areas reflect the influence of market forces on the decision making process for their development. Generally, they are profit driven entities and provide services to those who can afford to pay and to those who are covered by private insurance or by their employers the Malaysian Country Health Plan (2011) recognised the inequity in the distribution of private health facilities, with their concentration in the urban areas and providing mainly curative care [2]. A similar pattern can also be seen in other countries. For example, a private company in South Africa ran clinics in urban areas, which were usually located close to centres of employment such as factory complexes. However, some has gone extended into rural areas and small towns because of competition in cities [10]. In 2009, Masood Shaikh found similar result in Islamabad, Pakistan [11].
5. CONCLUSIONS
From this study, mapping of health clinics was proven to be a useful method to assist stakeholders and responsible authorities in the planning for health service delivery. This would include strengthening of existing services, development of new public health facilities and the approval for the development of new private health facilities in Malaysia. Consideration from the practitioner who wants to open a new private clinic could be more focused in densely populated areas with low numbers of existing private clinic. Special attention should be given to localities with a high density population in relation to the number of health facilities.
To address inequities in the distribution of health clinics in the country, the Ministry of Health, as the guardian of public health in the country, can guide the policy makers to invest government funding or provide incentives for the private sector to develop more health facilities in these identified areas, based on the spatial patterns of health clinics using GIS and spatial statistical tools as shown in this study [12]. In the urban areas, however, land for development of health facilities is scarce and expensive. Therefore, another alternative is to optimise the resources available in the dual health delivery system by improving access to the more numerous private facilities in the densely populated urban areas by outsourcing health services to them. In order to facilitate this outsourcing, a monitoring mechanism to ensure adherence to quality service and professional standards will be needed. It will also necessitate the development of a financing mechanism which will be affordable for the country in the long term. With this alternative of addressing financial access in the urban areas, government development funding can be prioritised to address geographical access issues still prevalent in the rural areas of the country.
6. ACKNOWLEDGEMENTS
The authors would like to thank the Director-General of Health Malaysia for permission to publish this paper. Special tribute to the Deputy Director of Health (Research and Technical Support) for the encouragement and support in the preparation and implementation of this study. Our sincere appreciation is also extended to all research team members, field support members and data processing members for their dedicated effort and commitment in carrying out the study.
REFERENCES
- Young, G.O. (1964) Ynthetic structure of industrial plastics. In: Peters, J., Ed., Plastics, 2nd Edition, McGrawHill, New York, 15-64.
- Graham, S.R., Carlton. C., Gaede, D. and Jamison B. (2011) The benefits of using geographic innformation systems as a community assessment tool. Public Health Reports, Dominica, 126-303.
- Ministry of Health (MOH) (2011) Pelan Strategik 2011- 2015. Ministry of Health (MOH), Kuala Lumpur.
- Ministry of Health (MOH) (2011) Country health plan, 10th Malaysia plan 2011. Ministry of Health (MOH), Kuala Lumpur.
- Farley Jr., E.S., Boisseau, V. and Froom, J. (1977) An integrated medical record and data system for primary care. Part 5: Implications of filing family folders by area of residence. Journal of Family Practice, 5, 427-432.
- Andrew, B., Robert, L. and Thomas, M. (2010) Harnessing Geographic Information System (GIS) to enable community-oriented primary care. JABFM, 23, 22-31
- Srividya, A., Michael, E., Palaniyandi, M., Pani, S.P. and Das, P. K. (2002) A geostatistical analysis of the geographic distribution of lymphatic filariasis prevalence in southern India. American Journal of Tropical Medicine and Hygeine, 67, 480-489.
- Department of Statistic, Malaysia (2011) Population distribution and basic demographic characteristics 2010.
- Mitchell, A. (2005) The ESRI guide to GIS analysis: Volume 2: Spatial measurements and statistics. ESRI Press, Redlands.
- Fotheringham, A.S., Brunsdon, C., et al. (2002) Geographically weighted regression: The analysis of spatially varying relationships. Wiley, Hoboken.
- Palmer, N., Mills, A. and Wadee, H. (2003) A new face for private providers in developing countries: What implications for public health? Bulletin of the World Health Organisation, 81, 292-297.
- Shaikh, M. (2009) Spatial distribution of health facilities in Islamabad, Pakistan. Eastern Mediterranean Health Journal, 594 A, 3.
- Aronson, R.E., Wallis, A.B., O’Campo, P.J. and Shafer, P. (2007) Neighborhood mapping and evaluation: Methodology for participatory community health initiatives. Maternal and Child Health Journal, 11, 373-383. http://dx.doi.org/10.1007/s10995-007-0184-5