American Journal of Plant Sciences
Vol.5 No.18(2014), Article
ID:49357,13
pages
DOI:10.4236/ajps.2014.518299
Iron Nutrition vis-à-vis Aconitase Activity and Ferritin Accumulation in Tropical Indica Rice Cultivars Differing in Grain Iron Concentration
Binay Bhusan Panda1, Srigopal Sharma2, Pravat Kumar Mohapatra3, Avijit Das2*
1Institute of Life Sciences, Nalco Square, Bhubaneswar, India
2Division of Crop Physiology and Biochemistry, Central Rice Research Institute, Cuttack, India
3School of Life Sciences, Sambalpur University, Sambalpur, India
Email: *avijitcrri@gmail.com
Copyright © 2014 by authors and Scientific Research Publishing Inc.
This work is licensed under the Creative Commons Attribution International License (CC BY).
http://creativecommons.org/licenses/by/4.0/


Received 19 June 2014; revised 23 July 2014; accepted 25 August 2014
ABSTRACT
Effect of Fe nutrition on Fe acquisition, aconitase enzyme activity and assimilation of the element in ferritin protein was studied in two indica rice cultivars viz. Sharbati and Lalat having contrasting grain Fe concentration. Young rice seedlings were grown in hydroponics with different levels of Fe. For comparison, the two cultivars were also grown in the field under natural conditions of rice culture. Iron accumulation, aconitase activity and ferritin level were higher in the high Fe containing cultivar, Sharbati than that in the low Fe containing cultivar, Lalat. While aconitase activity increased consistently with the increase in concentration of Fe in the growing medium, the same was not found to be true for accumulation of ferritin protein. The leaf ferritin level increased up to a certain level of Fe in the growing medium and declined thereafter. Levels of Fe in the growing medium giving maximum ferritin synthesis were found to be different in the two rice cultivars. In both cultivars, aconitase activity attained maximum level after 20 days of panicle emergence (heading). Pattern of Fe accumulation in the leaves in response to increasing Fe level in the nutrient solution paralleled with that of the aconitase activity indicating a positive correlation. It was concluded that accumulation of both ferritin protein and aconitase enzyme were influenced not only by the Fe level in the growing medium but also by the internal Fe concentration of the two cultivars.
Keywords:Rice, Iron, Aconitase, Ferritin

1. Introduction
Fe toxicity is a major problem for tropical rice cultivation in rainfed lowland and irrigated ecologies. Waterlogged soil sustains ferrous form of Fe causing greater absorption of the element by plants [1] and thus, leads to greater accumulation of the element in cells. Excess Fe causes bronzing of leaves, blackening of roots and damages to cellular membranes [1] -[5] and subsequent loss of grain yield [6] . Loss of 50% grain weight was reported in rice plants with leaf Fe concentrations higher than 250 μg∙mL−1 on dry weight basis [6] . However, rice cultivars have been reported to differ in their response to Fe stress; those with lower Fe concentration were found to have higher tolerance to Fe toxicity [7] . Reaction of free Fe2+ ions with molecular oxygen can lead to generation of reactive oxygen species (ROS) that injure cells. Ferritin is the only protein known to concentrate Fe to the level required by the cells, to store it in a soluble and biologically available form, to release it when required, and to protect the cells against the toxic effects of excess Fe [8] .
Iron chelation is another essential process for Fe homeostasis in plants that renders the free Fe into a nonFenton active form [9] . Chelated forms of Fe exist as Fe-S clusters in a variety of metalloproteins performing a number of biological activities, including electron transfer, regulation of gene expression and as sensor of Fe and oxygen in living cells [10] . Aconitase enzyme which catalyzes isomerization of citrate to isocitrate in TCA cycle has an active 4Fe-4S cluster.
The role of cytosolic aconitase enzyme is well known in post-transcriptional regulation of ferritin and transferrin receptor synthesis in animal system by the IRE (iron-responsive element)/IRP1 (iron-regulatory protein 1) Fe switch. However, the IRE/IRP1-cytosolic aconitase-Fe regulatory switch does not seem to operate in plants [11] . Instead, Fe regulates ferritin synthesis in plants at the transcriptional level rather than mRNA stability or translational levels as observed in animal cells [12] [13] . Nonetheless, both ferritin accumulation and aconitase enzyme activity in plants are reported to respond to the Fe status of the growing medium [14] -[18] . Rice cultivars were reported to vary in grain Fe concentrations with the low Fe containing cultivars having lower concentration of Fe in different plant parts [19] . It will be very interesting to study the effect of varying external Fe levels on aconitase activity and ferritin accumulation in rice cultivars with contrasting grain Fe concentration. The present work was, thus, undertaken to study the effect of Fe nutrition on accumulation of Fe, ferritin protein and aconitase enzyme in two tropical indica rice cultivars having contrasting grain Fe concentration.
2. Materials and Methods
Selection of Contrasting Genotypes and Plant Culture
Two indica rice cultivars viz. Sharbati and Lalat with contrasting grain Fe concentration (8 and 26 ppm, respectively) were originally selected from a stock of rice germplasm collected from the Rice Gene Bank of the Central Rice Research Institute, Cuttack, India. Selection process involved growing large number of germplasm in an augmented design and determining the grain Fe concentration with an atomic absorption spectrophotometer. The selected cultivars were further grown in three consecutive seasons in RBD with 3 replications (Table 1). These two cultivars viz. Sharbati and Lalat not only had contrasting grain Fe concentration but also had equal crop duration (100 - 110 days). Seeds of the cultivars were surface sterilized by immersing them in a 4% solution of commercial sodium hypochlorite for 10 min, followed by repeated washing with glass-distilled water and then allowed to germinate at 30˚C in darkness. The seedlings were raised without Fe for 7 days in a hydroponic culture (in 100 ml plastic cup containing 50 ml nutrient solution) inside a glass house under prevalent ambient conditions. The nutrient solution [21] contained (g∙L−1): NH4NO3, 91.4; NaH2PO4∙2H2O, 40.3; K2SO4, 71.4; CaCl2, 88.6; MgSO4∙7H2O, 32.4; MnCl2∙4H2O, 1.5; (NH4)6Mo7O24∙4H2O, 0.074; H3BO3, 0.934; ZnSO4∙7H2O, 0.035; CuSO4∙5H2O, 0.031; C6H8O7H2O, 11.9; Na2SiO3∙9H2O, 16.2. The solution was renewed every day and adjusted to pH 5.5. Seven days old seedlings with uniform growth and development were raised with six levels of Fe treatments viz. (0, 2, 5, 15, 50, 250 ppm) for different durations (Experiment I). In another experiment (Experiment II), 7 days old seedlings were grown for another 7 days with four levels of Fe (0, 2, 5, 10 ppm). In both the experiments Fe was supplied as Ferric-EDTA. Plastic cups containing 30 - 35 rice seedlings each were arranged in a completely randomized block design with three replications.
For comparison, the cultivars were also grown in the research farm of Central Rice Research Institute, Cuttack-753006, Orissa, India (latitude 20˚N and longitude 86˚E) during the wet season of 2009 (Experiment III). Seedlings were raised in a nursery bed for 30 days before transplanting to 3 m × 3 m plots with hill spacing of

Table 1 . Iron concentration (ppm) of the brown rice grains of the six indica rice cultivars.
Difference in grain Fe content among different seasons within a cultivar means (n = 3) followed by a common letter are not significantly different (P < 0.05) by Duncan’s multiple range test (DMRT). The cultivars were grown in the field condition for three consecutive seasons and grains were harvested from the main shoot and analysed for Fe content (ppm) in an Atomic Absorption Spectrophotometer.
20 cm × 15 cm, planting one seedling per hill. Each cultivar had four plots as repetitions in a completely randomized block design. The soil of the experimental area was sandy loam type and contained 100 - 200 ppm of available Fe. The field was ploughed and puddled before transplantation and supplemented with N, P and K @ 80:40:40 Kg∙ha−1. Fifty percent of N and whole of P and K were applied as basal and rest of the N was applied in two equal splits—at active tillering and at panicle initiation stages.
3. Sampling
Samples (leaf, shoot and root) were collected from the hydroponically grown plants after different durations of growth. Plant samples were processed further for measurement of different components as discussed in the latter sections. In Experiment I, samples were collected after every 24 h up to 72 h; while in the case of Experiment II sampling was done after 7 days of growth in the Fe supplemented medium.
In the field experiment (Experiment III), seedlings with uniform growth and development were selected and the main shoot of the plants were tagged at the tillering stage. Fully opened uppermost leaf and stem of the main shoot were excised at maximum tillering and panicle emergence (heading) stages of development. Three more samplings were done at 10, 20 and 30 days after panicle emergence.
Fresh plant tissues were used for extracting aconitase enzyme and ferritin protein.
3.1. Estimation of Total Fe
Completely dried plant parts (2 g in case of grains and 100 - 500 mg in case other plant parts) were digested in a di-acid mixture (HNO3:HCLO4::15:2, v/v). Samples were immersed in 15 ml conc. HNO3 in a conical flask and allowed to stay overnight followed by addition of 2 ml HClO4. The samples were digested on a hot plate at 60˚C for 2 h followed by further digestion at 90˚C until white fumes of HClO4 started effervescing out. The content of the flask was ransferred to a 50 ml volumetric flask with repeated washings with double distilled water and the volume was made up. The solution was filtered through a Whatman No. 41 filter paper. The filtrate was used to determine Fe with an atomic absorption spectrophotometer (GBC, Avanta).
3.2. Chlorophyll Estimation
Fresh leaf samples weighing 0.5 g were homogenized with 80% chilled aqueous acetone using a cold mortar and pestle. The homogenate was centrifuged at 5000 × g and the supernatant was collected. The residue was extracted twice further in similar manner. Total chlorophyll concentration was estimated in the pooled supernatant according to Arnon [22] .
3.3. Extraction and Assay of Aconitase Enzyme (EC 4.2.1.3)
Fresh leaves (0.5 g) were chopped into small pieces and homogenized with 2.5 ml of cold extraction buffer (0.2 M Tris-HC1, pH 8.5, containing 0.5 M sucrose and 5 mM EDTA) using a pre-chilled mortar and pestle. The homogenate was centrifuged at 13000 × g for 20 min at 4˚C. The supernatant was used for enzyme assay following the procedure of Bacon et al. [23] . The assay mixture contained 0.05 M sucrose, 0.5 M sodium (±) isocitrate buffered with 0.1 M Tris. HCl (pH 8.0). An aliquot of 25 to 100 µl leaf extract was added to the assay tube and the final volume was made up to 3 ml. Absorbance was measured at 240 nm at 5 min interval over a period of 30 min. A control [without sodium (±) isocitrate] was also run. Micromoles of aconitate formed were calculated from an extinction value of 0.71 for 0.2 mMcis-aconitate [24] . One unit of aconitase enzyme activity was defined as the amount of enzyme that formed one µmole of cis-aconitate h−1.
3.4. Nondenaturing Polyacrylamide Gel Electrophoresis and Staining for Aconitase Activity
Aliquots of crude extract (containing 100 μg proteins) were run on a non-denaturing polyacrylamide gel (7.5%) and the enzyme activity was visualized on the gel by a specific stain [25] . The staining solution contained 0.08 M Tris. HCl, 0.1% cis-aconitic acid, 0.02 M MgCl2, 0.01% NADP, 0.01% methylthiazolyldiphenyl-tetrazolium bromide (MTT), 0.002% phenazinemethosulphate (PMS) and 2 - 3 units of isocitrate dehydrogenase. The gel was incubated in the staining solution for 1.5 h at 30˚C for development of enzyme activity bands.
3.5. Extraction, Electrophoresis and Staining of Ferritin Protein
Crude extract containing ferritin protein was extracted from 1.0 g fully opened fresh plant leaves following the second procedure of Laulhere et al. [26] . Electrophoresis of the crude extract containing ferritin protein was carried out under non-denaturing conditions on a 6% polyacrylamide gel, and ferritin protein was selectively stained according to the method of Chung [27] . The staining solution consisted of a freshly prepared mixture of 0.75 mM Feren S (Sigma-Aldrich, USA) and 15 mM thioglycollic acid (in 2% acetic acid). The gel was immersed in the staining solution till greenish yellow ferritin bands became visible. The gel background was cleared by destaining in a 2% acetic acid solution.
Protein estimation was carried out by the method of Bradford [28] .
3.6. RT-PCR Analysis
Total RNA was extracted from plant samples using the RNeasy Plant Mini Kit (Qiagen, Gmbh, Germany) according to the manufacturer’s instructions. First-strand cDNA synthesis was carried from total RNA using “Revert Aid First Strand cDNA synthesis kit” (Fermentas, Canada). Semi-quantitative RT-PCR was performed using PCR Master mix kit (Fermentas, Canada) on an Eppendorf Master Cycler Pro. PCR conditions were 94˚C for 2 min followed by cycles (33 cycles for ferritin, 40 cycles for aconitase and 30 cycles for β-tubulin) of amplification: 94˚C for 15 s, 65˚C for 30 s, 72˚C for 1 min. Amplification of two ferritin mRNAs was performed following procedure of Stein et al. (2009) [29] using two primers: forward (5’-TCACTCTTCACCCGCCGCG-3’) and reverse (5’-TCGACGAACTTTTGCCTAGC-3’). Primers for amplifications of aconitase (cytosolic) and β-tubulin were: forward 5’-ACGGAGTGAAGGATGCTTTCTGC-3’ and reverse 5’-CAACTGTCGAATGACGTACGGGA-3’ and forward 5’-TCTTCCACCCTGAGCAGCTC-3’ and reverse 5’-AACCTTGGAGACCAGTGCAG -3’, respectively.
3.7. Statistical Analyses
Experiments were conducted in a completely randomized block design and the results were presented as means ± sd of 3 independent replications. Means were tested by t-test at 5% level of significance. Correlation coefficients were calculated using MS Office Excel programme.
4. Results
Two indica rice cultivars viz. Sharbati and Lalat having contrasting grain Fe concentration were raised with different levels of Fe in the nutrient solution. These two cultivars were also grown in the field having sufficient level of available Fe (100 - 200 ppm) in the soil. Plant samples were analyzed for Fe accumulation, aconitase enzyme activity and assimilation of the element in ferritin protein.
4.1. Fe Accumulation in Plant Parts
Total Fe concentrations were measured in different parts of the seedlings of the two rice cultivars raised with different levels of Fe for different periods of growth in hydroponic culture and (Figure 2(a)). Increased supplementation of Fe in the growing medium increased concentration of the element in leaves of both the cultivars. However, as compared to lower level of Fe supplementation, with 250 ppm there was a massive increase in Fe accumulation beyond 48 h (Figure 2(a)). Seedlings of Sharbati accumulated more Fe than Lalat even though the pattern of accumulation was identical (Figure 1(a)). In Experiment II, one week-old seedlings of Sharbati and Lalat when grown for another 7 days with different levels of Fe, Sharbati was again found to accumulate more Fe in both leaves and roots than Lalat (Figure 2(b)). However, response of root to the increasing Fe level was greater than the leaves (Figure 2(b)).
For comparison, the same cultivars were also grown in the field (Experiment III) where available Fe concentration in the soil ranged from 100 - 200 ppm. Iron concentration was determined in different plant parts of the field grown plants at maximum tillering (20 days before heading), 0 (at heading ), 10, 20 and 30 days after heading (Figure 2(c)). Until heading, Fe concentration was highest in the second leaf from the top followed by first leaf, third leaf, leaf sheath and stem. However, 10 days after heading, the flag leaf had maximum Fe concentration which declined in a basipetal order in the lower leaves (Figure 2(c)). Iron concentration in the flag leaf declined below that of the second leaf again after 20 days of heading (Figure 2(c)). In comparison with other plant parts, concentration of Fe was low in the leaf sheath and stem. On all occasions, increase in Fe concentration was more gradual in Lalat than Sharbati and the various organs of Sharbati possessed higher concentration of Fe than those of Lalat (Figure 2(c)).
4.2. Chlorophyll Concentration
Chlorophyll concentration of leaves of both the cultivars raised with different concentrations of Fe increased with increase in the concentration of Fe in the growing medium. However, except at 0 ppm, Lalat had higher chlorophyll concentration than Sharbati (Figure 3).
4.3. Aconitase Activity in the Leaves of Hydroponically Grown Seedlings and Field Grown Plants
Aconitase activity in the leaves of hydroponically grown seedlings of both the cultivars increased with increase
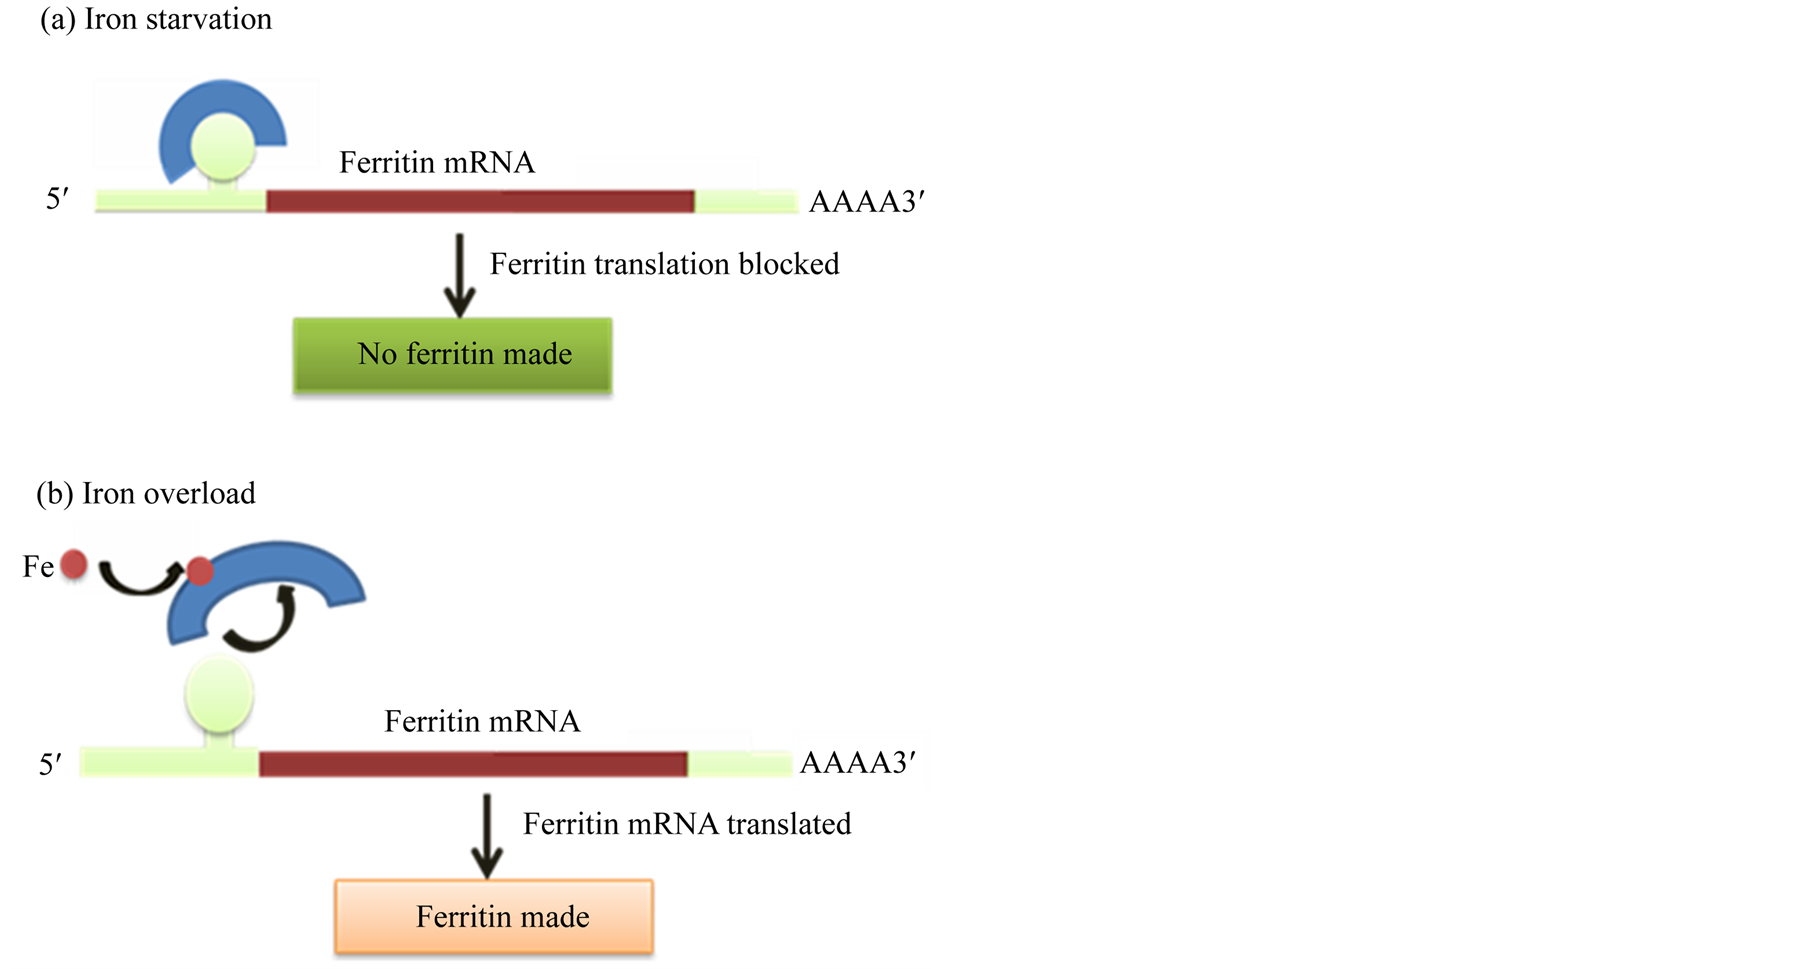
Figure 1. Role of cytosolic aconitase in ferritin expression in animal cells [20] .
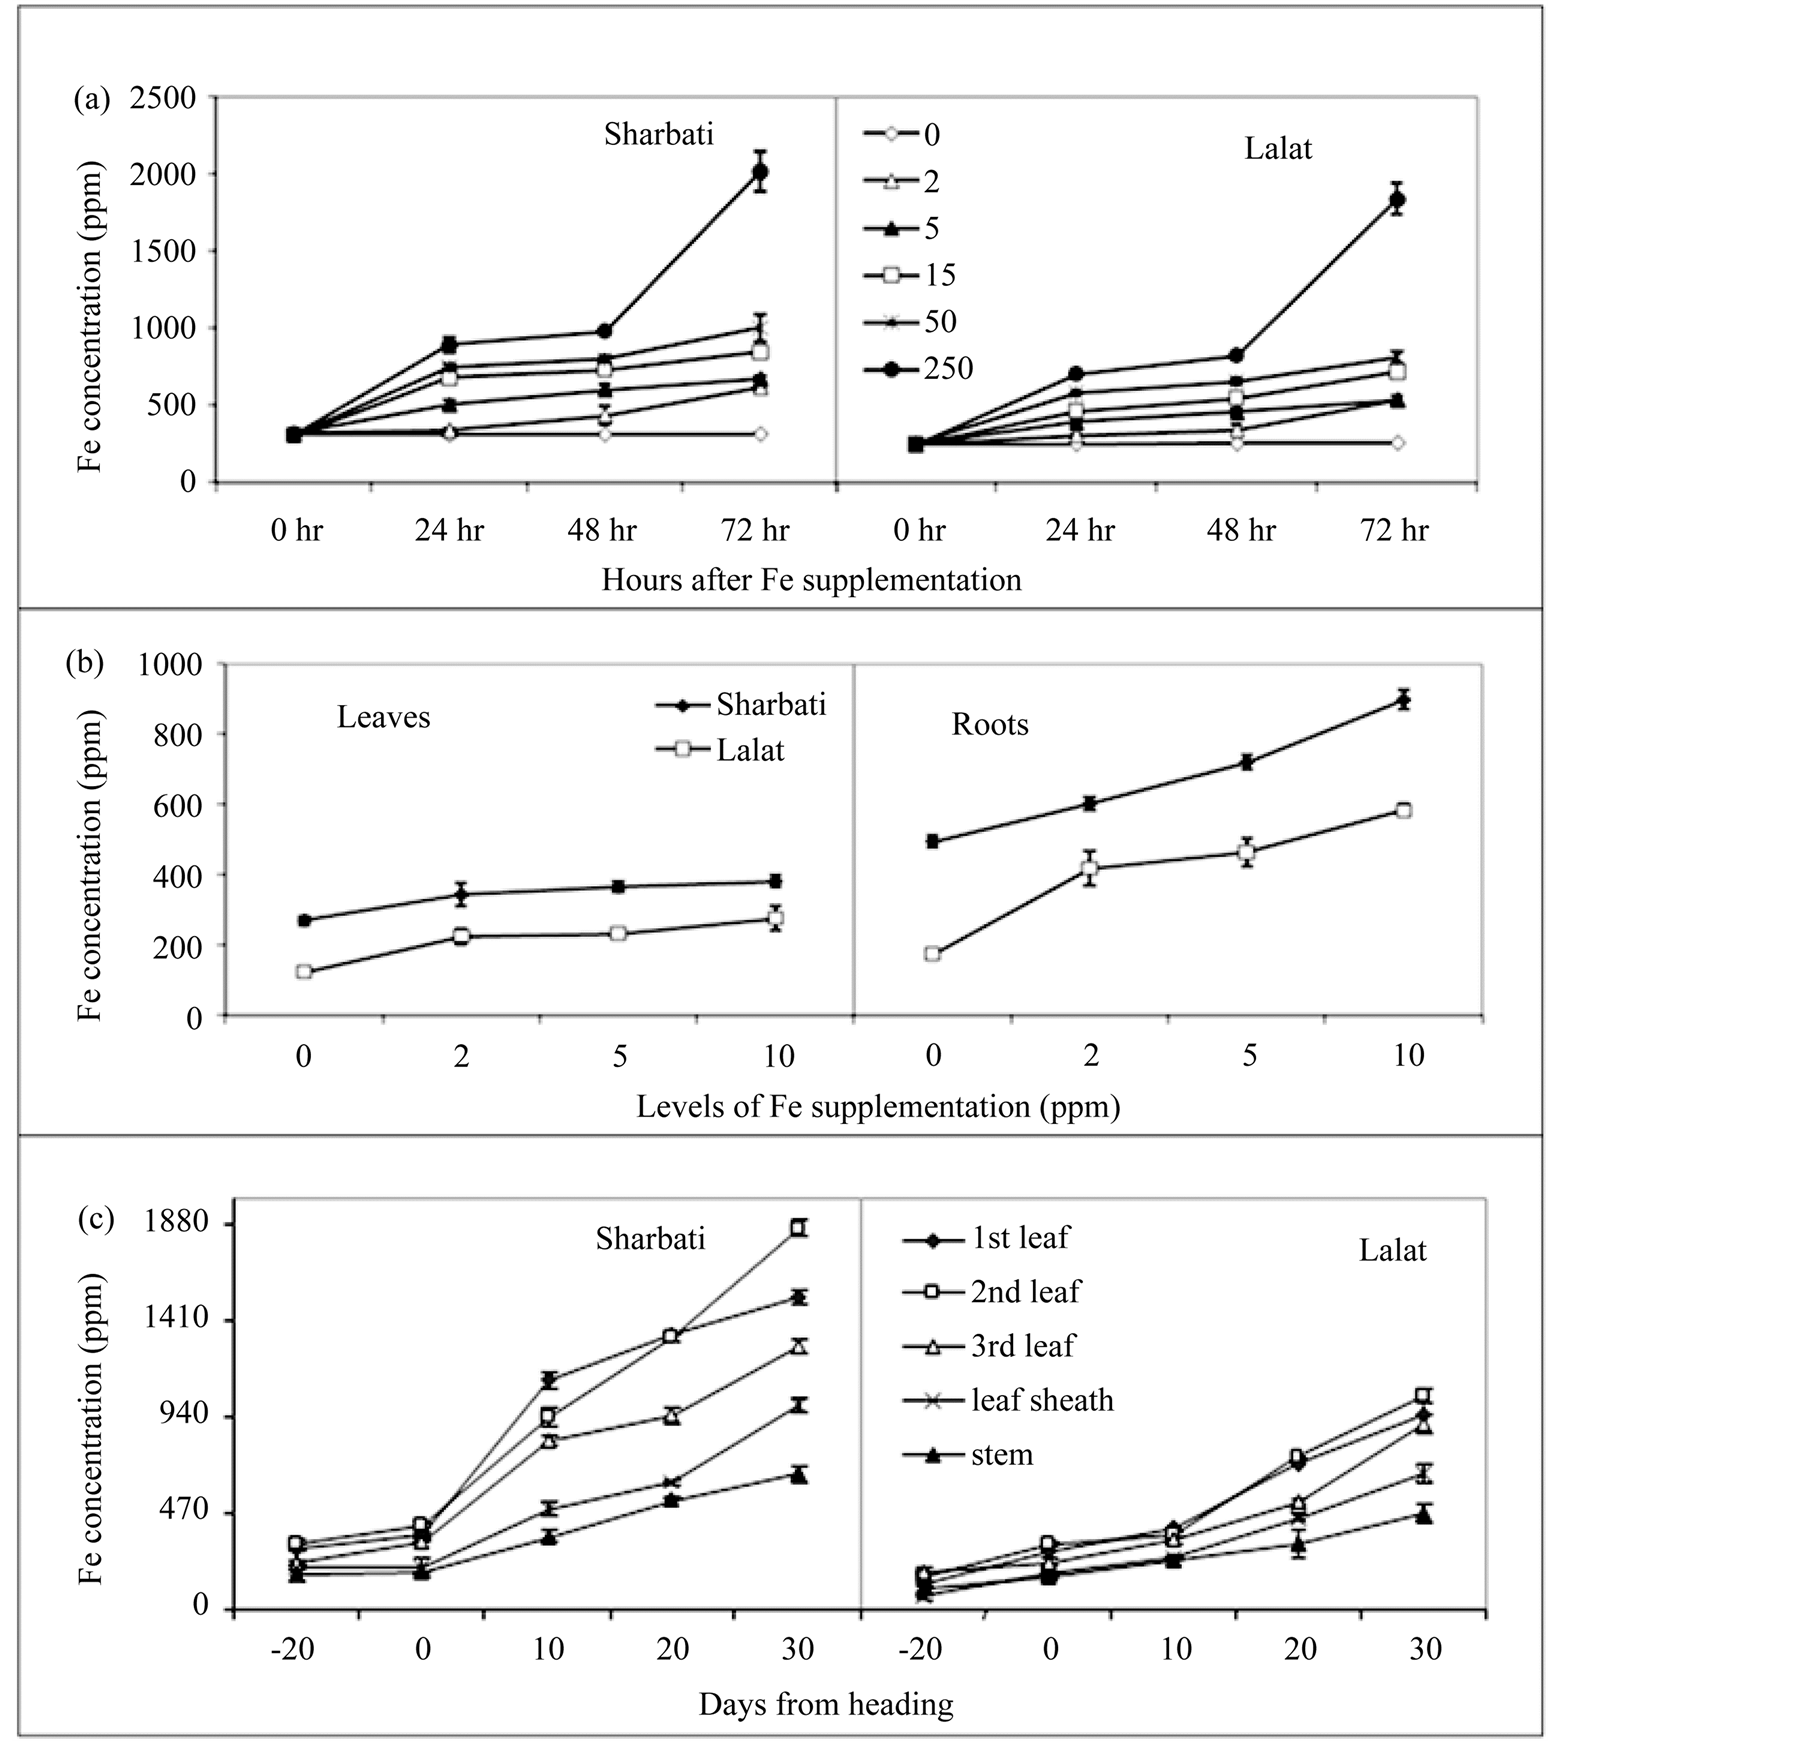
Figure 2. Temporal changes in total Fe concentration in different parts of rice plant. (a) Experiment I —rice seedlings were raised in hydroponics containing 0, 2, 5, 15, 50 and 250 ppm of Fe for different hours (0 to 72 h) after Fe supplementation; (b) Experiment II—rice seedlings were raised in hydroponics with 4 levels of Fe (0, 2, 5 and 10 ppm) for 7 days (sampling was done on 14 days old seedlings). Seedlings were raised without Fe for 7 days in hydroponic culture and then grown with different levels of Fe for different periods. Iron concentration was measured in leaves and roots of the seedlings; (c) Field experiment—temporal changes in total Fe concentration in different plant parts of the two cultivars at −20 (maximum tillering), 0 (panicle emergence or heading), 10, 20 and 30 days after heading. Vertical bars represent mean ± sd of 3 replicates. Means were tested by t-test at 5% level of significance.
in Fe level of the growing medium (Figure 4(a)). However, the high Fe containing cultivar, Sharbati showed higher activity than the low Fe containing cultivar, Lalat (Figure 4(a)). The observations were further substantiated by activity staining of the enzyme on native polyacrylamide gel (Figure 4(b)) as well as expression analysis of the aconitase gene by RT-PCR (Figure 4(c)).
In the field grown plants aconitase activity was also higher in Sharbati than Lalat (Figure 5). Enzyme activity increased from maximum tillering stage (20 days before heading) and reached highest level on 20 days after heading. Increase in enzyme activity was more gradual in Lalat than Sharbati. Enzyme activity was highest in the first leaf (flag leaf is the first leaf following heading) which was followed by second and third leaves from
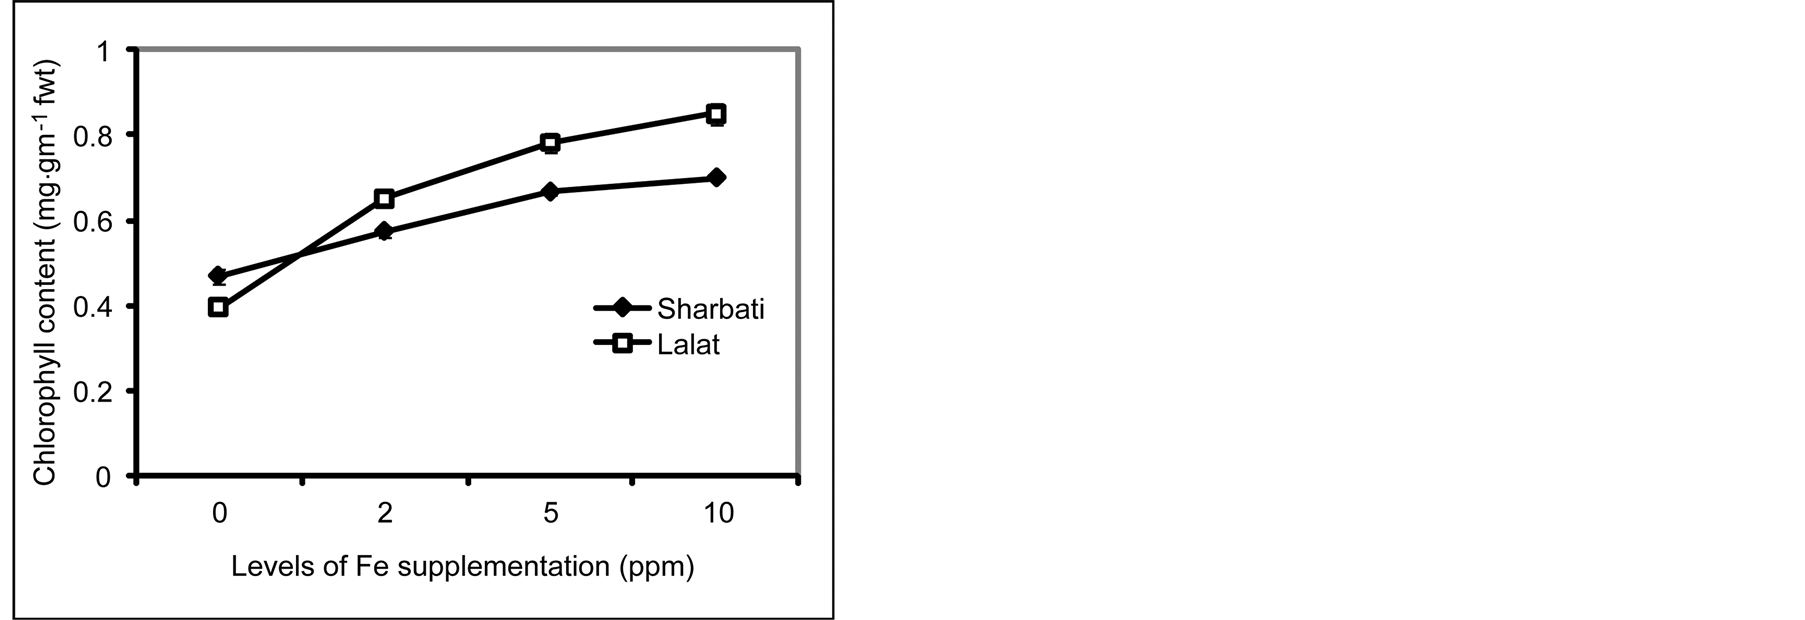
Figure 3. Effect of Fe level on chlorophyll content of the leaves of 14 days old seedlings of two indica rice cultivars (Sharbati and Lalat) grown in hydroponics (Experiment II). Seedlings were raised without Fe for 7 days and then grown with four levels of Fe (0, 2, 5, 10 ppm) for another 7 days. Vertical bars represent mean ± sd of 3 replicates. fwt = fresh weight. Means were tested by t-test at 5% level of significance.
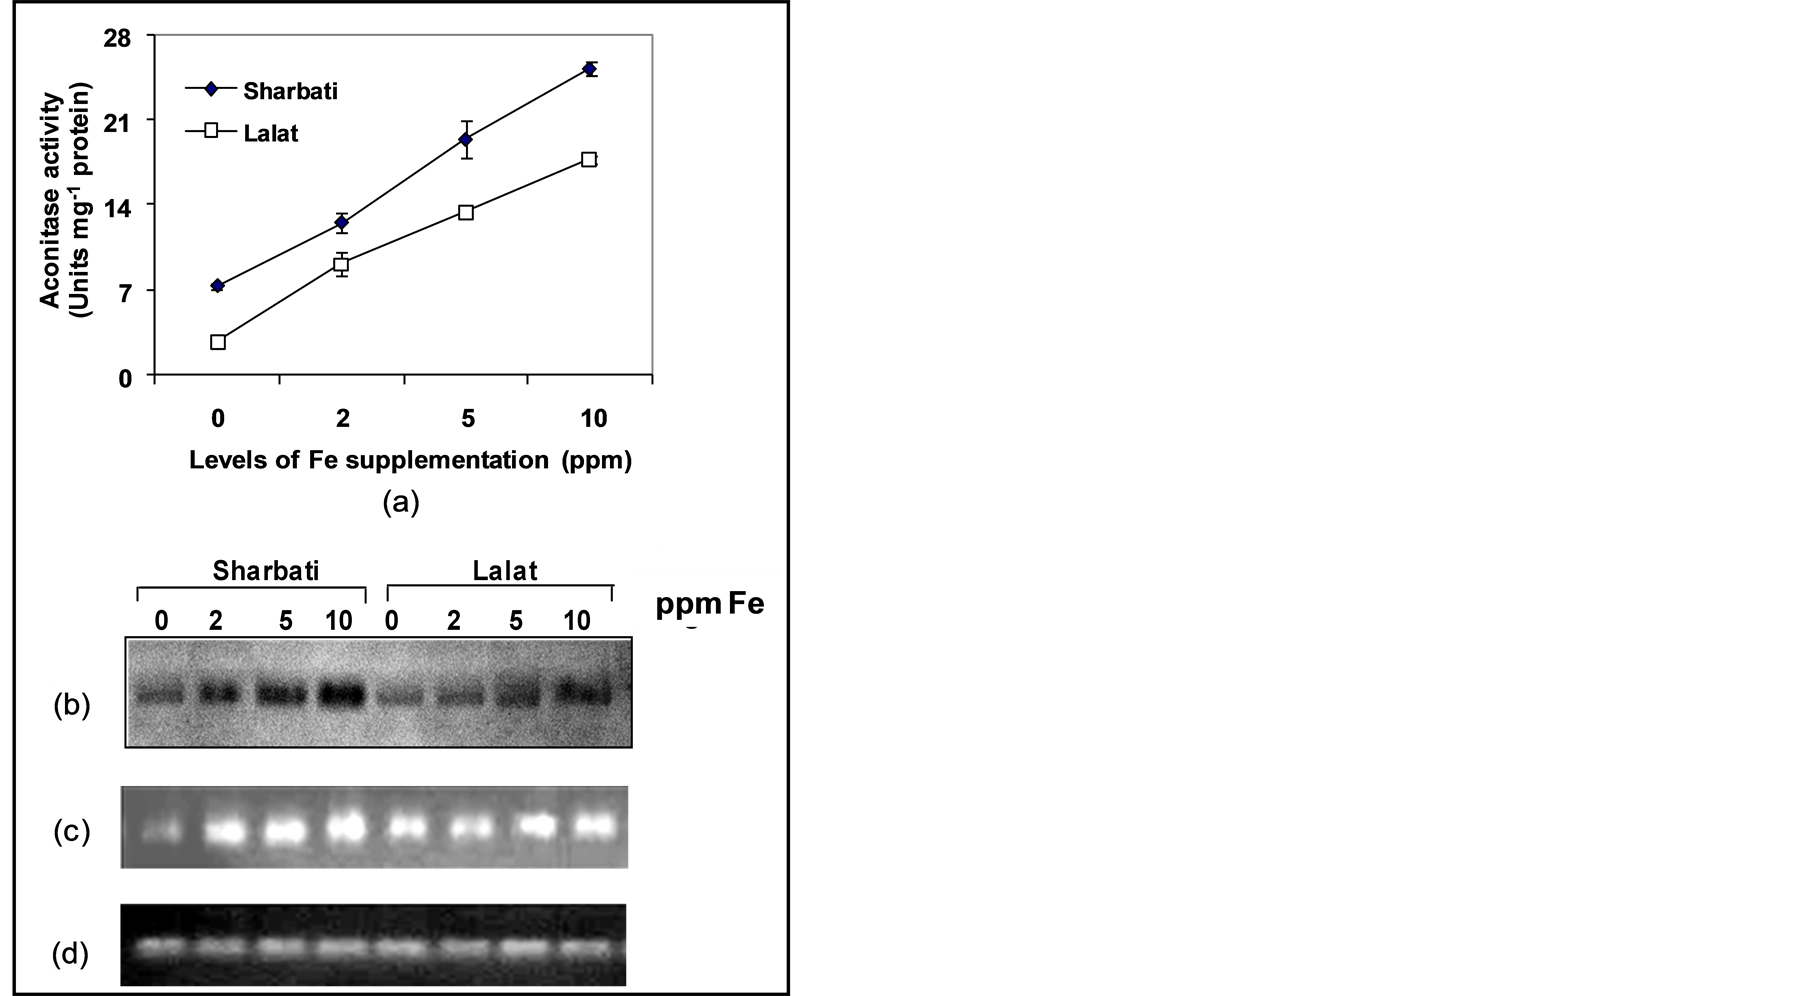
Figure 4. Effect of Fe level on aconitase enzyme activity (a) activity staining of aconitase enzyme on native PAGE (b), aconitase gene expression by RT-PCR (c) in the leaves of 14 days old rice seedlings of two indica rice cultivars (Sharbati and Lalat) grown in hydroponic culture. β-tubulin (d) was used as loading control in RT-PCR. Seedlings of the two indica rice cultivars (Sharbati and Lalat) were raised without Fe for 7 days and then grown with four levels of Fe (0, 2, 5, 10 ppm) for another 7 days. Leaf extract containing 100 μg of soluble proteins was run in each lane of a 7.5% native polyacrylamide gel and stained with specific stain for aconitase activity. RT-PCR products were electrophoresed on a 1.5% agarose gel. Vertical bars represent mean ± sd of 3 replicates. Means were tested by t-test at 5% level of significance.
the top in a sequence in both the cultivars (Figure 4). Leaf sheath and stem had lower activity of aconitase enzyme. Aconitase activity was higher in different parts of Sharbati than Lalat on different days (Figure 4). Enzyme assay data were further corroborated by activity staining of the enzyme on native polyacrylamide gel (Figure 5).
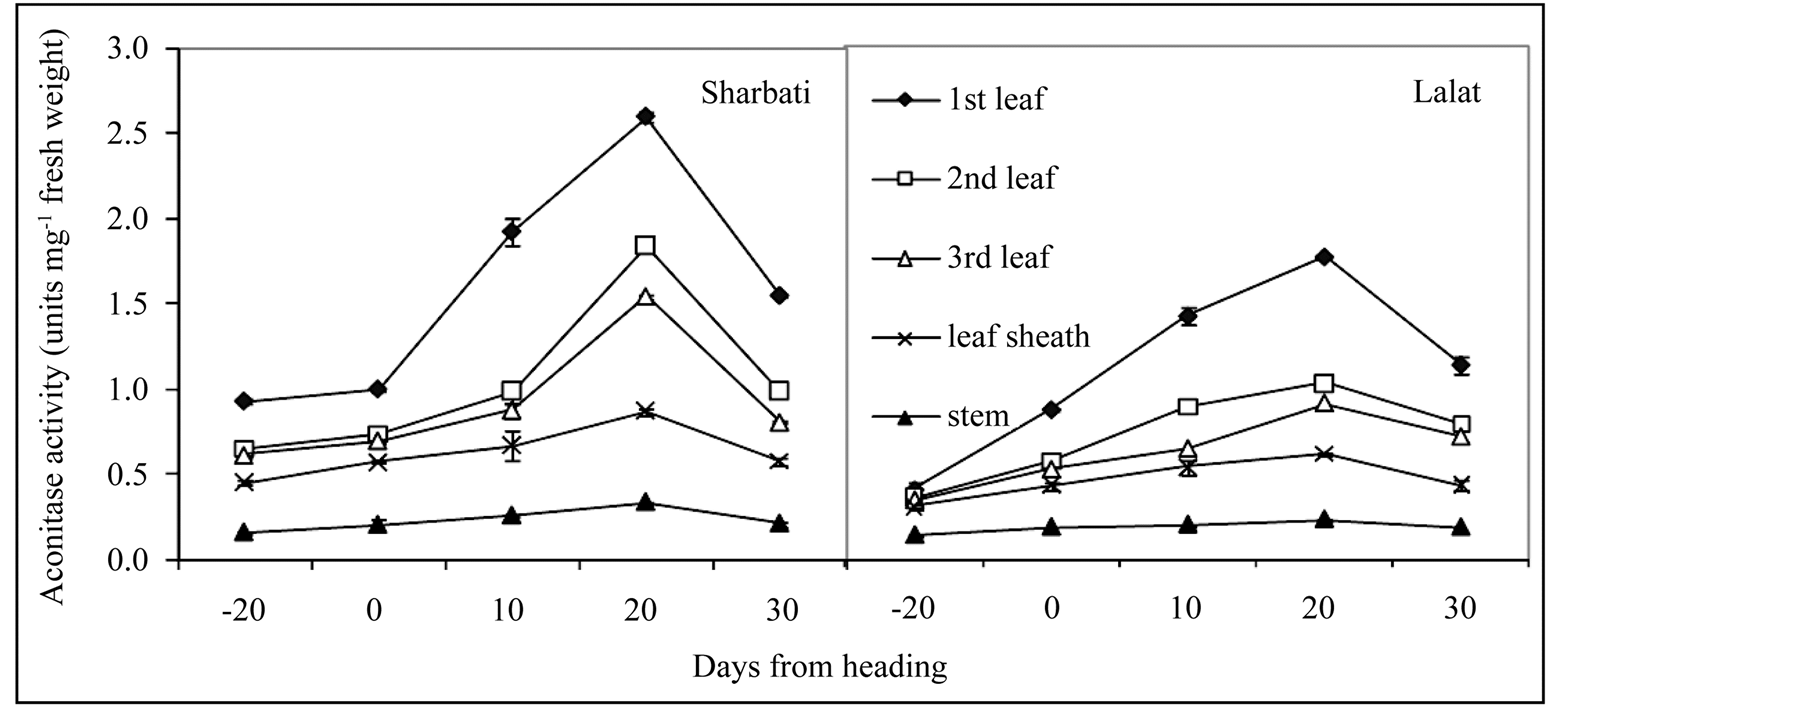
Figure 5. Temporal changes in total aconitase activity in different parts of field grown plants of two indica rice cultivars (Sharbati and Lalat) at −20 (maximum tillering), 0 (heading), 10, 20 and 30 days after panicle emergence (heading). Vertical bars represent mean ± sd of 3 replicates. fwt: fresh weight. Means were tested by t-test at 5% level of significance.
4.4. Accumulation of Ferritin Protein
Ferritin level in the leaves of hydroponically grown rice seedlings (Figure 6) and different parts of field grown rice plants was visualized on native polyacrylamide gel (Figure 7). In both the cultivars, ferritin protein accumulation in the leaves increased with increase in the level of Fe in the growing medium, the concentration being higher in the high Fe containing cultivar, Sharbati than the low Fe containing Lalat (Figure 6). While in Sharbati, maximum ferritin accumulation was observed with 2 ppm of Fe in the growing medium, Lalat showed maximum ferritin accumulation with 5 ppm of Fe, although the ferritin level was much lower than that in Sharbati (Figure 6(a)). This observation was further substantiated by RT-PCR results (Figure 6(b)). In the field grown plants, ferritin protein accumulation was highest in the uppermost leaf (flag leaf) and declined in the lower leaves in a basipetal manner after different days of heading. Ferritin protein reached highest level in different organs after 20 days of heading and then declined (Figure 7). In the leaf sheath and spikelet (basal and apical) of Sharbati, ferritin protein accumulation reached detectable amount on 20th day after panicle emergence. Although Lalat had detectable amount of ferritin in the leaf sheaths after 10 days of heading, the level attained highest value on 20th day. Unlike in Sharbati, ferritin protein could not be detected in the basal spikelets of Lalat on 20th day of heading. Plant parts of Sharbati possessed higher concentration of ferritin protein (except the leaf sheath on 10th day after panicle emergence) than Lalat (Figure 7).
5. Discussion
In this study, effect of Fe concentration in the growing medium was tested on Fe accumulation, aconitase enzyme activity and ferritin level in two tropical indica rice cultivars having contrasting grain Fe concentration.
In the hydroponics culture, both the cultivars accumulated Fe from the growing medium and increased its concentration in different plant parts (Figure 1(a) and Figure 1(b)). This observation was further supported by results from the field experiment (Figure 1(c)). In all cases, Sharbati accumulated higher amounts of Fe than Lalat. Varietal differences may be responsible for the differential Fe accumulation by the two cultivars reflecting relative inefficiency of the low Fe containing cultivar, Lalat to absorb Fe from soil and translocate it to different plant parts. Sudden rise in Fe concentration with 250 ppm Fe supplementation might have resulted from ion leakage due to disruption in membrane organization or selectivity by reactive oxygen species [5] [30] . It is well known that free Fe participates in Fenton reaction leading to generation of hydroxyl radical and other toxic oxygen species which in turn affect membrane integrity by lipid peroxidation.
The level of Fe in the growing medium that may give rise toxicity symptoms in rice plants vary widely. While in Asian rice, Oryza sativa, growth was reduced and bronzing appeared at external concentrations as low as 10 ppm Fe2+ in culture medium [31] , whereas some cultivars of African rice (Oryza glaberrima) subjected to 500 ppm Fe2+ for 3 days showed no obvious symptom of bronzing and the plant growth (measured on dry weight ba-
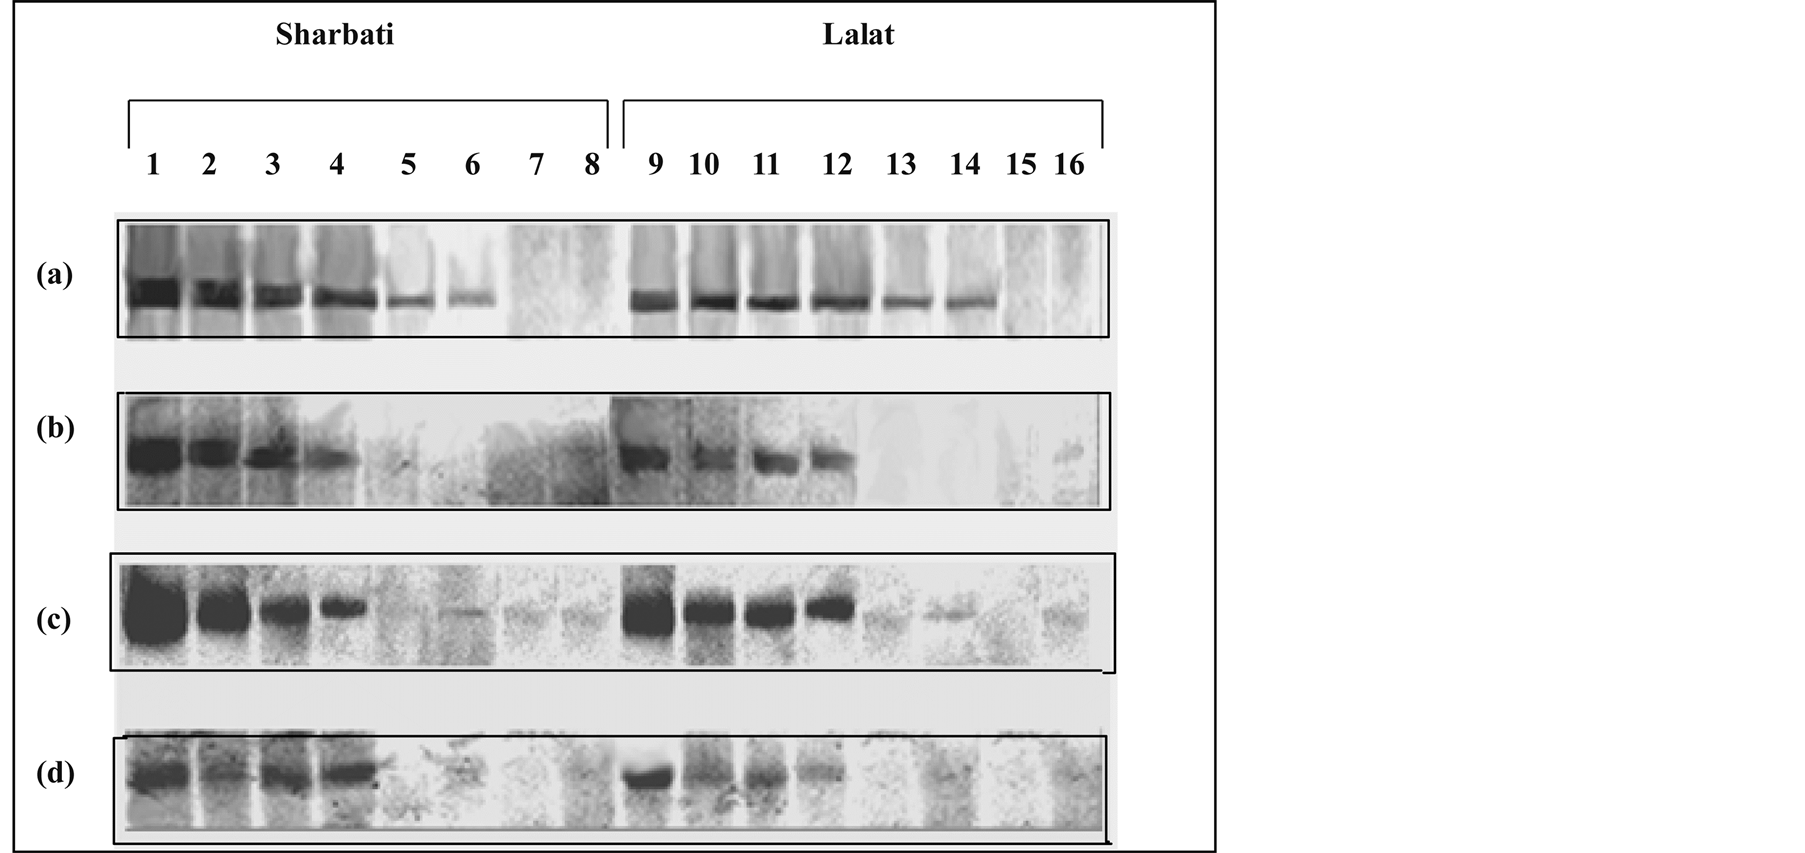
Figure 6. Native-PAGE showing aconitase activity in different leaves of field grown plants at different stages of growth. Extracts were made from different leaves of the two rice cultivars (Sharbati and Lalat) at different growth stages [panicle emergence (heading), 10, 20 and 30 days after panicle emergence [(a), (b), (c) and (d) respectively)]. Lanes 1, 2, 3, 4, 5, 6, 7, 8 and 9, 10, 11, 12, 13, 14, 15, 16 denote flag leaf, 2nd leaf, 3rd leaf, leaf sheath, apical spikelet, basal spikelet, stem and root, respectively. Leaf extract containing 100 μg of soluble proteins was run in each lane of a native polyacrylamide gel (7.5%) and stained with specific stain for aconitase activity.
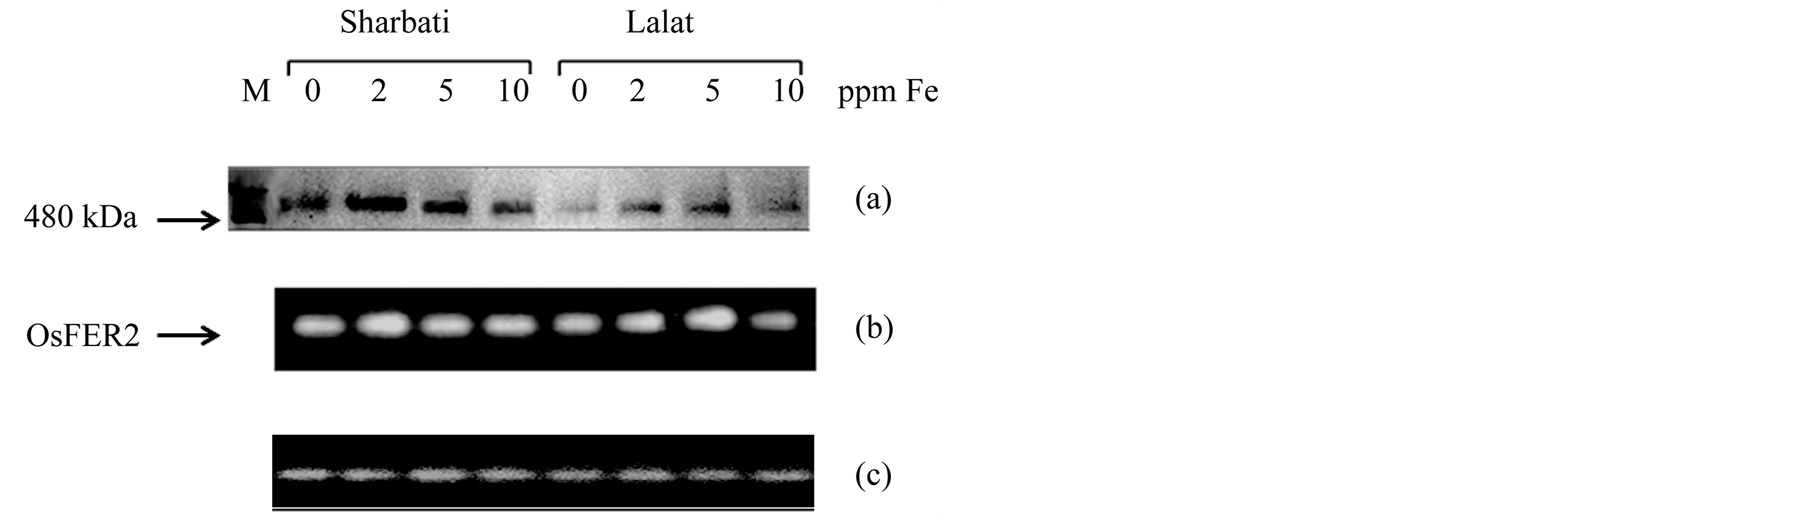
Figure 7. Effect of Fe level on ferritin accumulation (a) and ferritin gene expression (b) in the leaves of 14 days old rice seedlings of two indica rice cultivars (Sharbati and Lalat) grown in hydroponics. β-tubulin (c) was used as loading control in RT-PCR. Seedlings were raised without Fe for 7 days and then grown with four levels of Fe (0, 2, 5, 10 ppm) for another 7 days. Protein extracts were made from 1.0 g of fully opened fresh rice leaves as per the second procedure of Laulhere et al. (1988). Extract containing 100 μg of soluble proteins was loaded in each well of a 6% native polyacrylamide gel. Horse spleen ferritin (MW 480 kDa) was loaded as marker (M). Ferritin protein was detected with Feren S stain. RT-PCR products were resolved on a 1.5% agarose gel.
sis) was not affected. On the other hand, symptoms of bronzing were reported in rice plants (Oryza sativa) after a few days of exposure to Fe2+ concentration even less than ppm [31] [32] . In our work, when plants were grown in the presence of 10 ppm Fe, there were no obvious symptoms of toxicity. In fact, in another experiment with the same cultivars, optimum plant growth was observed with 15 ppm Fe and adverse effects of Fe excess was observed at 50 ppm Fe level only (data not shown). However, in our experiment, except with 250 ppm Fe after 72 h, Fe concentration in plant parts was found to be in the range of 123 to 1000 ppm with plants showing no apparent signs of toxicity (Figure 2(a) and Figure 2(b)). Similar results were reported earlier in African rice where intact plants exposed for 72 h to Fe stress (500 ppm) were found to accumulate more than 2200 ppm of Fe in the shoots without exhibiting any toxicity symptoms [33] . Even though a level of 300 ppm endogenous Fe concentration was earlier reported to becritical for developing metabolic disorders in Oryza sativa [34] the apparent absence of any toxicity symptoms in our experiment might be explained by the fact that when plants were exposed to very high level of external Fe concentration for a short period (72 h as in this case) to allow massive translocation of Fe to the leaves, the stress induced ethylene production, which is responsible for several deleterious symptoms, already culminated after 24 h of stress exposure [32] .
Increased accumulation of Fe with increasing Fe level in the growing medium was also positively reflected on chlorophyll concentration. However, the low Fe containing Lalat was found to be more responsive than the high Fe containing Sharbati, though the difference might be purely varietal. The reason for positive relationship between Fe accumulation and chlorophyll level might be due to the fact that Fe is essential for chlorophyll biosynthesis (transformation of coproporphyrin(ogen) into protoporphyrin(ogen)) even though it is not part of the molecule [35] .
In the hydroponically raised plants, increase in Fe supplementation in the growing medium increased Fe accumulation. This, in turn, increased aconitase activity and ferritin accumulation in the seedling (Figure 2(a), Figure 2(b), Figure 4(a), Figure 4(b), and Figure 7(a)). In the field experiment, varietal difference between the two cultivars with respect to Fe concentration was also reflected on aconitase activity and ferritin accumulation (Figure 2(c) and Figure 8). Aconitase enzyme is an Fe-S cluster containing protein and several authors reported a positive correlation between aconitase activity and Fe concentration in plants [23] [36] [37] . In the case of hydroponically grown plants, Fe concentration increased with increase in Fe level in the growing medium (Figure 2(a) and Figure 2(b)) and hence the observed increase in aconitase activity (Figures 4(a)-(c)). In the field grown plants, Fe level in various plant parts also increased with passage of time (Figure 2(c)) and so did aconitase activity (Figure 5). Aconitase gene has been reported to be constitutively expressed al low level during most developmental stages of plants, but increased dramatically during germination and seed and pollen maturation [38] . This was found to be true in the present study too with aconitase activity being low until heading and then gradually increasing and reaching highest level after 20 days of heading. After 30 days of heading when plants were almost dry and ready to be harvested, aconitase activity declined even though Fe levels in the tissues were still very high. Thus, there is a positive and significant correlation between internal Fe status and aconitase enzyme activity in rice plant (Table 2).
Rice roots have always been reported to accumulate more Fe than the shoots [17] [33] . However, higher Fe accumulation in the root did not lead to ferritin accumulation (Figure 8). This might be due to the fact that most of the Fe remained in a transitory non-ferritin Fe pool in the root parenchyma before it was released into xylem [39] . Moreover, in plants, ferritin is mainly located in the stroma of chloroplasts and this specific localization may explain the apparent absence of ferritin in the roots and stems.
In the field grown plants Fe accumulation increased in different plant parts following heading (Figure 1(c)) and it was reflected in the level of ferritin protein (Figure 8). The observed difference in ferritin accumulation between the two cultivars (Figure 7) might be due to difference in their internal Fe status (Figure 2(b)). At similar Fe level in the growing medium, the internal Fe built up in Sharbati was larger than that in Lalat (Figure 2(b))
Table 2. Correlations between Fe levels (0, 2, 5 and 10 ppm) in the nutrient solution, Fe concentration in leaves (ppm, on dry weight basis), Fe concentration in roots (ppm, on dry weight basis), leaf chlorophyll concentration (mg∙g−1 fresh weight) and aconitase activity (units∙mg−1 protein) in parts of 14 days old rice seedlings. Seedlings were raised without Fe for the first 7 days in nutrient solution and then grown with four levels of Fe (0, 2, 5, 10 ppm) for another 7 days.
*, **, ***Significant at 0.05, 0.01 and 0.001 levels of probability, respectively and NS = is not significant at 0.05 level of probability.
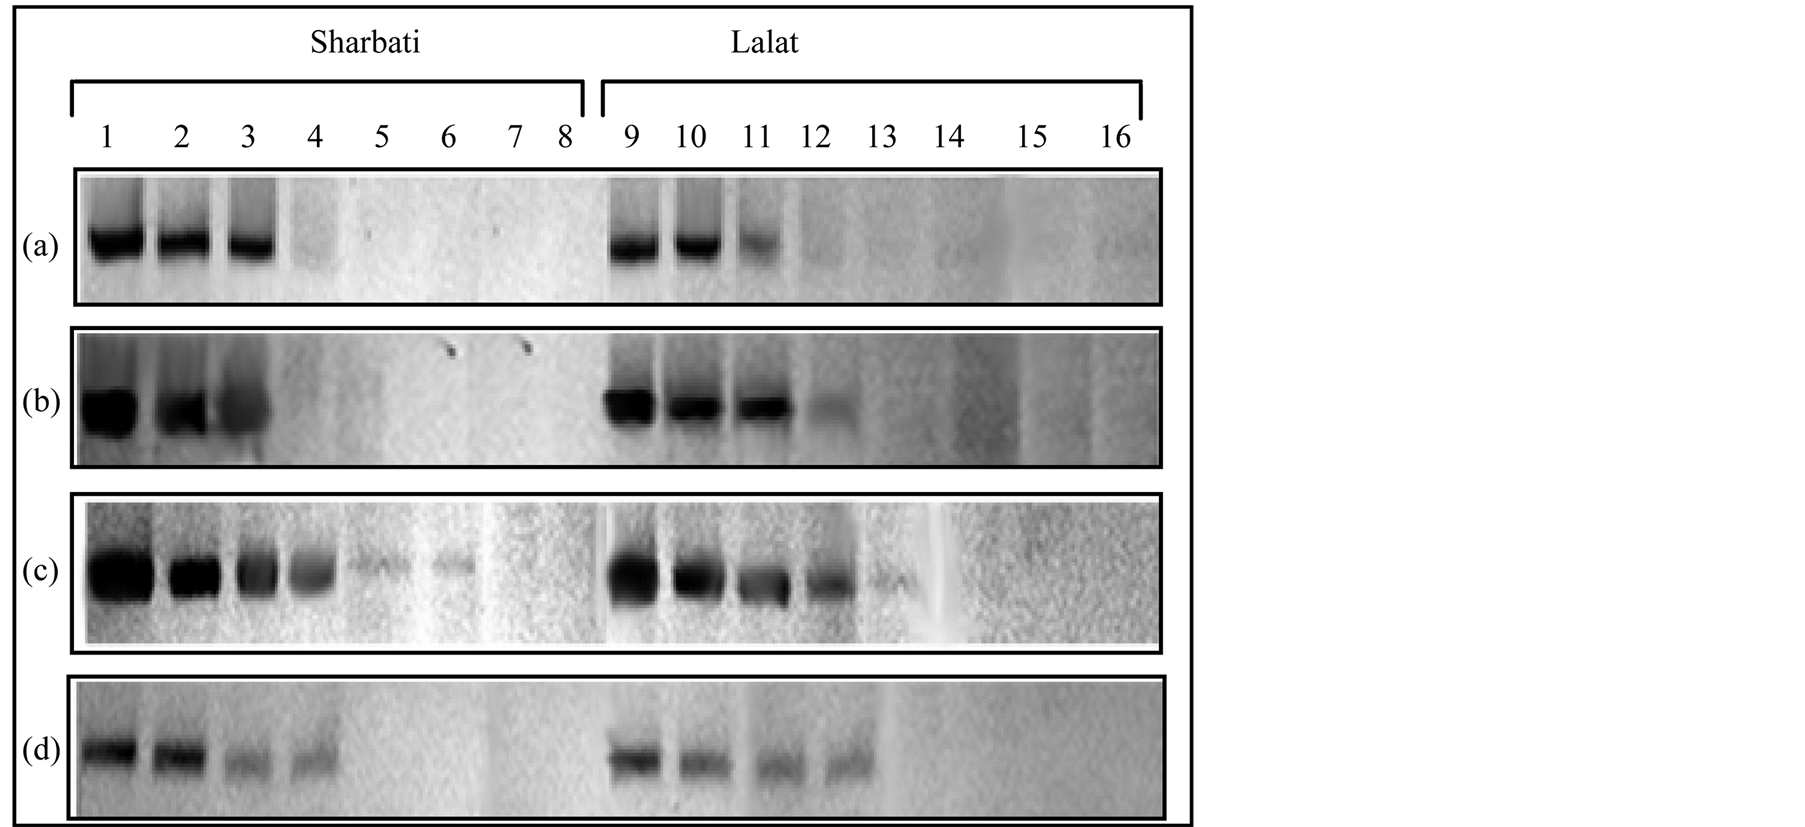
Figure 8. Native-PAGE showing ferritin accumulation in different parts of field grown plants of the two indica rice cultivars (Sharbati and Lalat) at different stages of growth viz. panicle emergence (heading), 10, 20 and 30 days after heading (denoted by a, b, c and d, respectively). Lanes 1, 2, 3, 4, 5, 6, 7, 8 and 9, 10, 11, 12, 13, 14, 15, 16 denote flag leaf, 2nd leaf, 3rd leaf, leaf sheath, apical spikelet, basal spikelet, stem and root. Leaf extract containing 100 μg of soluble proteins was loaded in each well of a 6% native polyacrylamide gel. Ferritin protein was detected with Feren S stain.
as a result beyond 2 ppm Fe level, physiological Fe concentration in Sharbati was inhibitory to ferritin synhthesis, while with similar Fe supplementation internal Fe concentration was lower in Lalat and ferritin synthesis continued. Inhibition of ferritin synthesis in Lalat occurred beyond 5 ppm only (Figure 7(a) and Figure 7(b)). This means that ferritin synthesis might be negatively affected by higher level of Fe and this regulation was imposed at the transcriptional level (Figure 7(b)). Increased ferritin protein abundance was reported in Arabidopsis and maize plants supplied with excess Fe or under increased Fe availability during leaf senescence [40] [41] .
Two ferritin genes, OsFER1 and OsFER2 were reported in the rice genome. These genes are expressed in organ specific and developmental specific manner [29] . Increased transcription of ferritin genes in response to increased Fe availability was reported by a number of workers [17] [33] . Stein et al. [29] found that treatment of rice seedlings (cv. Nipponbare) with an equivalent of 280 ppm (5 mM) of Fe resulted in higher expression of OsFER2 only. We found a similar pattern in the present study too, with one isoform, i.e. OsFER2 being preferentially expressed in the seedlings and responded to varying Fe levels of the growing medium (Figure 7(b)).
Thus, cultivars which had low grain Fe concentration also had lower Fe concentration in different plant parts and this was reflected in the level of aconitase enzyme activity and ferritin protein. Besides, low grain Fe concentration of the low Fe containing cultivar, Lalat, might have resulted from inefficient absorption and accumulation of the element from growing medium (Figure 2(b)). At similar Fe level, internal Fe pool in Lalat was smaller than that in Sharbati and this was reflected in lower accumulation of the Fe in the grain.
Acknowledgments
Dr. Binay Bhusan Panda and Avijit Das thank Department of Science and Technology (DST), Government of India for providing financial support for the experiments. Dr. Binay Bhusan Panda is currently working as a DST Young Scientist Institute of Life Sciences, Bhubaneswar, India. Prof. Pravat Kumar Mohapatra acknowledges support given by Council of Scientific and Industrial Research, India in the form of an Emeritus Fellowship.
References
- Santos, L.S.D. and Oliveira, A.C.D. (2007) Rice Fe metabolism: From Source to Solution. Journal of Crop Science and Biotechnology, 10, 64-72.
- Mengel, K. and Kirkby, E.A. (1982) Principles of Plant Nutrition. International Potash Institute, Bern.
- Bienfait, H.F., Van Den Briel, M.L. and Mesland-Mul, N.T. (1985) Free Space Fe Pools in Roots. Generation and Mobilization. Plant Physiology, 78, 596-600. http://dx.doi.org/10.1104/pp.78.3.596
- Vahl, L.C. (1991) Fe Toxicity in Rice Genotypes Irrigated by Flooding, Ph.D. Thesis, Federal University of Rio Grande do Sul, Porto Alegre.
- Schmidt, W. (1999) Review Mechanisms and Regulation of Reduction-Based Fe Uptake in Plants. New Phytology, 141, 1-26. http://dx.doi.org/10.1046/j.1469-8137.1999.00331.x
- Genon, J.G., Hepcee, N., Duffy, J.E., et al. (1994) Iron and Other Chemical Soil Constraints to Rice in Highland Swamps of Burundi. Plant and Soil, 166, 109-115. http://dx.doi.org/10.1007/BF02185487
- CRRI Annual Report (2007) Problem Soils: Management of Iron Toxicity in Rice. India, 53.
- Theil, E.C. (1987) Ferritin: Structure, Gene Regulation, and Cellular Function in Animals, Plants and Microorganisms. Annual Review of Biochemistry, 56, 289-315. http://dx.doi.org/10.1146/annurev.bi.56.070187.001445
- Curie, C.G., Cassin, G., Couch, D., et al. (2009) Metal Movement within the Plant: Contribution of Nicotianamine and Yellow Stripe 1-Like Transporters. Annals of Botany, 103, 1-11. http://dx.doi.org/10.1093/aob/mcn207
- Beinert, H. (2000) Fe-Sulfur Proteins: Ancient Structures, Still Full of Suppression. Biological Inorganic Chemistry, 5, 2-15. http://dx.doi.org/10.1007/s007750050002
- Arnaud, N., Ravet, K., Borlotti, A., Touraine, B., Boucherez, J., Fizames, C., Briat, J.F., Cellier, F.F. and Gaymard, F. (2007) The Iron-Responsive Element (IRE)/Iron-Regulatory Protein 1 (IRP1)-Cytosolic Aconitase Iron-Regulatory Switch Does Not Operate in Plants. Biochemical Journal, 405, 523-531. http://dx.doi.org/10.1042/BJ20061874
- Hentze, M.W. and Kuhn, L.C. (1996) Molecular Control of Vertebrate Iron Metabolism: mRNA-Based Regulatory Circuits Operated by Iron, Nitric Oxide, and Oxidative Stress. Proceedings of the National Academy of Sciences of the United States of America, 93, 8175-8182. http://dx.doi.org/10.1073/pnas.93.16.8175
- Klausnern, R.D., Rouault, T.A. and Harford, J.B. (1993) Regulating the Fate of mRNA: The Control of Cellular Iron Metabolism. Cell, 72, 19-28. http://dx.doi.org/10.1016/0092-8674(93)90046-S
- Lescure, A.M., Proudhon, D., Pesey, H., Ragland, M., Theil, E.C. and Briat, J.F. (1991) Ferritin Gene Transcription Is Regulated by Iron in Soybean Cell Cultures. Proceedings of the National Academy of Sciences of the United States of America, 88, 8222-8226. http://dx.doi.org/10.1073/pnas.88.18.8222
- Jiang, T.B. (2005) Isolation and Expression Pattern Analysis of Two Ferritin Genes in Tobacco. Journal of Integrative Plant Biology, 47, 477-486. http://dx.doi.org/10.1111/j.1744-7909.2005.00044.x
- Petit, J.M., van Wuytswinkel, O., Briat, J.F. and Lobréaux, S. (2001) Characterization of an Iron-Dependent Regulatory Sequence Involved in the Transcriptional Control of AtFer1 and ZmFer1 Plant Ferritin Genes by Iron. Journal of Biological Chemistry, 276, 5584-5590. http://dx.doi.org/10.1074/jbc.M005903200
- da Silveira, V.C., Fadanelli, C., Sperotto, R.A., Stein, R.J., Basso, L.A., Santos, D.S., et al. (2009) Role of Ferritin in the Rice Tolerance to Iron Overload. Scientia Agricola, 66, 549-555. http://dx.doi.org/10.1590/S0103-90162009000400019
- Palmer, M.J. (1964) The Relationship between Iron and the Activity of Aconitase Purified from the Leaves of Mustard (Sinapis alba). Biochemical Journal, 92, 404-410.
- Panda, B.B. (2010) Biochemical Studies on Iron Metabolism in Rice Plant (Oryza sativa L.). Ph.D. Thesis, Sambalpur University, Sambalpur.
- Alberts, B., John, A., Lewis, J., Raff, M., Roberst, K. and Walter, P. (2002) Molecular Biology of the Cell. 4th Edition, Garlands Science, New York.
- Yoshida, S., Forno, D.A., Cock, J.H. and Gomez, K.A. (1976) Laboratory Manual for Physiological Studies of Rice. 3rd Edition, The International Rice Research Institute, Manila.
- Arnon, D.I. (1949) Copper Enzymes in Isolated Chloroplasts. Polyphenol Oxidase in Beta Vulgaris. Plant Physiology, 24, 1-15. http://dx.doi.org/10.1104/pp.24.1.1
- Bacon, J.S.D., Palmer, M.J. and De Kock, P.C. (1961) The Measurement of Aconitase Activity in the Leaves of Various Normal and Variegated Plants. Biochemical Journal, 78, 198-204.
- Racker, E. (1950) Spectrophotometric Measurement of the Enzymatic Formation of Fumaric and Cis-Aconitic Acids. Biochimica et Biophysica Acta, 55, 270-272.
- Harris, H. and Hopkinson, D.A. (1976) Handbook of Enzyme Electrophoresis in Human Genetics. North-Holland Publishing Company, Amsterdam.
- Laulhere, J.P., Lescure, A.M. and Briat, J.F. (1988) Purification and Characterization of Ferritins from Maize, Pea and Soya bean Seeds. Distribution in Various Pea Organs. Journal of Biological Chemistry, 263, 10289-10294.
- Chung, M.C. (1985) A Specific Iron Stain for Iron-Binding Proteins in Polyacrylamide Gels: Application to Transferrin and Lactoferrin. Analytical Biochemistry, 148, 498-502. http://dx.doi.org/10.1016/0003-2697(85)90258-1
- Bradford, M.M. (1976) A Rapid and Sensitive Method for Quantitation of Microgram Quantities of Protein Utilizing the Principle of Protein-Dye-Binding. Analytical Biochemistry, 72, 248-254. http://dx.doi.org/10.1016/0003-2697(76)90527-3
- Stein, R.J., Ricachenevsky, F.K. and Fett, J.P. (2009) Differential Regulation of Two Rice Ferritin Genes (OsFER1 and OsFER2). Plant Science, 177, 563-569.
- Becana, M., Moran, J.F. and Iturbe-Ormaetxe, I. (1988) Iron-Dependent Oxygen Free Radical Generation in Plants Subjected to Environmental Stress: Toxicity and Antioxidant Protection. Plant and Soil, 201, 137-147. http://dx.doi.org/10.1023/A:1004375732137
- Tadano, T. and Yoshida, S. (1978) Chemical Changes in Submerged Soils and Their Effect on Rice Growth. In: Soils and Rice, International Rice Research Institute, Los Baños, 399-421.
- Peng, X.X. and Yamauchi, M. (1993) Ethylene Production in Rice Bronzing Leaves Induced by Ferrous Iron. Plant and Soil, 149, 227-234. http://dx.doi.org/10.1007/BF00016613
- Majerus, V., Bertin, P., Swenden, A., Fortemps, A., Lobréaux, S. and Lutts, S. (2007) Organ-Dependent Responses of the African Rice to Short-Term Iron Toxicity: Ferritin Regulation and Antioxidative Responses. Biologia Plantarum, 51, 303-312. http://dx.doi.org/10.1007/s10535-007-0060-6
- Sahrawat, K.L., Mulbah, C.K., Diatta, S., et al. (1996) The Role of Tolerant Genotypes and Plant Nutrients in the Management of Iron Toxicity in Lowland Rice. Journal of Agricultural Science, 126, 143-149.
- Machold, O. and Stephan, U.W. (1969) The Function of Iron in Porphyrin and Chlorophyll Biosynthesis. Phytochemistry, 8, 2189-2192. http://dx.doi.org/10.1016/S0031-9422(00)88179-0
- Kennedy, M.C., Emptage, M.H., Dreyer, J.L. and Beinert, H. (1983) The Role of Iron in the Activation-Inactivation of Aconitase. Journal of Biological Chemistry, 258, 11098-11105.
- Kennedy, M.C., Mende-Muller, L., Blondin, G.A. and Beinert, H. (1992) Purification and Characterization of Cytosolic Aconitase from Beef Liver and Its Relationship to the Fe-Responsive Element Binding Protein. Proceedings of the National Academy of Sciences of the United States of America, 89, 11730-11734. http://dx.doi.org/10.1073/pnas.89.24.11730
- Peyret, P., Perez, P. and Alric, M. (1995) Structure, Genomic Organization, and Expression of the Arabidopsis Thaliana Aconitase Gene. Plant Aconitase Show Significant Homology with Mammalian Iron-Responsive Element-Binding Protein. Journal of Biological Chemistry, 270, 8131-8137. http://dx.doi.org/10.1074/jbc.270.14.8131
- Branton, D. and Jacobson, L. (1962) Iron Localization in Pea Plants. Plant Physiology, 37, 546-551. http://dx.doi.org/10.1104/pp.37.4.546
- Lobreaux, S., Massenet, O. and Briat, J.F. (1992) Iron Induces Ferritin Synthesis in Maize Plantlets. Plant Molecular Biology, 19, 563-575. http://dx.doi.org/10.1007/BF00026783
- Murgia, I., Vazzola, V., Tarantino, D., Cellier, F., Ravet, K., Briat, J.F. and Soave, C. (2007) Knock-Out of Ferritin AtFer1 Causes Earlier Onset of Age-Dependent Leaf Senescence in Arabidopsis. Plant Physiology and Biochemistry, 45, 898-907. http://dx.doi.org/10.1016/j.plaphy.2007.09.007
NOTES

*Corresponding author.