Paper Menu >>
Journal Menu >>
 American Journal of Analyt ical Chemistry, 2010, 2, 83-90 doi:10.4236/ajac.2010.12011 Published Online August 2010 (http://www.SciRP.org/journal/ajac) Copyright © 2010 SciRes. AJAC Degradation Pathway for Pitavastatin Calcium by Validated Stability Indicating UPLC Method Antony Raj Gomas1,2, Pannala Raghu Ram1,2, Nimmakayala Srinivas1, Jadi Sriramulu2 1Shasun Pharmaceuticals Limited, Chennai, India 2Department of Chemistry, Sri Krishna Devaraya University, Anan tapur, India E-mail: ramp.raghu@gmail.com Received July 7, 2010; revised July 30, 2010; accepted August 3, 2010 Abstract Degradation pathway for pitavastatin calcium is established as per ICH recommendations by validated and stability indicating reverse phase liquid chromatographic method. Pitavastatin is subjected to stress condi- tions of acid, base, oxidation, thermal and photolysis. Significant degradation is observed in acid and base stress conditions. Four impurities are studied among which impurity-4 is found prominent degradant. The stress samples are assayed against a qualified reference standard and the mass balance is found close to 99.5%. Efficient chromatographic separation is achieved on a BEH C18 stationary phase with simple mobile phase combination delivered in gradient mode and quantification is carried at 245 nm at a flow rate of 0.3 mL min-1. In the developed UPLC method the resolution between pitavastatin calcium and four potential impurities is found to be greater than 4.0. Regression analysis shows an r value (correlation coefficient) of greater than 0.998 for pitavastatin calcium and four potential impurities. This method is capable to detect the impurities of pitavastatin calcium at a level of 0.006% with respect to test concentration of 0.10 mg/mL for a 2-µL injection volume. The developed UPLC method is validated with respect to specificity, linearity & range, accuracy, precision and robustness for impurities determination and assay determination. Keywords: Column Liquid Chromatography; Pitavastatin Calcium; Forced Degradation; Validation; Stability Indicating. 1. Introduction Pitavastatin: (E)-7-[2-cyclopropyl-4-(4-fluorophenyl)qui- nolin-3-yl]-3,5-dihydroxy-hept-6-enoic acid. Pitavastatin (usually as a calcium salt) is a novel member of the medication class of statins. Like the other statins, it is an inhibitor of HMG-CoA reductase, the enzyme that ca- talyses the first step of cholesterol synthesis. It has been available in Japan since 2003, and is being marketed under license in South Korea and in India. It is likely that pitavastatin will be approved for use in hypercholester- olaemia [1-2]. There are some mass detection methods reported for determination of pitavastatin in plasma and biological fluids and two methods for pitavastatin quan- tification in tablets by HPLTC were reported [3-6]. As far as we are aware there is no stability-indicating LC method for determination of related substances and assay determination of pitavastatin calcium. In this paper we describe validation of related substances and assay meth- ods for accurate quantification of four potential process impurities in pitavastatin calcium samples as per ICH recommendations. Intensive stress studies are carried out on pitavastatin calcium; accordingly a stability-indicating method is developed, which could separate various deg- radation produ c t s. The present active pharmaceutical Ingredient (API) stability test guideline Q1A (R2) issued by international conference on harmonization (ICH) [7] suggests that stress studies should be carried out on active pharmaceu- tical ingredient (API) to establish its inherent stability characteristics, leading to separation of degradation prod- ucts and hence supporting the suitability of the proposed analytical procedures. It also requires that analytical test procedures for stability samples should be stability indi- cating and they should be fully validated. Accordingly, the aim of present study is to establish degradation pathway of pitavastatin calcium through stress studies under a variety of ICH recommended test conditions [7-9].  A. R. GOMAS ET AL. Copyright © 2010 SciRes. AJAC 84 2. Experimental Design 2.1. Chemicals Samples of pitavastatin calcium with purity more than 99.8% and its related impurities having purity more than 99.0% are received from Shasun research centre, Chennai, India (Figure 1). HPLC grade acetonitrile is purchased from Merck, Darmstadt, Germany. Analytical reagent grade orthophosphoric acid and is purchased from Merck, Darmstadt, Germany. High purity water is prepared by using Millipore Milli-Q plus water purification system. 2.2. Procedure 2.2.1. Equipments The LC system, used for method development and method validation is Waters-Acquity UPLC. The output signal is monitored and processed using Empower 2 software on Pentium computer (Digital equipment Co). UPLC is equipped with Binary gradient pump, Auto Sampler, thermostatted column compartmen t, Tunable U V D etec to r, Auto sampler thermostatted, Computer with windows based Empower 2 Metho d vali dat i on manager software. 2.2.2. Chromatogr aphic Con ditions The chromatographic column used is Waters BEH C18 (100 × 2.1 mm) with 1.7µm particles. The mobile phase- A contains a 0.03% of orthophosphoric acid buffer (0.3mL/L ). Acetonitrile is used as mobile phase-B. The flow rate of the mobile phase is 0.3 mL/min with a gradient program of 0/45, 2/45, 2.5/100, 4/100, 4.5/45 and 5/45 (time (min)/%B). The column temperature is maintained at 40°C and the detection is monitored at wavelength of 245 nm. The injection volume is 2 µL. Diluent consists water and acetonitrile in the ratio 90:10. 2.2.3. Preparation of Solu tio ns All the impurities are dissolved initially by adding 5 mL of acetonitrile then make up to the volume with diluent. A Stock solution of pitavastatin calcium (0.10 mg/mL) is prepared by dissolving appropriate amount in the diluent. Working so lution 10 µg/mL is prepared from above stock solution for assay determination. 2.3. Method development and optimization Impurities and pitavastatin calcium solutions are prepared in diluent at a concentration of 100 ppm and scanned in UV-visible spectrometer; all the 4 impurities and pitavas- tatin calcium are having UV maxima at around 245 nm which is selected for method development purpose. Mo- bile phase of ammonium acetate (0.05 M) and acetonitrile (60:40, v/v) is selected for initial tria l on a C18 stationary phase column [150 × 4.6 mm, 5 µm] and flow rate at O HO OHOH N F (a) N O O F (b) N F HO (c) N F Br (d) OO OH N F (e) Figure 1. Chemical Structures and labels of pitavastatin calcium and its impurities. Pitavastatin calcium: (E)-7-[2- cyclopropyl-4-(4-fluorophenyl)quinolin-3-yl]-3,5-dihydroxy- hept-6-enoic acid; Impurity-1: Methyl 4-(4’ -fluorophenyl)- 2-cyclopropyl-quinolin-3-yl-carboxylate; Impurity-2: 3- hydroxymethyl-2-cycloprop yl-4-(4-fluoroph enyl)-quinoline; Impurity-3: 3-Bromomethyl-2-cyclopropyl-4-(4-fluoroph- enyl)quinoline; Impurity-4: (4R,6S)-6-{(E)-2-[2-cyclopropyl- 4-(4-fluorophenyl)-3-quinolyl]etheynyl}-4-hydroxy-3,4,5,6- tetrahydro-2H-pyran-2-one. 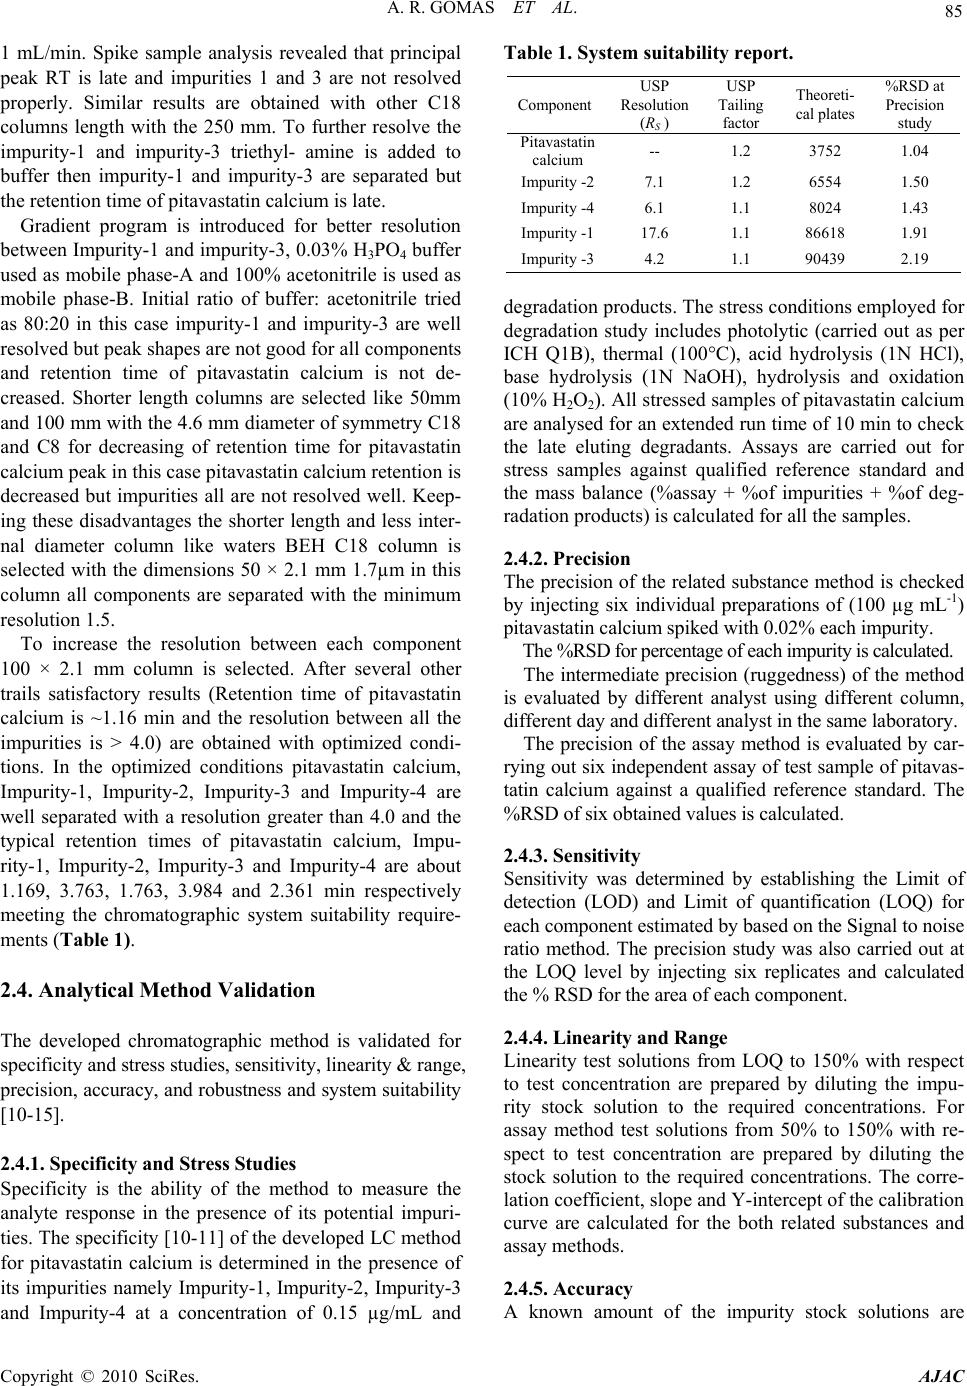 A. R. GOMAS ET AL. Copyright © 2010 SciRes. AJAC 85 1 mL/min. Spike sample analysis revealed that principal peak RT is late and impurities 1 and 3 are not resolved properly. Similar results are obtained with other C18 columns length with the 250 mm. To further resolve the impurity-1 and impurity-3 triethyl- amine is added to buffer then impurity-1 and impurity-3 are separated but the retention time of pitavastatin calcium is late. Gradient program is introduced for better resolution between Impurity-1 and impurity-3, 0.03% H3PO4 buffer used as mobile phase-A and 100% acetonitrile is used as mobile phase-B. Initial ratio of buffer: acetonitrile tried as 80:20 in this case impurity-1 and impurity-3 are well resolved but peak shapes are not good for all components and retention time of pitavastatin calcium is not de- creased. Shorter length columns are selected like 50mm and 100 mm with the 4.6 mm diameter of symmetry C18 and C8 for decreasing of retention time for pitavastatin calcium peak in this case pitavastatin calcium retention is decreased but impurities all are not resolved well. Keep- ing these disadvantages the shorter length and less inter- nal diameter column like waters BEH C18 column is selected with the dimensions 50 × 2.1 mm 1.7µm in this column all components are separated with the minimum resolution 1.5. To increase the resolution between each component 100 × 2.1 mm column is selected. After several other trails satisfactory results (Retention time of pitavastatin calcium is ~1.16 min and the resolution between all the impurities is > 4.0) are obtained with optimized condi- tions. In the optimized conditions pitavastatin calcium, Impurity-1, Impurity-2, Impurity-3 and Impurity-4 are well separated with a resolution greater than 4.0 and the typical retention times of pitavastatin calcium, Impu- rity-1, Impurity-2, Impurity-3 and Impurity-4 are about 1.169, 3.763, 1.763, 3.984 and 2.361 min respectively meeting the chromatographic system suitability require- ments (Table 1). 2.4. Analytical Method Validation The developed chromatographic method is validated for specificity and stress studies, sensitiv ity, linearity & range, precision, accuracy, and robustness and system suitability [10-15]. 2.4.1. Specificity and Stress Studies Specificity is the ability of the method to measure the analyte response in the presence of its potential impuri- ties. The specificity [10-11] of the develop ed LC method for pitavastatin calcium is determined in the presence of its impurities namely Impurity-1, Impurity-2, Impurity-3 and Impurity-4 at a concentration of 0.15 µg/mL and Table 1. System suitability report. Component USP Resolution (RS ) USP Tailing factor Theoreti- cal plates %RSD at Precision study Pitavastatin calcium -- 1.2 3752 1.04 Impurity -27.1 1.2 6554 1.50 Impurity -46.1 1.1 8024 1.43 Impurity -117.6 1.1 86618 1.91 Impurity -34.2 1.1 90439 2.19 degradation products. The stress conditions employed for degradation study includes photolytic (carried out as per ICH Q1B), thermal (100°C), acid hydrolysis (1N HCl), base hydrolysis (1N NaOH), hydrolysis and oxidation (10% H2O2). All stressed samples of pitavastatin calcium are analysed for an extended run time of 10 min to check the late eluting degradants. Assays are carried out for stress samples against qualified reference standard and the mass balance (%assay + %of impurities + %of deg- radation products) is calculated for all the samples. 2.4.2. Precision The precision of the related substance method is checked by injecting six individual preparations of (100 µg mL-1) pitavastatin calcium spiked with 0.02% each impurity. The %RSD for percentage of each impurity is calculated. The intermediate precision (ruggedness) of the method is evaluated by different analyst using different column, different day and di fferent a n al y st i n t he sam e l a boratory . The precision of the assay method is evaluated by car- rying out six independent assay of test sample of pitavas- tatin calcium against a qualified reference standard. The %RSD of six obtained values is calculated. 2.4.3. Sensitivity Sensitivity was determined by establishing the Limit of detection (LOD) and Limit of quantification (LOQ) for each component estimated by based on the Signal to noise ratio method. The precision study was also carried out at the LOQ level by injecting six replicates and calculated the % RSD for the area of each component. 2.4.4. Linearity and Range Linearity test solutions from LOQ to 150% with respect to test concentration are prepared by diluting the impu- rity stock solution to the required concentrations. For assay method test solutions from 50% to 150% with re- spect to test concentration are prepared by diluting the stock solution to the required concentrations. The corre- lation coefficient, slope and Y-intercep t of the calibration curve are calculated for the both related substances and assay methods. 2.4.5. Accuracy A known amount of the impurity stock solutions are  A. R. GOMAS ET AL. Copyright © 2010 SciRes. AJAC 86 spiked to the previously analysed samples at LOQ, 100 and 150% of the analyte concentration (100 µg/mL). The percentage of recoveries for Impurity-1, Impurity-2, Im- purity-3 and Impurity-4 are calculated. A known amount of pitavastatin calcium stock solution spiked to the su- crose at 50%, 100% and 150% of the analyte concentra- tion (10 µg/mL). Each concentration level is prepared for three times. The percentage of recoveries is calculated. 2.4.6. Robustness To determine the robustness of the developed method, experimental conditions are deliberately changed and the resolution between each component is evaluated. The flow rate of the mobile phase is 0.3 mL/min. To study the effect of flow rate on the resolution, 0.03 units changed i.e. 0.27 and 3.3 mL/min. The effect of column tempera- ture on resolution is studied at 35°C and 45°C instead of 40°C. In the all above varied conditions, the components of the mobile phase are hel d constant. 2.4.7. Solution Stability and Mobile Phase Stability The solution stability of pitavastatin calcium and its re- lated impurities are carried out by leaving spiked sample solution in tightly capped volumetric flask at room tem- perature for 48 h. Impurity content is determined for every 6 h interval up to the study period. Mobile phase stability is also carried out for 48 h by injecting the freshly prepared sample solutions for every 6 h interval. Impurity content is checked in the test solutions. Mobile phase prepared is kept const an t duri n g t he stu dy peri od . 3. Results and Discussion 3.1. Specificity and Stress studies Stress studies on pitavastatin calcium under different stress conditions suggested the following degradation behavior (Table 2). 3.1.1. Degradation i n Aci d St ress Condi ti on Pitavastatin calcium gradually undergone degradation with time in 1 N HCl upon heating for 2 h and prominent degradation is obser ved as i m puri t y -4. 3.1.2. Degradation i n B ase Stress Condi ti on Pitavastatin calcium is gradually undergone degradation with time in 1 N NaOH upon heating for 2 h and promi- nent degradation is observed as impurity-2 and impu- rity-4. 3.1.3. Degradation in Peroxide Stress Condition Pitavastatin calcium is gradually undergone degradation with time in 10% H2O2 upon heating for 2 h and mild degradation is obser ved as i m puri t y -4. 3.1.4. Degradation in Neutral (Water) Stress Condition Pitavastatin calcium is exposed water heating for 2 h, no degradation is obser ved. 3.1.5. Photolyt i c Stress Condition Pitavastatin calcium is exposed to light for an overall il- lumination of 1.2 million Klux hours and an integrated near ultraviolet energy of 200-watt hours/square meter (w/mhr) (in photo stability chamber), mild degradation is observed. 3.1.6. Thermal Stress Condition Pitavastatin calcium exposed to dry heat at 100°C for 48 hours, no degradation is observed. The mass balance of stressed samples is close to 99.5%. The assay of pitavastatin calcium is unaffected in the presence of four impurities and its degradation products confirm the stability indicating power of the developed method. 3.2. Method Validation 3.2.1. Precision The %RSD of area of pitavastatin calcium, Impurity-1, Impurity-2, Impurity-3 and Impurity-4 and %RSD of area% of each impurity in precision study are within 5.0% confirming the good precision of the developed analytical method. The %RSD obtained in intermediate precision study for pitavastatin calcium, Impurity-1, Impurity-2, Impurity-3 and Impurity-4 are well within 5.0%, con- firming the intermediate precision of the method. The %RSD obtained in precision and intermediate precision studies for pitavastatin calcium are well within 1.0% of assay determination m et hod. 3.2.2. Sensitivity The limit of detection of pitavastatin calcium, impurity-1, impurity-2, impurity-3 and impurity-4 is 0.006% (of ana- lyte concentration, i.e. 100 µg/mL) for 2 L injection volume. The limit of quantification of pitavastatin cal- cium, Impurity-1, Impurity-2, Impurity-3 and Impurity-4 is 0.02% (of analyte concentration, i.e. 100 µg/mL) for 2 L injection volume. The % RSD for area of pitavastatin calcium, Impurity-1, Impurity-2, Impurity-3 and Impu- rity-4 are below 5 for precision at LOQ level. 3.2.3. Linearity and Range Calibration curve obtained by the least square regression analysis between average peak area and concentration showed linear relationship with a correlation coefficient of 0.998 over the calibration ranges tested. Linear calibra- tion plot for related substance method is obtained over the calibration ranges tested, i.e. LOQ to 0.225% for Impu- rity-1, Impurity-2, Impurity-3 and Impurity-4 and LOQ to 0.15% for pitavastatin calcium. The correlation coeffi- cient obtained is g reater than 0.998 for all fou r impurities and pitavastatin calcium. The result shows an excellent correlation existed between the peak area and concentra- tion of pitavastatin calcium and all impurities. Linear calibration plot for assay determination method is ob- 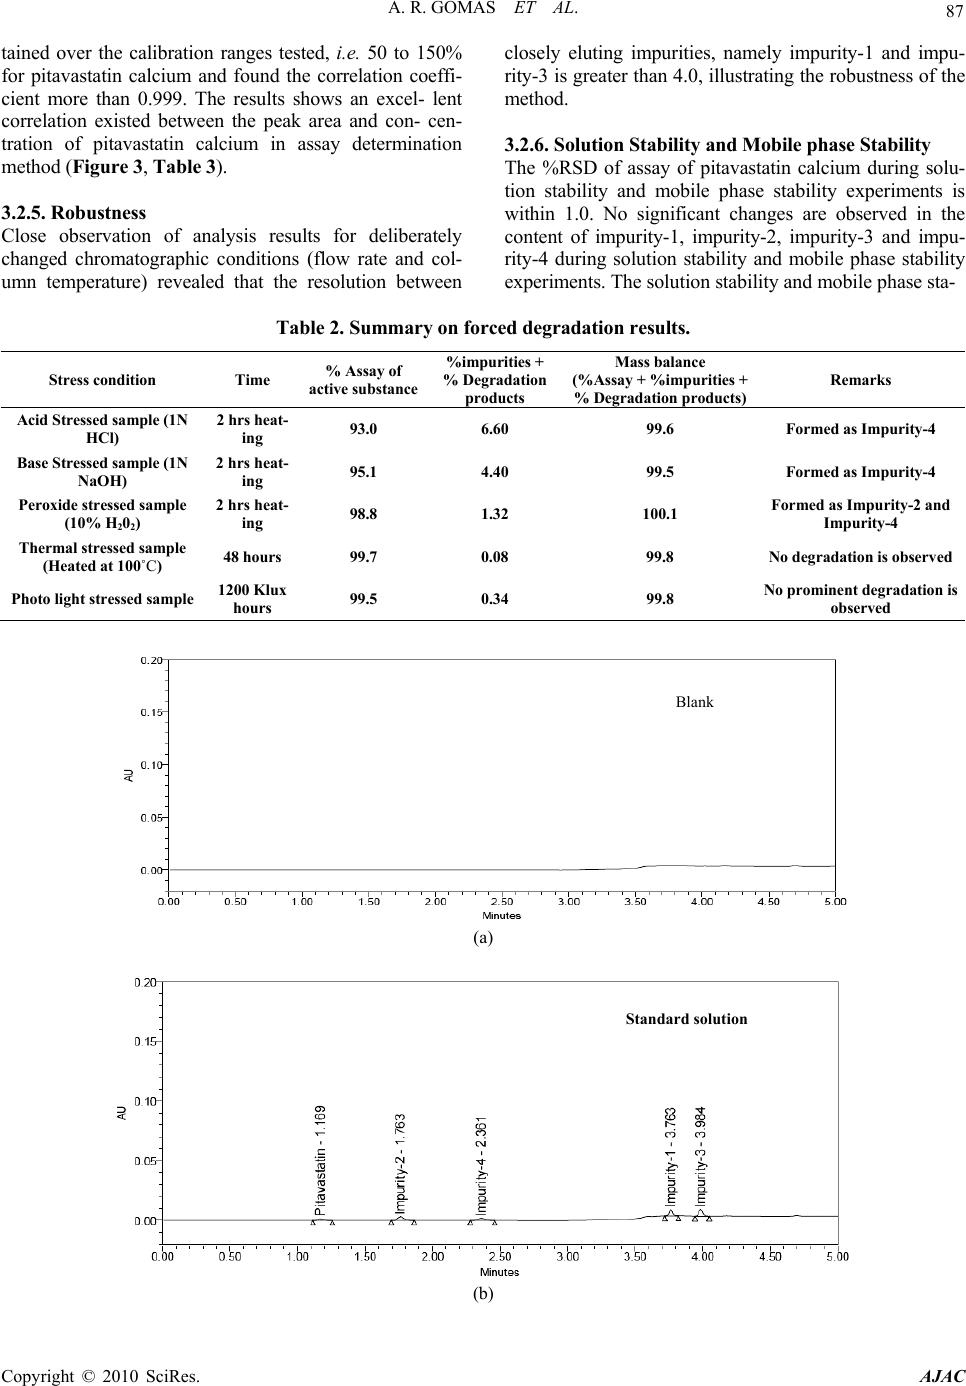 A. R. GOMAS ET AL. Copyright © 2010 SciRes. AJAC 87 tained over the calibration ranges tested, i.e. 50 to 150% for pitavastatin calcium and found the correlation coeffi- cient more than 0.999. The results shows an excel- lent correlation existed between the peak area and con- cen- tration of pitavastatin calcium in assay determination method (Figur e 3, Table 3). 3.2.5. Robustness Close observation of analysis results for deliberately changed chromatographic conditions (flow rate and col- umn temperature) revealed that the resolution between closely eluting impurities, namely impurity-1 and impu- rity-3 is greater than 4.0, illustratin g the robustness of the method. 3.2.6. Solution Stability and Mobile phase Stability The %RSD of assay of pitavastatin calcium during solu- tion stability and mobile phase stability experiments is within 1.0. No significant changes are observed in the content of impurity-1, impurity-2, impurity-3 and impu- rity-4 during solution stability and mobile phase stability experiments. The solution stability and mobile phase sta- Table 2. Summary on forced degradation results. Stress condition Time % Assay of active substance %impurities + % Degradation products Mass balance (%Assay + %impurities + % Degradation products) Remarks Acid St r es se d s amp le (1 N HCl) 2 hrs heat- ing 93.0 6.60 99.6 Formed as Impurity-4 Base St r es se d s amp le (1 N NaOH) 2 hrs heat- ing 95.1 4.40 99.5 Form ed as Impurit y- 4 Peroxide stressed sample (10% H202) 2 hrs heat- ing 98.8 1.32 100.1 Formed as Im p uri t y - 2 an d Impurity-4 Thermal stressed sample (Heated at 100˚C) 48 hours 99.7 0.08 99.8 No degradation is observed Photo light stressed sample 1200 Klux hours 99.5 0.34 99.8 No prominent degradation is observed (a) (b) Blank Standard solution 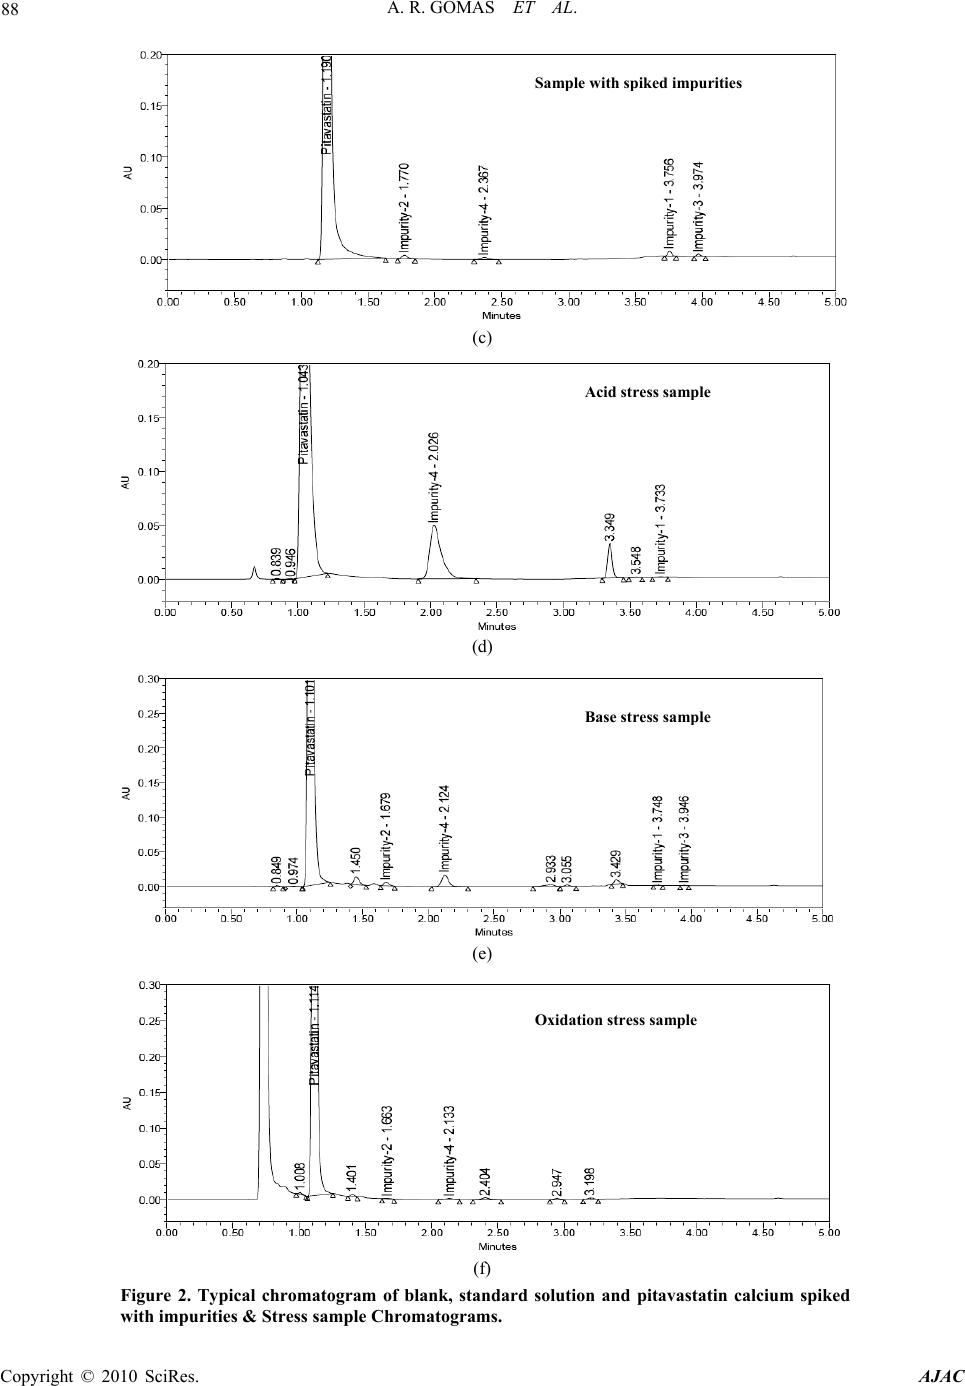 A. R. GOMAS ET AL. Copyright © 2010 SciRes. AJAC 88 (c) (d) (e) (f) Figure 2. Typical chromatogram of blank, standard solution and pitavastatin calcium spiked with impurities & Stress sample Chromatograms. Sam p le with s p iked im p urities Acid stress sam p le Base stress sam p le Oxidation stress sample  A. R. GOMAS ET AL. Copyright © 2010 SciRes. AJAC 89 Figure 3. Typical charts and for pitavastatin calcium and its impurities. bility experiments data confirms that sample solutions and mobile phase used related substance determination are stable up to the study period of 48 h. Analysis is performed for different samples of pita- vastatin calcium (n = 3). All the four impurities in these samples are less than 0.1% and Assay is more than 99.5%. Table 3. Linearity table. Component Trendline equation Range Correlation coeffi- cient % Intercept Residual sum of squares Impurity-1 69037X+239.39 0.02-0.225 0.99843 2.32 75426 Impurity-2 63379X+198.94 0.02-0.225 0.99899 2.12 68828 Impurity-3 77784X+61.46 0.02-0.225 0.99880 0.54 82815 Impurity-4 44536X+48.47 0.02-0.225 0.99910 0.74 47613 Related substances39934X+48.18 0.02-0.15 0.99910 1.22 43281 Pitavastatin calcium Assay determination 22727193X-1044 50%-150% 0.99998 –0.31 24868238 Table 4. Table for accuracy study. % of Recovery Assay determination Amount of impurity added (µg) to the 100% sample Imp-1 Imp-2 Imp-3 Imp-4 Amount of substance added %Recovery (Pitavastatin calcium) 0.02 98.2 101.1 96.5 99.0 50% 99.48 0.10 97.5 102.5 98.0 97.1 100% 100.00 0.15 96.4 98.5 93.6 101.8 150% 100.11 4. Conclusions The degradation pathway of pitavastatin calcium is es- tablished as per ICH recommendations. The gradient UPLC method developed and used for stress studies is also fit for quantitative, related substance and assay de- termination of pitavastatin calcium. The method is vali- dated as per ICH requirements. The developed method is stability indicating which can be used for the impurity testing and assay determination in routine analysis of production samples and also to analyze stability samples. 5. Acknowledgements The authors wish to thank the management of Shasun Chemicals & Drugs Limited for supporting this work. 6. References [1] K. Kajinami, N. Takekoshi and Y Saito, “Pitavastatin: Efficacy and Safety Profiles of a Novel Synthetic HMG- CoA Reductase Inhibitor,” Cardiovascular Drug Reviews, Vol. 21, 2003, pp. 199-215.  A. R. GOMAS ET AL. Copyright © 2010 SciRes. AJAC 90 [2] R. Y. Mukhtar, J. Reid and J. P. Reckless, “Pitavastatin,” International Journal of Clinical Practice, Vol. 59, 2005, pp. 239-252. [3] N. Satheesh Kumar and J. Baghyalakshmi, “Determina- tion and Quantification of Pitavastatin Calcium in Tablet Dosage Formulation by HPTLC Method,” Analytical Letters, Vol. 40, No. 14, 2007, pp. 2625-2632. [4] H. J. Panchal, B. N. Suhagia, N. J. Patel and B. H. Patel, “A Simple and Sensitive HPTLC Method for Quantitative Analysis of Pitavastatin Calcium in Tablets,” Journal of Planar Chromatography—Modern TLC, Vol. 21, No. 4, 2008, pp. 267-270. [5] R. Nirogi, K. Mudigonda and V. Kandikere, “Chroma- tography–Mass Spectrometry Methods for the Quantita- tion of Statins in Biological Samples,” Journal of Phar- maceutical and Biomedical Analysis, Vol. 44, No. 2, 2007, pp. 379-387. [6] J. Z. Shen-Tu, X. Xu, J. Liu, X. J. Hu, J. C. Chen, L. H. Wu, M. Z. Huang and H. L. Zhou, “Determination of Pi- tavastatin in Human Plasma by LC–MS–MS,” Chroma- tographia, Vol. 69, No. 9-10, 2009, pp. 1041-1047. [7] ICH, “Stability Testing of New Drug Substances and Products”, Q1A(R2), 2005. [8] ICH, “Photo stability Testing of New Drug Substances and Products,” Q1B, 2005. [9] S. W. Baertschi, K. Alsante and R. A. Reed, “Pharmaceu- tical Stress Testing: Predicting Drug Degradation,” In- forma Healthcare, 2005. [10] US FDA Guidance, “Analytical Procedures and Methods Validation,” 2000. [11] Validation of Compendial Methods <1225>, “The United States Pharmacopeia,” 2009. [12] M. E. Swartz and I. S. Krull, “Developing and Validating Stability-Indicating Methods,” Pharmaceutical Technol- ogy July 2006. [13] ICH, “Validation of Analytical Procedures: Text and Methodology”, Q2(R1), 2005. [14] J. Ermer and J. H. McB. Miller, “Method Validation in Pharmaceutical Analysis: A Guide to Best Practice,” Wiley, January 2005. [15] D. M. Bliesner, “Validating Chromatographic Methods: A Practical Guide,” Wiley, 2006. |