Paper Menu >>
Journal Menu >>
 American Journal of Analytical Chemistry, 2010, 2, 73-82 doi:10.4236/ajac.2010.12010 Published Online August 2010 (http://www.SciRP.org/journal/ajac) Copyright © 2010 SciRes. AJAC Application of H-Point Standard Addition Method and Multivariate Calibration Methods to the Simultaneous Kinetic-Potentiometric Determination of Cerium(IV) and Dichoromate Mohammad Ali Karimi1,2*, Mohammad Hossein Mashhadizadeh3, Mohammad Mazloum-Ardakani4, Fatemeh Rahavian2 1Department of Chemistry & Nanoscience and Nanotechnology Research Laboratory (NNRL), Faculty of Sciences, Payame Noor University (PNU), Sirjan, Iran 2Department of Chemistry, Faculty of Sciences, Payame Noor University (PNU), Ardakan, Iran 3Department of Chemistry, Tarbiat Moallem University of Tehran, Tehran, Iran 4Department of Chemistry, Faculty of Sciences, Yazd University, Yazd, Iran E-mail: ma_karimi43@yahoo.com & m_karimi@pnu.ac.ir Received June 27, 2010; revised July 20, 2010; accepted July 26, 2010 Abstract A kinetic-potentiometric method for simultaneous determination of Cerium(IV) and dichoromate (Cr2O72-) by H-point standard addition method (HPSAM), partial least squares (PLS) and principal component regres- sion (PCR) using fluoride ion-selective electrode (FISE) is described. In this work, the difference between the rate of the oxidation reaction of Fe(II) to Fe(III) in the presence of Ce4+ and Cr2O72- is based of the method. The rate of consume fluoride ion for making complex is detected with a FISE. The results show that simultaneous determination of Ce4+ and Cr2O72- can be done in their concentration ranges of 1.0-30.0 and 0.1-20.0 µg/mL, respectively. The total relative standard error for applying the PLS and PCR methods on 8 synthetic samples was 2.97 and 3.19, respectively in the concentration ranges of 1.0-30.0 µg/mL of Ce4+ and 0.1-20.0 µg/mL of Cr2O72-. In order for the selectivity of the method to be assessed, we evaluated the effects of certain foreign ions upon the reaction rate and assessed the selectivity of the method. The proposed meth- ods (HPSAM, PLS and PCR) were evaluated using a set of synthetic sample mixtures and then applied for simultaneous determination of Ce4+ and Cr2O72- in different water samples. Keywords: Multivariate Calibration, HPSAM, Simultaneous Kintic-Potentiometry, Dichromate, Cerium(IV) 1. Introduction Dichromate (Cr2O72-) and cerium(IV) are strong oxidants in chemistry that are used widely as oxidizing agent in diverse chemical reactions in the laboratory and industry for the synthesis of many different kinds of chemical compounds. Dichromate is used as a common inorganic chemical reagent, most commonly used as an oxidising agent in various laboratory and industrial applications [1,2]. It also used to oxidize alcohols, determination ethanol, cleaning laboratory glassware of organic con- taminants [3]. Cerium(IV) is also a common inorganic chemical reagent and industrially important and is used in nuclear reactors, alloys with nickel and chromium, microwave devices, lasers, agriculture and miscellaneous [4-6]. In analytical chemistry, standardized aqueous solutions of Cr2O72- and Ce4+ are sometimes used as oxidizing titrants for redox titrations. Therefore, deter- mination of these oxidants is very important. Several methods have been reported for the determination of them such as spectrophotometry [7,8], spectrofluorome- try [9] and electroanalytical techniques [10,11]. In rela- tion to the simultaneous analysis of Cr2O72- and Ce4+, Masin et al. have been reported a titrimetric method for the simultaneous determination of Ce4+, MnO4- and Cr2O72- using phosphate ion as precipitant of Ce4+ and Fe2+ as titrant [12]. To the best our knowledge, there is not any report for simultaneous determination of Cr2O72- and Ce4+ using HPSAM and chemometrics methods. 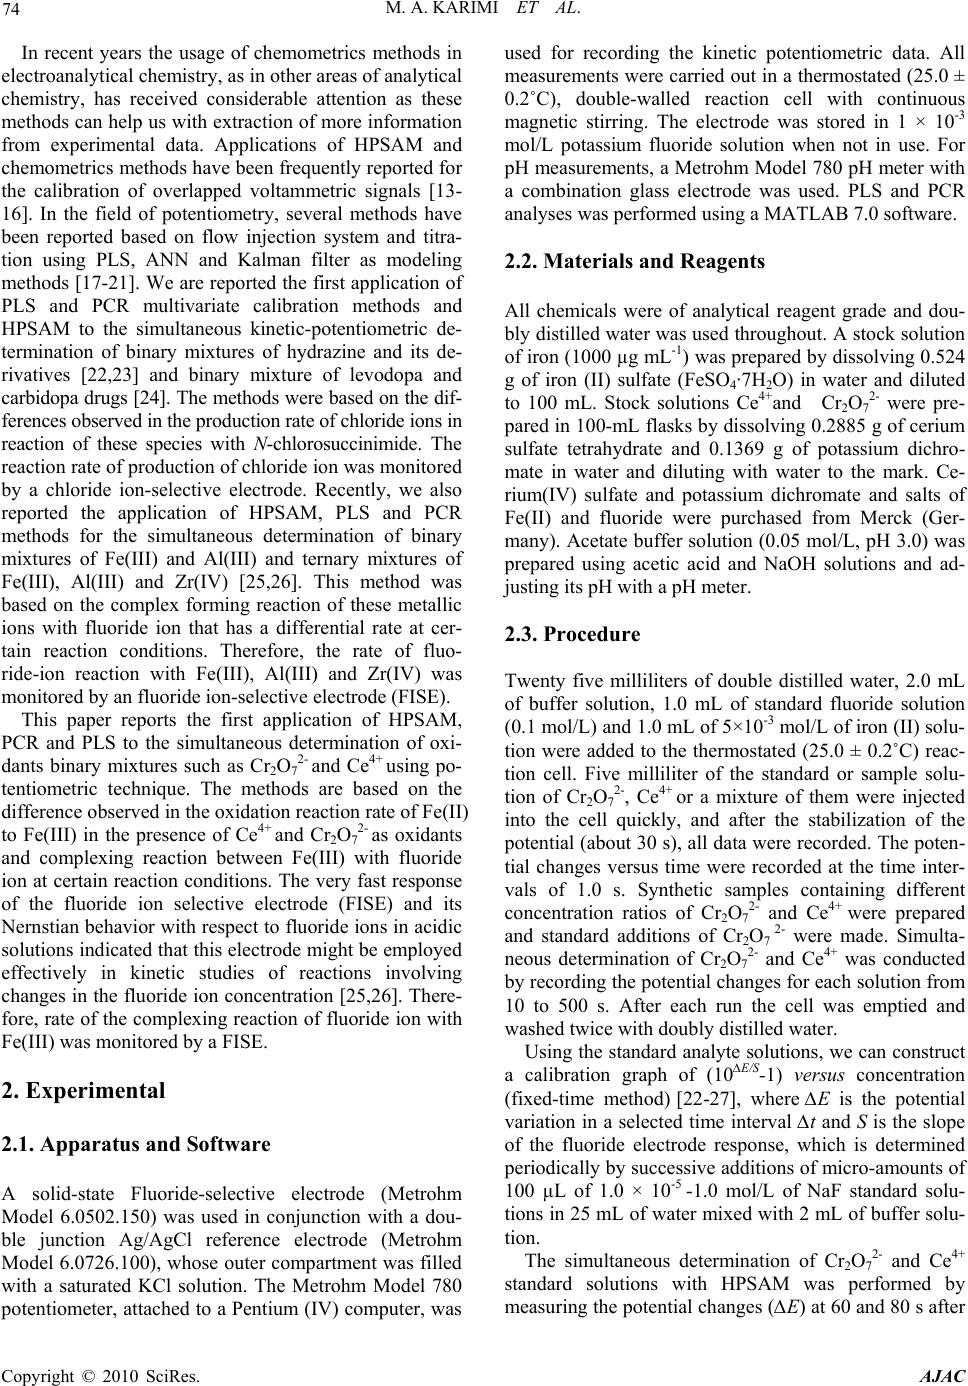 74 M. A. KARIMI ET AL. In recent years the usage of chemometrics methods in electroanalytical chemistry, as in other areas of analytical chemistry, has received considerable attention as these methods can help us with extraction of more information from experimental data. Applications of HPSAM and chemometrics methods have been frequently reported for the calibration of overlapped voltammetric signals [13- 16]. In the field of potentiometry, several methods have been reported based on flow injection system and titra- tion using PLS, ANN and Kalman filter as modeling methods [17-21]. We are reported the first application of PLS and PCR multivariate calibration methods and HPSAM to the simultaneous kinetic-potentiometric de- termination of binary mixtures of hydrazine and its de- rivatives [22,23] and binary mixture of levodopa and carbidopa drugs [24]. The methods were based on the dif- ferences observed in the production rate of chloride ions in reaction of these species with N-chlorosuccinimide. The reaction rate of production of chloride ion was monitored by a chloride ion-selective electrode. Recently, we also reported the application of HPSAM, PLS and PCR methods for the simultaneous determination of binary mixtures of Fe(III) and Al(III) and ternary mixtures of Fe(III), Al(III) and Zr(IV) [25,26]. This method was based on the complex forming reaction of these metallic ions with fluoride ion that has a differential rate at cer- tain reaction conditions. Therefore, the rate of fluo- ride-ion reaction with Fe(III), Al(III) and Zr(IV) was monitored by an fluoride ion-selective electrode (FISE). This paper reports the first application of HPSAM, PCR and PLS to the simultaneous determination of oxi- dants binary mixtures such as Cr2O72- and Ce4+ using po- tentiometric technique. The methods are based on the difference observed in the oxidation reaction rate of Fe(II) to Fe(III) in the presence of Ce4+ and Cr2O72- as oxidants and complexing reaction between Fe(III) with fluoride ion at certain reaction conditions. The very fast response of the fluoride ion selective electrode (FISE) and its Nernstian behavior with respect to fluoride ions in acidic solutions indicated that this electrode might be employed effectively in kinetic studies of reactions involving changes in the fluoride ion concentration [25,26]. There- fore, rate of the complexing reaction of fluoride ion with Fe(III) was monitored by a FISE. 2. Experimental 2.1. Apparatus and Software A solid-state Fluoride-selective electrode (Metrohm Model 6.0502.150) was used in conjunction with a dou- ble junction Ag/AgCl reference electrode (Metrohm Model 6.0726.100), whose outer compartment was filled with a saturated KCl solution. The Metrohm Model 780 potentiometer, attached to a Pentium (IV) computer, was used for recording the kinetic potentiometric data. All measurements were carried out in a thermostated (25.0 ± 0.2˚C), double-walled reaction cell with continuous magnetic stirring. The electrode was stored in 1 × 10⁻³ mol/L potassium fluoride solution when not in use. For pH measurements, a Metrohm Model 780 pH meter with a combination glass electrode was used. PLS and PCR analyses was performed using a MATLAB 7.0 software. 2.2. Materials and Reagents All chemicals were of analytical reagent grade and dou- bly distilled water was used throughout. A stock solution of iron (1000 µg mL-1) was prepared by dissolving 0.524 g of iron (II) sulfate (FeSO4·7H2O) in water and diluted to 100 mL. Stock solutions Ce4+and Cr2O72- were pre- pared in 100-mL flasks by dissolving 0.2885 g of cerium sulfate tetrahydrate and 0.1369 g of potassium dichro- mate in water and diluting with water to the mark. Ce- rium(IV) sulfate and potassium dichromate and salts of Fe(II) and fluoride were purchased from Merck (Ger- many). Acetate buffer solution (0.05 mol/L, pH 3.0) was prepared using acetic acid and NaOH solutions and ad- justing its pH with a pH meter. 2.3. Procedure Twenty five milliliters of double distilled water, 2.0 mL of buffer solution, 1.0 mL of standard fluoride solution (0.1 mol/L) and 1.0 mL of 5×10⁻³ mol/L of iron (II) solu- tion were added to the thermostated (25.0 ± 0.2˚C) reac- tion cell. Five milliliter of the standard or sample solu- tion of Cr2O72-, Ce4+ or a mixture of them were injected into the cell quickly, and after the stabilization of the potential (about 30 s), all data were recorded. The poten- tial changes versus time were recorded at the time inter- vals of 1.0 s. Synthetic samples containing different concentration ratios of Cr2O72- and Ce4+ were prepared and standard additions of Cr2O7 2- were made. Simulta- neous determination of Cr2O72- and Ce4+ was conducted by recording the potential changes for each solution from 10 to 500 s. After each run the cell was emptied and washed twice with doubly distilled water. Using the standard analyte solutions, we can construct a calibration graph of (10∆E/S-1) versus concentration (fixed-time method) [22-27], where ∆E is the potential variation in a selected time interval ∆t and S is the slope of the fluoride electrode response, which is determined periodically by successive additions of micro-amounts of 100 µL of 1.0 × 10⁻⁵ -1.0 mol/L of NaF standard solu- tions in 25 mL of water mixed with 2 mL of buffer solu- tion. The simultaneous determination of Cr2O72- and Ce4+ standard solutions with HPSAM was performed by measuring the potential changes (∆E) at 60 and 80 s after Copyright © 2010 SciRes. AJAC 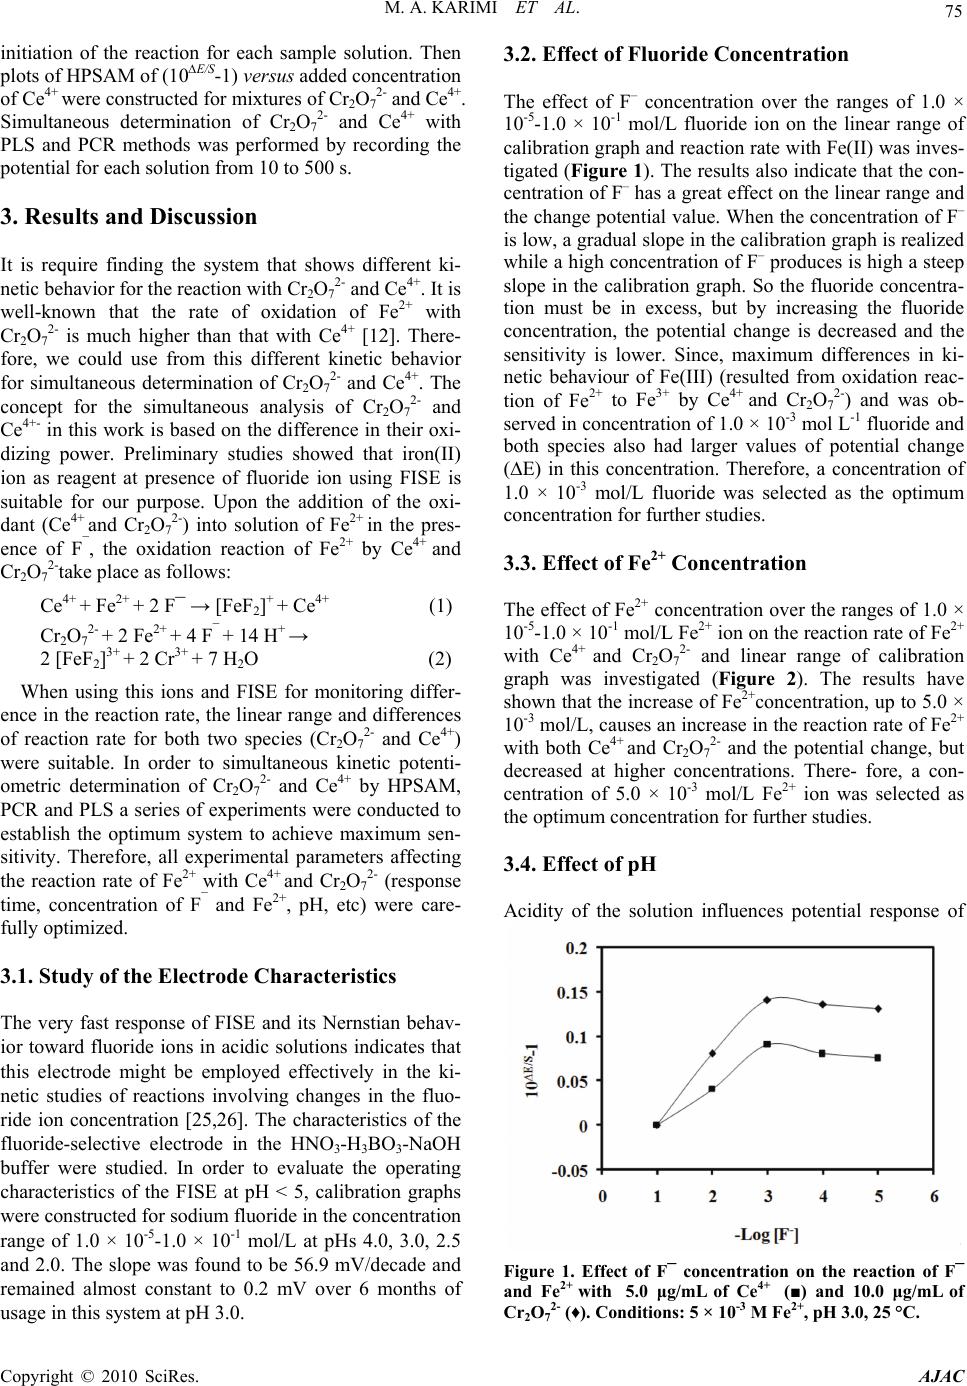 M. A. KARIMI ET AL. 75 initiation of the reaction for each sample solution. Then plots of HPSAM of (10∆E/S-1) versus added concentration of Ce4+ were constructed for mixtures of Cr2O72- and Ce4+. Simultaneous determination of Cr2O72- and Ce4+ with PLS and PCR methods was performed by recording the potential for each solution from 10 to 500 s. 3. Results and Discussion It is require finding the system that shows different ki- netic behavior for the reaction with Cr2O72- and Ce4+. It is well-known that the rate of oxidation of Fe2+ with Cr2O72- is much higher than that with Ce4+ [12]. There- fore, we could use from this different kinetic behavior for simultaneous determination of Cr2O72- and Ce4+. The concept for the simultaneous analysis of Cr2O72- and Ce4+- in this work is based on the difference in their oxi- dizing power. Preliminary studies showed that iron(II) ion as reagent at presence of fluoride ion using FISE is suitable for our purpose. Upon the addition of the oxi- dant (Ce4+ and Cr2O72-) into solution of Fe2+ in the pres- ence of F¯, the oxidation reaction of Fe2+ by Ce4+ and Cr2O72-take place as follows: Ce4+ + Fe2+ + 2 F¯ → [FeF2]+ + Ce4+ (1) Cr2O72- + 2 Fe2+ + 4 F¯ + 14 H+ → 2 [FeF2]3+ + 2 Cr3+ + 7 H2O (2) When using this ions and FISE for monitoring differ- ence in the reaction rate, the linear range and differences of reaction rate for both two species (Cr2O72- and Ce4+) were suitable. In order to simultaneous kinetic potenti- ometric determination of Cr2O72- and Ce4+ by HPSAM, PCR and PLS a series of experiments were conducted to establish the optimum system to achieve maximum sen- sitivity. Therefore, all experimental parameters affecting the reaction rate of Fe2+ with Ce4+ and Cr2O72- (response time, concentration of F¯ and Fe2+, pH, etc) were care- fully optimized. 3.1. Study of the Electrode Characteristics The very fast response of FISE and its Nernstian behav- ior toward fluoride ions in acidic solutions indicates that this electrode might be employed effectively in the ki- netic studies of reactions involving changes in the fluo- ride ion concentration [25,26]. The characteristics of the fluoride-selective electrode in the HNO3-H3BO3-NaOH buffer were studied. In order to evaluate the operating characteristics of the FISE at pH < 5, calibration graphs were constructed for sodium fluoride in the concentration range of 1.0 × 10⁻⁵-1.0 × 10⁻¹ mol/L at pHs 4.0, 3.0, 2.5 and 2.0. The slope was found to be 56.9 mV/decade and remained almost constant to 0.2 mV over 6 months of usage in this system at pH 3.0. 3.2. Effect of Fluoride Concentration The effect of F– concentration over the ranges of 1.0 × 10⁻⁵-1.0 × 10⁻¹ mol/L fluoride ion on the linear range of calibration graph and reaction rate with Fe(II) was inves- tigated (Figure 1). The results also indicate that the con- centration of F– has a great effect on the linear range and the change potential value. When the concentration of F– is low, a gradual slope in the calibration graph is realized while a high concentration of F– produces is high a steep slope in the calibration graph. So the fluoride concentra- tion must be in excess, but by increasing the fluoride concentration, the potential change is decreased and the sensitivity is lower. Since, maximum differences in ki- netic behaviour of Fe(III) (resulted from oxidation reac- tion of Fe2+ to Fe3+ by Ce4+ and Cr2O72-) and was ob- served in concentration of 1.0 × 10⁻³ mol L-1 fluoride and both species also had larger values of potential change (∆E) in this concentration. Therefore, a concentration of 1.0 × 10⁻³ mol/L fluoride was selected as the optimum concentration for further studies. 3.3. Effect of Fe2+ Concentration The effect of Fe2+ concentration over the ranges of 1.0 × 10⁻⁵-1.0 × 10⁻¹ mol/L Fe2+ ion on the reaction rate of Fe2+ with Ce4+ and Cr2O72- and linear range of calibration graph was investigated (Figure 2). The results have shown that the increase of Fe2+concentration, up to 5.0 × 10⁻³ mol/L, causes an increase in the reaction rate of Fe2+ with both Ce4+ and Cr2O72- and the potential change, but decreased at higher concentrations. There- fore, a con- centration of 5.0 × 10⁻³ mol/L Fe2+ ion was selected as the optimum concentration for further studies. 3.4. Effect of pH Acidity of the solution influences potential response of Figure 1. Effect of F¯ concentration on the reaction of F¯ and Fe2+ with 5.0 μg/mL of Ce4+ (■) and 10.0 μg/mL of Cr2O72- (♦). Conditions: 5 × 10⁻³ M Fe2+, pH 3.0, 25 °C. Copyright © 2010 SciRes. AJAC 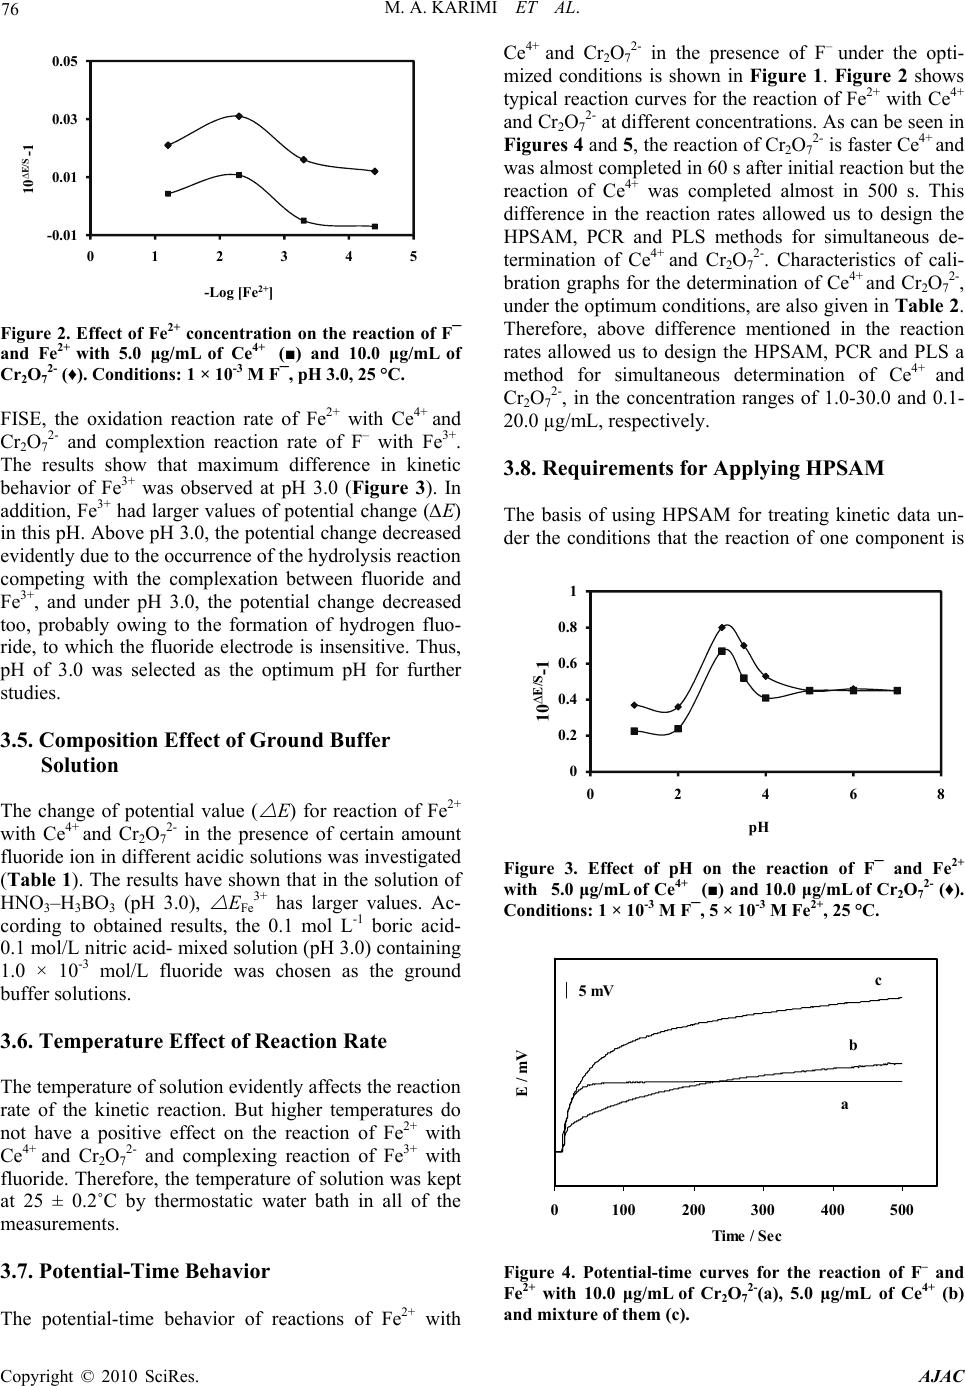 76 M. A. KARIMI ET AL. -0.01 0.01 0.03 0.05 012345 10 ∆E/S -1 -Log [Fe 2+ ] Figure 2. Effect of Fe2+ concentration on the reaction of F¯ and Fe2+ with 5.0 μg/mL of Ce4+ (■) and 10.0 μg/mL of Cr2O72- (♦). Conditions: 1 × 10⁻³ M F¯, pH 3.0, 25 °C. FISE, the oxidation reaction rate of Fe2+ with Ce4+ and Cr2O72- and complextion reaction rate of F– with Fe3+. The results show that maximum difference in kinetic behavior of Fe3+ was observed at pH 3.0 (Figure 3). In addition, Fe3+ had larger values of potential change (∆E) in this pH. Above pH 3.0, the potential change decreased evidently due to the occurrence of the hydrolysis reaction competing with the complexation between fluoride and Fe3+, and under pH 3.0, the potential change decreased too, probably owing to the formation of hydrogen fluo- ride, to which the fluoride electrode is insensitive. Thus, pH of 3.0 was selected as the optimum pH for further studies. 3.5. Composition Effect of Ground Buffer Solution The change of potential value ( E) for reaction of Fe2+ with Ce4+ and Cr2O72- in the presence of certain amount fluoride ion in different acidic solutions was investigated (Table 1). The results have shown that in the solution of HNO3–H3BO3 (pH 3.0), EFe3+ has larger values. Ac- cording to obtained results, the 0.1 mol L-1 boric acid- 0.1 mol/L nitric acid- mixed solution (pH 3.0) containing 1.0 × 10⁻³ mol/L fluoride was chosen as the ground buffer solutions. 3.6. Temperature Effect of Reaction Rate The temperature of solution evidently affects the reaction rate of the kinetic reaction. But higher temperatures do not have a positive effect on the reaction of Fe2+ with Ce4+ and Cr2O72- and complexing reaction of Fe3+ with fluoride. Therefore, the temperature of solution was kept at 25 ± 0.2˚C by thermostatic water bath in all of the measurements. 3.7. Potential-Time Behavior The potential-time behavior of reactions of Fe2+ with Ce4+ and Cr2O72- in the presence of F– under the opti- mized conditions is shown in Figure 1. Figure 2 shows typical reaction curves for the reaction of Fe2+ with Ce4+ and Cr2O72- at different concentrations. As can be seen in Figures 4 and 5, the reaction of Cr2O72- is faster Ce4+ and was almost completed in 60 s after initial reaction but the reaction of Ce4+ was completed almost in 500 s. This difference in the reaction rates allowed us to design the HPSAM, PCR and PLS methods for simultaneous de- termination of Ce4+ and Cr2O72-. Characteristics of cali- bration graphs for the determination of Ce4+ and Cr2O72-, under the optimum conditions, are also given in Table 2. Therefore, above difference mentioned in the reaction rates allowed us to design the HPSAM, PCR and PLS a method for simultaneous determination of Ce4+ and Cr2O72-, in the concentration ranges of 1.0-30.0 and 0.1- 20.0 µg/mL, respectively. 3.8. Requirements for Applying HPSAM The basis of using HPSAM for treating kinetic data un- der the conditions that the reaction of one component is 0 0.2 0.4 0.6 0.8 1 0246 10 ∆E/S -1 pH 8 Figure 3. Effect of pH on the reaction of F¯ and Fe2+ with 5.0 μg/mL of Ce4+ (■) and 10.0 μg/mL of Cr2O72- (♦). Conditions: 1 × 10⁻³ M F¯, 5 × 10⁻³ M Fe2+, 25 °C. 0100200 300400 500 Time / Sec E / m V a b c 5 mV Figure 4. Potential-time curves for the reaction of F– and Fe2+ with 10.0 μg/mL of Cr2O72-(a), 5.0 μg/mL of Ce4+ (b) and mixture of them (c). Copyright © 2010 SciRes. AJAC  M. A. KARIMI ET AL. 77 Table 1. The values of E for reaction of 10 µg/mL of Fe2+ with Ce(IV) and Cr2O72- in the presence of 1.0 × 10⁻³ M F– ion in different acid solutions (pH = 3.0). Acid solution H3PO4-H3BO3 KCl-HCl HNO3- CH3COOH HNO3-H3BO3 EFe3+ (for Cr2O72-)/mv 2.3 7.5 8.5 13.0 EFe3+ (for Ce4+/mv 1.8 5.5 6.7 10.4 Table 2. Characteristics of calibration graphs for the de- termination of Ce4+ and Cr2O72-. Species Linear range Slope Intercept Correlation coefficient Detection limit(a) (µg/mL) (mL/µg) (µg/mL) Ce4+ 1.0-30.0 0.0681 0.0177 0.9995 (n = 10) 0.450 Cr2O72- 0.1-20.0 0.1119 0.2975 0.9994 (n = 10) 0.086 (a) (b) Figure 5. Typical potential-time curves for the reaction of F- and Fe+2 with Ce4+(a) and Cr2O72- (b) at different con- centrations (μg/mL). completed, while that of other component is not com- pleted yet, is described below. In this case, the vari- ables to be fixed were the time variables t1 and t2, at which the product of the reaction of Ce4+ had the same amount of (10∆E/S-1) over the range between these two times, and also there is an appropriate difference between the slopes of the calibration lines. Considering a binary mixture of Ce4+ and Cr2O72-, for example, assume that the amount of R (10∆E/S-1) of the oxidation in the reaction of Fe2+ with Ce4+ and then com- plexation in the reaction of Fe3+ with F– at time variables t1 and t2 are Pi and Qi, respectively, while those for the Cr2O72--Fe2+-F– reaction under the same conditions are P and Q, respectively (Figure 6). They are equal in this case. The following equations show the relation between them: For Ce4+: Q i = Pi + mitj (t1 ≤ tj ≤ t2; i = 0,1,…, n) (1) For Cr2O72-: Q = P + mtj (m = 0) (2) where subscripts i and j denote different solutions for n additions of Ce4+ concentration prepared to apply to HPSAM and the time comprising the t1-t2 range, respec- tively. Thus, the overall amounts of (10∆E/S-1) (or R) of the Ce4+-Cr2O72- mixture are: At t1 Rt1 = P + Pi (3) At t2 Rt2 = Q + Qi (4) Simultaneous kinetic determination of concentration of Ce4+ and Cr2O72- by HPSAM requires the selection of two times t1 and t2. To select the appropriate times, the following principles were observed. At the two selected times t1 and t2, the amount of R of the Ce4+ must be linear with the concentrations, and the amount of R for Fe3+ must remain constant even if the Cr2O72- concentrations are changed. The amount of R for the mixture of Ce4+ and Cr2O72- should be equal to the sum of individual Rs of the two compounds. In addition, the slope difference of the two straight lines obtained at both t1 and t2 must be -0. 5 0.5 1.5 2.5 3.5 050100 150200 250 Time / Sec 10 ∆E / S -1 a t 1 c b Q i P i Q ′ P t 2 Q′+Q i P +P i Figure 6. Plot of potential changes (10∆E/S-1) for the reaction of F- and Fe2+ with 10.0 μg/mL of Ce4+ (a), 5.0 μg/mL of Cr2O72- (b) and mixture of them (c). Copyright © 2010 SciRes. AJAC 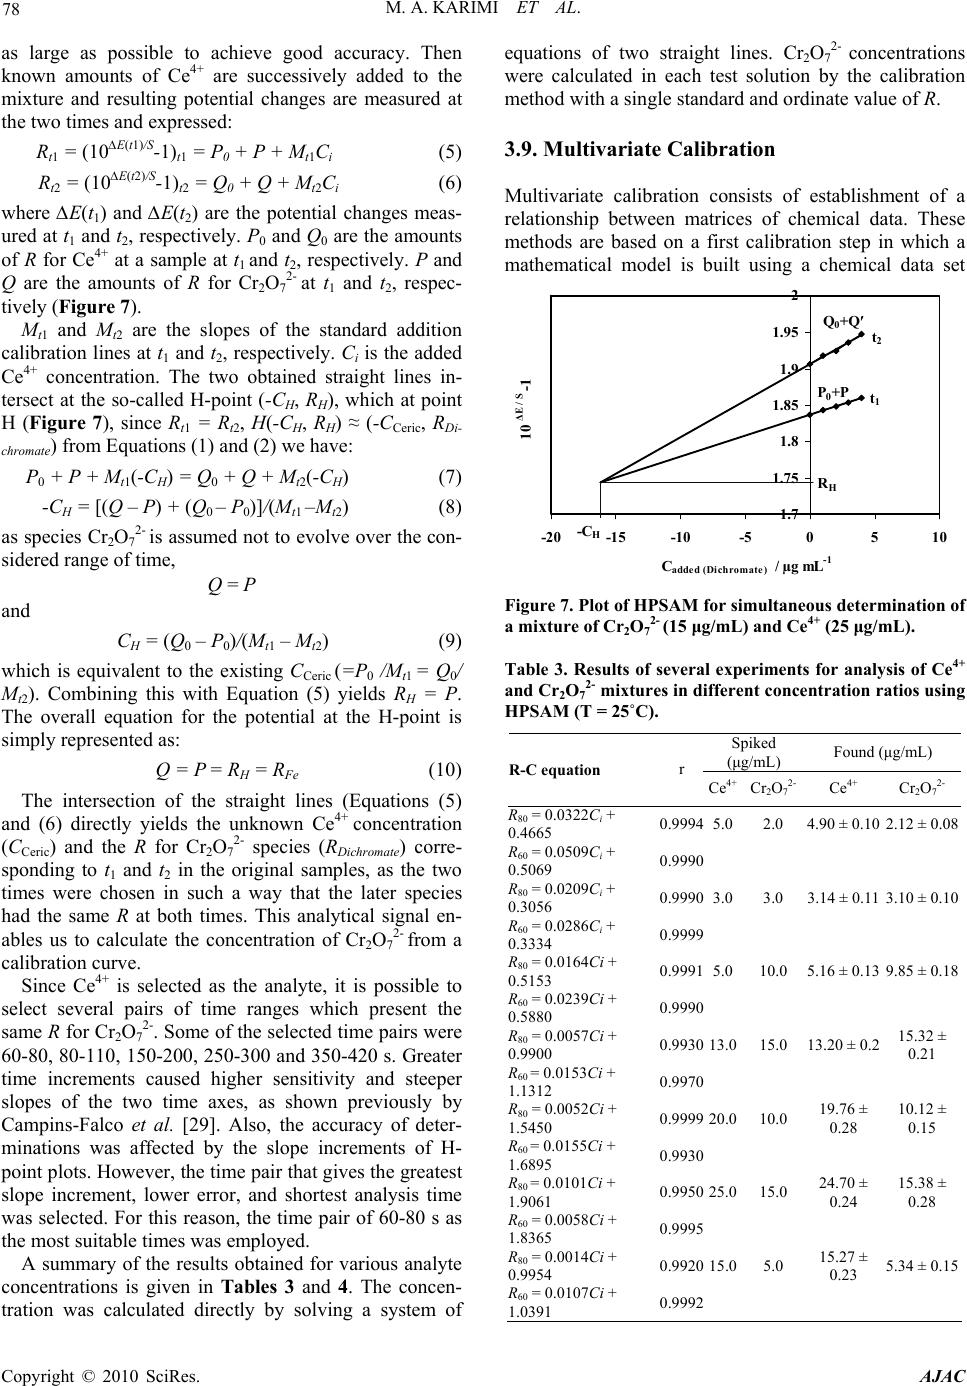 78 M. A. KARIMI ET AL. as large as possible to achieve good accuracy. Then known amounts of Ce4+ are successively added to the mixture and resulting potential changes are measured at the two times and expressed: Rt1 = (10∆E(t1)/S-1)t1 = P0 + P + Mt1Ci (5) Rt2 = (10∆E(t2)/S-1)t2 = Q0 + Q + Mt2Ci (6) where ∆E(t1) and ∆E(t2) are the potential changes meas- ured at t1 and t2, respectively. P0 and Q0 are the amounts of R for Ce4+ at a sample at t1 and t2, respectively. P and Q are the amounts of R for Cr2O72- at t1 and t2, respec- tively (Figure 7). Mt1 and Mt2 are the slopes of the standard addition calibration lines at t1 and t2, respectively. Ci is the added Ce4+ concentration. The two obtained straight lines in- tersect at the so-called H-point (-CH, RH), which at point H (Figure 7), since Rt1 = Rt2, H(-CH, RH) ≈ (-CCeric, RDi- chromate) from Equations (1) and (2) we have: P0 + P + Mt1(-CH) = Q0 + Q + Mt2(-CH) (7) -CH = [(Q – P) + (Q0 – P0)]/(Mt1 –Mt2) (8) as species Cr2O72- is assumed not to evolve over the con- sidered range of time, Q = P and CH = (Q0 – P0)/(Mt1 – Mt2) (9) which is equivalent to the existing CCeric (=P0 /Mt1 = Q0/ Mt2). Combining this with Equation (5) yields RH = P. The overall equation for the potential at the H-point is simply represented as: Q = P = RH = RFe (10) The intersection of the straight lines (Equations (5) and (6) directly yields the unknown Ce4+ concentration (CCeric) and the R for Cr2O72- species (RDichromate) corre- sponding to t1 and t2 in the original samples, as the two times were chosen in such a way that the later species had the same R at both times. This analytical signal en- ables us to calculate the concentration of Cr2O72- from a calibration curve. Since Ce4+ is selected as the analyte, it is possible to select several pairs of time ranges which present the same R for Cr2O72-. Some of the selected time pairs were 60-80, 80-110, 150-200, 250-300 and 350-420 s. Greater time increments caused higher sensitivity and steeper slopes of the two time axes, as shown previously by Campins-Falco et al. [29]. Also, the accuracy of deter- minations was affected by the slope increments of H- point plots. However, the time pair that gives the greatest slope increment, lower error, and shortest analysis time was selected. For this reason, the time pair of 60-80 s as the most suitable times was employed. A summary of the results obtained for various analyte concentrations is given in Tables 3 and 4. The concen- tration was calculated directly by solving a system of equations of two straight lines. Cr2O72- concentrations were calculated in each test solution by the calibration method with a single standard and ordinate value of R. 3.9. Multivariate Calibration Multivariate calibration consists of establishment of a relationship between matrices of chemical data. These methods are based on a first calibration step in which a mathematical model is built using a chemical data set 1.7 1.75 1.8 1.85 1.9 1.95 2 -20 -15 -10-50510 C added (Dichromate) / µg mL -1 10 ΔE / S -1 t 1 t 2 R H -C H Q 0 +Q′ P 0 +P Figure 7. Plot of HPSAM for simultaneous determination of a mixture of Cr2O72- (15 μg/mL) and Ce4+ (25 μg/mL). Table 3. Results of several experiments for analysis of Ce4+ and Cr2O72- mixtures in different concentration ratios using HPSAM (T = 25˚C). Spiked (μg/mL) Found (μg/mL) R-C equation r Ce4+ Cr2O72- Ce4+ Cr2O72- R80 = 0.0322Ci + 0.4665 0.99945.0 2.0 4.90 ± 0.102.12 ± 0.08 R60 = 0.0509Ci + 0.5069 0.9990 R80 = 0.0209Ci + 0.3056 0.99903.0 3.0 3.14 ± 0.113.10 ± 0.10 R60 = 0.0286Ci + 0.3334 0.9999 R80 = 0.0164Ci + 0.5153 0.99915.0 10.0 5.16 ± 0.139.85 ± 0.18 R60 = 0.0239Ci + 0.5880 0.9990 R80 = 0.0057Ci + 0.9900 0.993013.0 15.0 13.20 ± 0.215.32 ± 0.21 R60 = 0.0153Ci + 1.1312 0.9970 R80 = 0.0052Ci + 1.5450 0.999920.0 10.0 19.76 ± 0.28 10.12 ± 0.15 R60 = 0.0155Ci + 1.6895 0.9930 R80 = 0.0101Ci + 1.9061 0.995025.0 15.0 24.70 ± 0.24 15.38 ± 0.28 R60 = 0.0058Ci + 1.8365 0.9995 R80 = 0.0014Ci + 0.9954 0.992015.0 5.0 15.27 ± 0.23 5.34 ± 0.15 R60 = 0.0107Ci + 1.0391 0.9992 Copyright © 2010 SciRes. AJAC 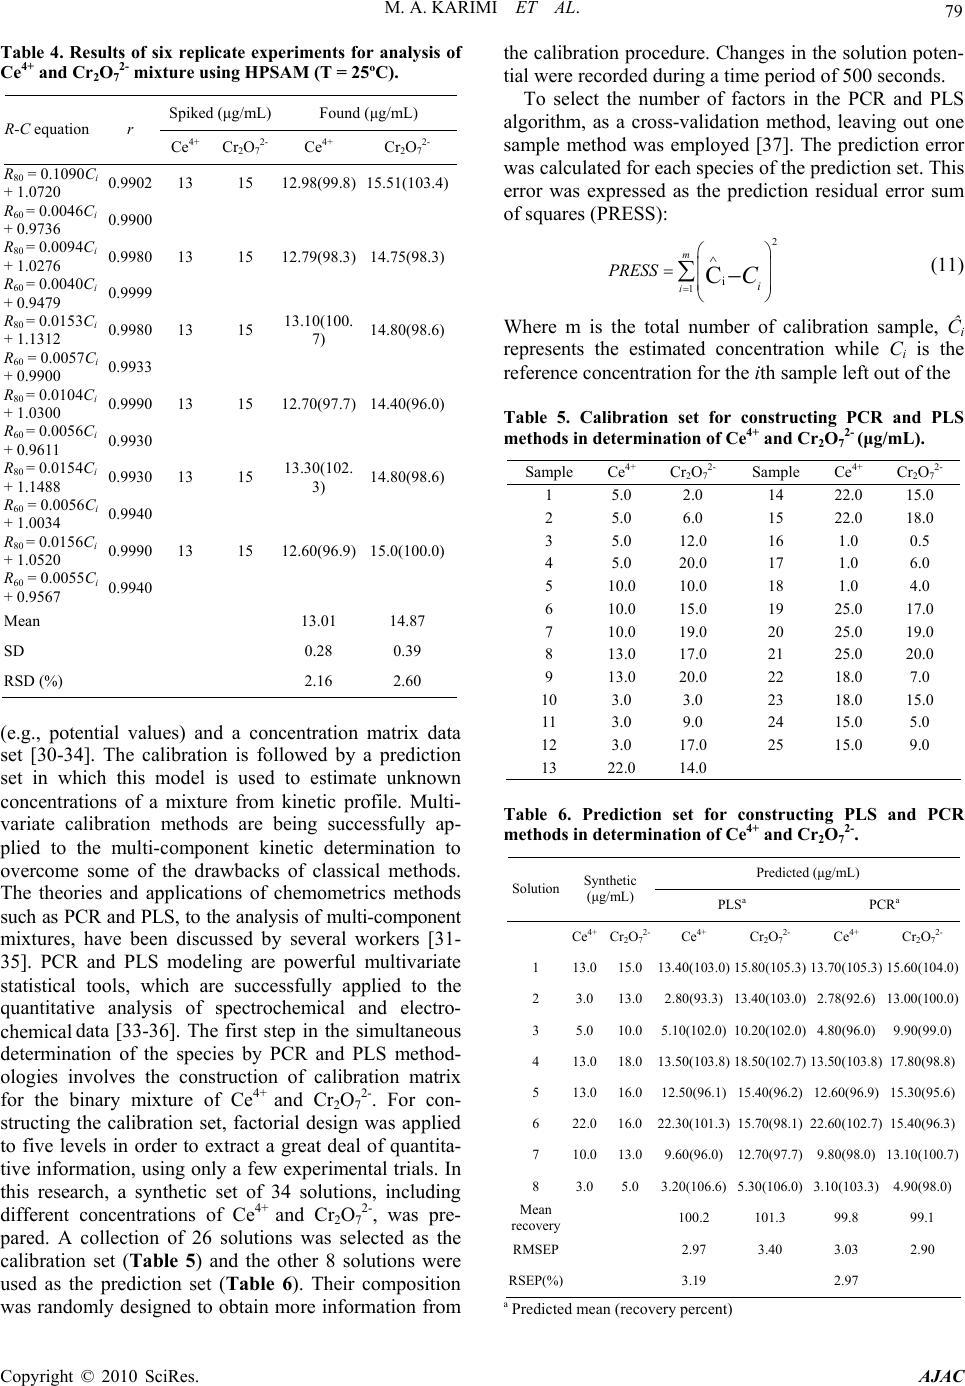 M. A. KARIMI ET AL. 79 Table 4. Results of six replicate experiments for analysis of Ce4+ and Cr2O72- mixture using HPSAM (T = 25ºC). Spiked (μg/mL) Found (μg/mL) R-C equation r Ce4+ Cr2O72- Ce4+ Cr2O72- R80 = 0.1090Ci + 1.0720 0.9902 13 15 12.98(99.8) 15.51(103.4) R60 = 0.0046Ci + 0.9736 0.9900 R80 = 0.0094Ci + 1.0276 0.9980 13 15 12.79(98.3) 14.75(98.3) R60 = 0.0040Ci + 0.9479 0.9999 R80 = 0.0153Ci + 1.1312 0.9980 13 15 13.10(100. 7) 14.80(98.6) R60 = 0.0057Ci + 0.9900 0.9933 R80 = 0.0104Ci + 1.0300 0.9990 13 15 12.70(97.7) 14.40(96.0) R60 = 0.0056Ci + 0.9611 0.9930 R80 = 0.0154Ci + 1.1488 0.9930 13 15 13.30(102. 3) 14.80(98.6) R60 = 0.0056Ci + 1.0034 0.9940 R80 = 0.0156Ci + 1.0520 0.9990 13 15 12.60(96.9) 15.0(100.0) R60 = 0.0055Ci + 0.9567 0.9940 Mean 13.01 14.87 SD 0.28 0.39 RSD (%) 2.16 2.60 (e.g., potential values) and a concentration matrix data set [30-34]. The calibration is followed by a prediction set in which this model is used to estimate unknown concentrations of a mixture from kinetic profile. Multi- variate calibration methods are being successfully ap- plied to the multi-component kinetic determination to overcome some of the drawbacks of classical methods. The theories and applications of chemometrics methods such as PCR and PLS, to the analysis of multi-component mixtures, have been discussed by several workers [31- 35]. PCR and PLS modeling are powerful multivariate statistical tools, which are successfully applied to the quantitative analysis of spectrochemical and electro- chemical data [33-36]. The first step in the simultaneous determination of the species by PCR and PLS method- ologies involves the construction of calibration matrix for the binary mixture of Ce4+ and Cr2O72-. For con- structing the calibration set, factorial design was applied to five levels in order to extract a great deal of quantita- tive information, using only a few experimental trials. In this research, a synthetic set of 34 solutions, including different concentrations of Ce4+ and Cr2O72-, was pre- pared. A collection of 26 solutions was selected as the calibration set (Table 5) and the other 8 solutions were used as the prediction set (Table 6). Their composition was randomly designed to obtain more information from the calibration procedure. Changes in the solution poten- tial were recorded during a time period of 500 seconds. To select the number of factors in the PCR and PLS algorithm, as a cross-validation method, leaving out one sample method was employed [37]. The prediction error was calculated for each species of the prediction set. This error was expressed as the prediction residual error sum of squares (PRESS): 2 1i C m ii PRESS C (11) Where m is the total number of calibration sample, Ĉi represents the estimated concentration while Ci is the reference concentration for the ith sample left out of the Table 5. Calibration set for constructing PCR and PLS methods in determination of Ce4+ and Cr2O72- (μg/mL). Sample Ce4+ Cr2O72- Sample Ce4+ Cr2O72- 1 5.0 2.0 14 22.0 15.0 2 5.0 6.0 15 22.0 18.0 3 5.0 12.0 16 1.0 0.5 4 5.0 20.0 17 1.0 6.0 5 10.0 10.0 18 1.0 4.0 6 10.0 15.0 19 25.0 17.0 7 10.0 19.0 20 25.0 19.0 8 13.0 17.0 21 25.0 20.0 9 13.0 20.0 22 18.0 7.0 10 3.0 3.0 23 18.0 15.0 11 3.0 9.0 24 15.0 5.0 12 3.0 17.0 25 15.0 9.0 13 22.0 14.0 Table 6. Prediction set for constructing PLS and PCR methods in determination of Ce4+ and Cr2O72-. Predicted (μg/mL) Solution Synthetic (μg/mL) PLSa PCRa Ce4+ Cr2O72- Ce4+ Cr2O72- Ce4+ Cr2O72- 1 13.015.013.40(103.0) 15.80(105.3) 13.70(105.3) 15.60(104.0) 2 3.013.02.80(93.3)13.40(103.0) 2.78(92.6)13.00(100.0) 3 5.010.05.10(102.0)10.20(102.0) 4.80(96.0)9.90(99.0) 4 13.018.013.50(103.8) 18.50(102.7) 13.50(103.8)17.80(98.8) 5 13.016.012.50(96.1)15.40(96.2) 12.60(96.9)15.30(95.6) 6 22.016.022.30(101.3) 15.70(98.1) 22.60(102.7)15.40(96.3) 7 10.013.09.60(96.0)12.70(97.7) 9.80(98.0)13.10(100.7) 8 3.05.0 3.20(106.6)5.30(106.0) 3.10(103.3)4.90(98.0) Mean recovery 100.2 101.3 99.8 99.1 RMSEP 2.97 3.40 3.03 2.90 RSEP(%) 3.19 2.97 a Predicted mean (recovery percent) Copyright © 2010 SciRes. AJAC  M. A. KARIMI ET AL. Copyright © 2010 SciRes. AJAC 80 Al3+, Fe3+, Zr4+, Ti4+ have a interference effect because complex forming reaction of these metallic ions with fluoride ion. The interference of iodide ion was also be- cause oxidation reaction with Ce4+ and Cr2O72- as oxi- dants. calibration during the cross validation. Figure 8 shows a plot of PRESS against the number of factors for a mix- ture of components. To find out minimum factors, we also used the F-statistics to carry out the significant de- termination [33]. The optimal number of factors, for the two components, was obtained as 2 for both PCR and PLS. 3.11. Application For evaluating the predictive ability of a multivariate calibration model, the root mean square error of predic- tion (RMSEP), relative standard error of prediction (RSEP) and squares of correlation coefficient (R2), which is an indication of the quality fit of all the date to a straight line, can be used as follows [33,37]: 1 22 1 / N ii i R MSEPC Cn (12) 1 22 2 00 11 / 100 NN ii i ii RSEPC CC (13) To evaluate the analytical applicability of the proposed methods (PCR, PLS and HPSAM), we spiked known amounts of both Ce4+ and Cr2O72- into some water sam- ples. The proposed methods were applied to determine analytes simultaneously and satisfactory results were obtained. The results are given in Table 8. The results show that the proposed methods could accurately deter- mine the concentration of these oxidants mixture under investigation in real water samples, and there is no sig- nificant difference between the results of PCR, PLS and HPSAM for their simultaneous determination. Table 7. Statistical parameters calculated for the prediction set using PLS and PCR models. 2 2 2 11 / NN ii ij RCC CC (14) RSEP (%) RMSEP R2 Component PLS PCRPLS PCR PLS PCR Ce4+ 2.97 3.03 0.35 0.36 0.9980 0.9990 Cr2O72- 3.40 2.90 0.64 0.40 0.9993 0.9988 where Ĉi represents the estimated concentration, Ci and n are the actual analyte concentration and the number of samples, respectively. Table 7 shows the values of RSEP, RMSEP and R2 for each component using PLS and PCR. It is shown that the obtained values, for the statistical parameters, are almost the same for both PLS and PCR methods. 0 500 1000 1500 2000 2500 0481216 Numbers of factors PRESS ♦PLS ■PCR 3.10. Interference Study The study of interference ions was performed by a stan- dard mixture solution containing 10.0 μg/mL of each Ce4+ and Cr2O72- and a certain amount of foreign ions. The following excesses of ions do not interfere (i.e., caused a relative error of less than 5%): more than a 1000-fold (largest amount tested) amount of K+, Zn2+, Cu2+, Bi3+, As3+, Cd2+, Mg2+, Be2+, Cl¯, NO3¯, BO33-, C2O42- a 100-fold amount of Mn2+, Ni2+, Co2+, pb2+, Cr3+, Ca2+; a 10-fold amount of SO42-, PO43-, Hg2+ and a 1-fold amount of Al3+, Fe3+, Zr4+, Ti4+, I¯. As was to be expected, Figure 8. Plot of PRESS against the numbers of factors PLS(♦)and PCR(■). Table 8. Simultaneous determination of Ce4+ and Cr2O72- in different water samples using HPSAM, PCR and PLS methods. Found (μg/mL) Sample Spiked (μg/mL) HPSAM PLS PCR Ce4+ Cr2O72- Ce4+ Cr2O72- Ce4+ Cr2O72- Ce4+ Cr2O72- 1 4.0 0.5 4.20 ± 0.12 0.51 ± 0.10 4.10 ± 0.11 0.46 ± 0.05 3.97 ± 0.20 0.48 ± 0.02 10.0 10.0 10.20 ± 0.24 10.40 ± 0.30 10.10 ± 0.22 9.88 ± 0.20 9.79 ± 0.14 9.90 ± 0.10 2 3.0 15.0 2.90 ± 0.06 15.40 ± 0.25 2.97 ± 0.05 14.80 ± 0.28 3.10 ± 0.10 15.20 ± 0.20 7.0 15.0 7.20 ± 0.21 15.30 ± 0.33 7.14 ± 0.18 14.88 ± 0.15 6.85 ± 0.13 14.90 ± 0.11 3 25.0 4.0 24.60 ± 0.36 4.10 ± 0.10 24.8 ± 0.33 3.88 ±0.09 25.4 ± 0.28 4.16 ± 0.15 18.0 20.0 17.80 ± 0.28 19.30 ± 0.20 17.65 ± 0.37 19.10 ± 0.12 18.20 ± 0.13 19.8 ± 0.21 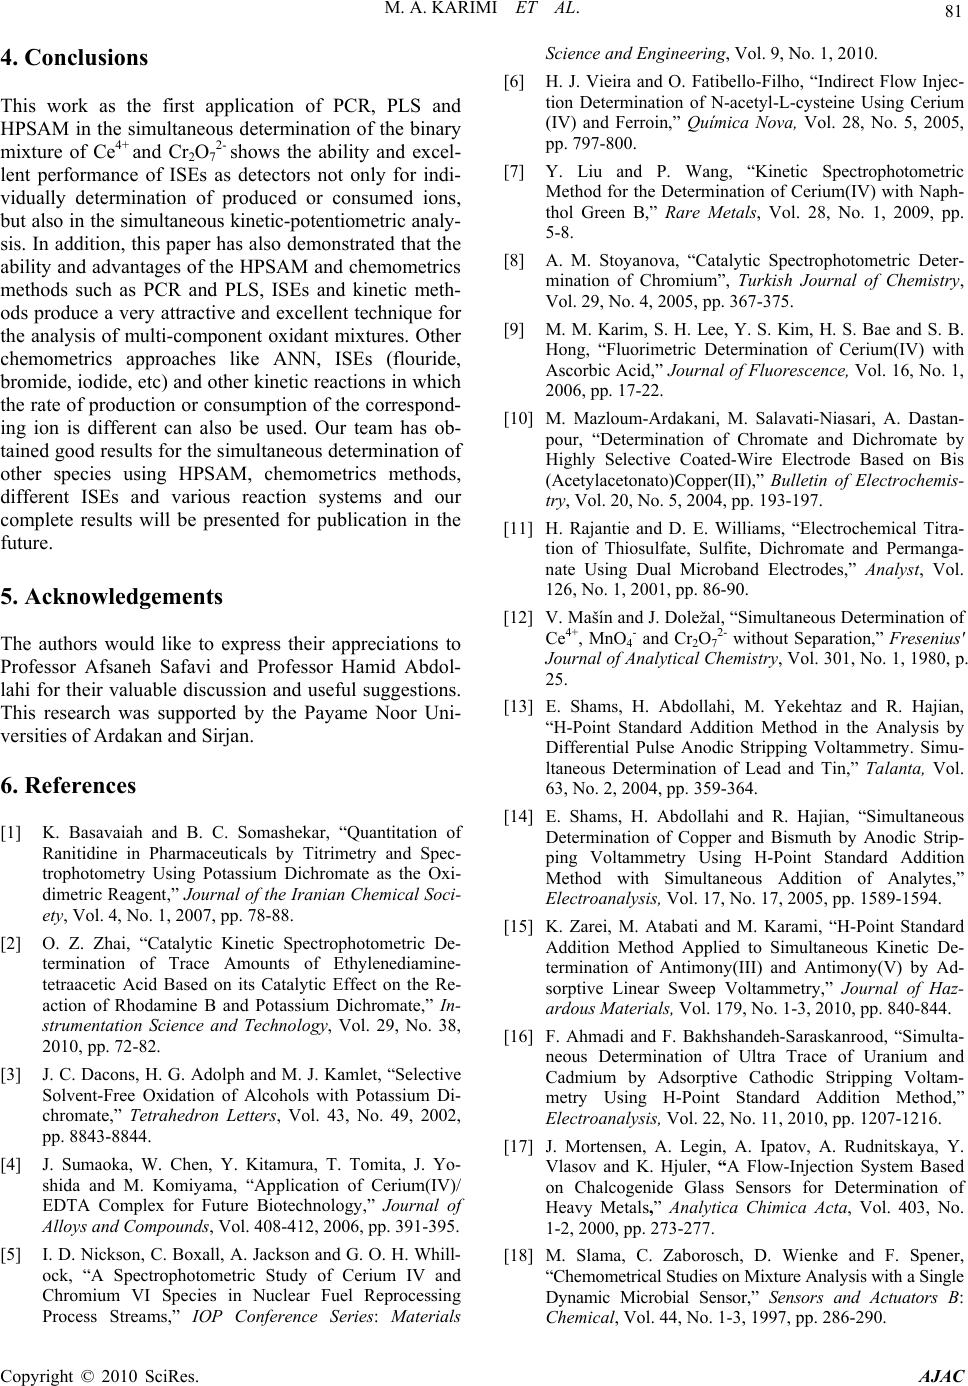 M. A. KARIMI ET AL. 81 4. Conclusions This work as the first application of PCR, PLS and HPSAM in the simultaneous determination of the binary mixture of Ce4+ and Cr2O72- shows the ability and excel- lent performance of ISEs as detectors not only for indi- vidually determination of produced or consumed ions, but also in the simultaneous kinetic-potentiometric analy- sis. In addition, this paper has also demonstrated that the ability and advantages of the HPSAM and chemometrics methods such as PCR and PLS, ISEs and kinetic meth- ods produce a very attractive and excellent technique for the analysis of multi-component oxidant mixtures. Other chemometrics approaches like ANN, ISEs (flouride, bromide, iodide, etc) and other kinetic reactions in which the rate of production or consumption of the correspond- ing ion is different can also be used. Our team has ob- tained good results for the simultaneous determination of other species using HPSAM, chemometrics methods, different ISEs and various reaction systems and our complete results will be presented for publication in the future. 5. Acknowledgements The authors would like to express their appreciations to Professor Afsaneh Safavi and Professor Hamid Abdol- lahi for their valuable discussion and useful suggestions. This research was supported by the Payame Noor Uni- versities of Ardakan and Sirjan. 6. References [1] K. Basavaiah and B. C. Somashekar, “Quantitation of Ranitidine in Pharmaceuticals by Titrimetry and Spec- trophotometry Using Potassium Dichromate as the Oxi- dimetric Reagent,” Journal of the Iranian Chemical Soci- ety, Vol. 4, No. 1, 2007, pp. 78-88. [2] O. Z. Zhai, “Catalytic Kinetic Spectrophotometric De- termination of Trace Amounts of Ethylenediamine- tetraacetic Acid Based on its Catalytic Effect on the Re- action of Rhodamine B and Potassium Dichromate,” In- strumentation Science and Technology, Vol. 29, No. 38, 2010, pp. 72-82. [3] J. C. Dacons, H. G. Adolph and M. J. Kamlet, “Selective Solvent-Free Oxidation of Alcohols with Potassium Di- chromate,” Tetrahedron Letters, Vol. 43, No. 49, 2002, pp. 8843-8844. [4] J. Sumaoka, W. Chen, Y. Kitamura, T. Tomita, J. Yo- shida and M. Komiyama, “Application of Cerium(IV)/ EDTA Complex for Future Biotechnology,” Journal of Alloys and Compounds, Vol. 408-412, 2006, pp. 391-395. [5] I. D. Nickson, C. Boxall, A. Jackson and G. O. H. Whill- ock, “A Spectrophotometric Study of Cerium IV and Chromium VI Species in Nuclear Fuel Reprocessing Process Streams,” IOP Conference Series: Materials Science and Engineering, Vol. 9, No. 1, 2010. [6] H. J. Vieira and O. Fatibello-Filho, “Indirect Flow Injec- tion Determination of N-acetyl-L-cysteine Using Cerium (IV) and Ferroin,” Química Nova, Vol. 28, No. 5, 2005, pp. 797-800. [7] Y. Liu and P. Wang, “Kinetic Spectrophotometric Method for the Determination of Cerium(IV) with Naph- thol Green B,” Rare Metals, Vol. 28, No. 1, 2009, pp. 5-8. [8] A. M. Stoyanova, “Catalytic Spectrophotometric Deter- mination of Chromium”, Turkish Journal of Chemistry, Vol. 29, No. 4, 2005, pp. 367-375. [9] M. M. Karim, S. H. Lee, Y. S. Kim, H. S. Bae and S. B. Hong, “Fluorimetric Determination of Cerium(IV) with Ascorbic Acid,” Journal of Fluorescence, Vol. 16, No. 1, 2006, pp. 17-22. [10] M. Mazloum-Ardakani, M. Salavati-Niasari, A. Dastan- pour, “Determination of Chromate and Dichromate by Highly Selective Coated-Wire Electrode Based on Bis (Acetylacetonato)Copper(II),” Bulletin of Electrochemis- try, Vol. 20, No. 5, 2004, pp. 193-197. [11] H. Rajantie and D. E. Williams, “Electrochemical Titra- tion of Thiosulfate, Sulfite, Dichromate and Permanga- nate Using Dual Microband Electrodes,” Analyst, Vol. 126, No. 1, 2001, pp. 86-90. [12] V. Mašín and J. Doležal, “Simultaneous Determination of Ce4+, MnO4- and Cr2O72- without Separation,” Fresenius' Journal of Analytical Chemistry, Vol. 301, No. 1, 1980, p. 25. [13] E. Shams, H. Abdollahi, M. Yekehtaz and R. Hajian, “H-Point Standard Addition Method in the Analysis by Differential Pulse Anodic Stripping Voltammetry. Simu- ltaneous Determination of Lead and Tin,” Talanta, Vol. 63, No. 2, 2004, pp. 359-364. [14] E. Shams, H. Abdollahi and R. Hajian, “Simultaneous Determination of Copper and Bismuth by Anodic Strip- ping Voltammetry Using H-Point Standard Addition Method with Simultaneous Addition of Analytes,” Electroanalysis, Vol. 17, No. 17, 2005, pp. 1589-1594. [15] K. Zarei, M. Atabati and M. Karami, “H-Point Standard Addition Method Applied to Simultaneous Kinetic De- termination of Antimony(III) and Antimony(V) by Ad- sorptive Linear Sweep Voltammetry,” Journal of Haz- ardous Materials, Vol. 179, No. 1-3, 2010, pp. 840-844. [16] F. Ahmadi and F. Bakhshandeh-Saraskanrood, “Simulta- neous Determination of Ultra Trace of Uranium and Cadmium by Adsorptive Cathodic Stripping Voltam- metry Using H-Point Standard Addition Method,” Electroanalysis, Vol. 22, No. 11, 2010, pp. 1207-1216. [17] J. Mortensen, A. Legin, A. Ipatov, A. Rudnitskaya, Y. Vlasov and K. Hjuler, “A Flow-Injection System Based on Chalcogenide Glass Sensors for Determination of Heavy Metals,” Analytica Chimica Acta, Vol. 403, No. 1-2, 2000, pp. 273-277. [18] M. Slama, C. Zaborosch, D. Wienke and F. Spener, “Chemometrical Studies on Mixture Analysis with a Single Dynamic Microbial Sensor,” Sensors and Actuators B: Chemical, Vol. 44, No. 1-3, 1997, pp. 286-290. Copyright © 2010 SciRes. AJAC  82 -808. M. A. KARIMI ET AL. [19] N. Garcia-Villar, J. Saurina and S. Hernández-Cassou, “Flow Injection Differential Potentiometric Determina- tion of Lysine by Using a Lysine Biosensor,” Analytica Chimica Acta, Vol. 477, No. 2, 2003, pp. 315-324. [20] M. Akhond, J. Tashkhourian and B. Hemmateenejad, “Simultaneous Determination of Ascorbic, Citric and Tartaric Acids by Potentiometric Titration with PLS Calibration,” Journal of Analytical Chemistry, Vol. 61, No. 8, 2006, pp. 804 [21] Y. Z. Ye and Y. Luo, “Kinetic Potentiometry Simultane- ous Determination of Iron(III) and Zirconium(IV) by Us- ing the Kalman Filter,” Laboratory Robotics and Auto- mation, Vol. 10, No. 5, 1998, pp. 283-287. [22] M. A. Karimi, M. Mazloum-Ardakani, H. Abdollahi and F. Banifatemeh, “Application of H-Point Standard Addi- tion Method and Partial Least Squares to the Simultane- ous Kinetic-Potentiometric Determination of Hydrazine and Phenylhydrazine,” Analytical Science, Vol. 24, No. 2, 2008, pp. 261-266. [23] M. A. Karimi, H. Abdollahi, H. Karami and F. Banifate- meh, “Simultaneous Kinetic-Potentiometric Determina- tion of Hydrazine and Thiosemicarbazide by Partial Least Squares and Principle Component Regression Methods,” Journal of the Chinese Chemical Society, Vol. 55, No. 1, 2008, pp. 129-136. [24] M. A. Karimi, M. H. Mashhadizadeh, M. Mazloum- Ardakani and N. Sahraei, “Simultaneous Kinetic-Potentio- metric Determination of Levedopa and Carbidopa Using Multivariate Calibration Methods”, Journal of Food and Drug Analysis, Vol. 16, No. 5, 2008, pp. 39-47. [25] M. A. Karimi, M. Mazloum Ardakani, R. Behjatmanesh Ardakani and M. R. Zand Monfared, “Simultaneous Ki- netic-Potentiometric Determination of Fe3+ and Al3+ Us- ing H-point Standard Addition and Partial Least Squares Methods,” Chemical Analysis (Warsaw), Vol. 54, No. 6, 2009, pp. 1321-1337. [26] M. A. Karimi, M. Mazloum-Ardakani, R. Behjatmanes Ardakani, M. H. Mashhadizadeh, M. R. Zand Monfared and M. Tadayon, “Chemometrics-Assisted Kinetic-Poten- tiometric Methods for Simultaneous Determination of Fe(III), Al(III), and Zr(IV) Using a Fluoride Ion-Selective Electrode,” Journal of AOAC International, Vol. 93, No. 1, 2010, p. 327. [27] E. Athanasiou-Malaki, M. A. Koupparis and T.P. Had- jiioannou, “Kinetic-Potentiometric Study and Analytical Applications of Micellar-Catalysed Reactions of 1- Fluoro- 2,4-Dinitrobenzene with Amino Compounds,” Analytica Chimica Acta, Vol. 219, No. 2, 1989, pp. 295-307. [28] K. Srinivasan and G. A. Rechnitz, “Activity Measurements with a Fluoride-Selective Membrane Electrode,” Analyti- cal Chemistry, Vol. 40, No. 3, 1968, pp. 509-512. [29] F. Bosch-Reig, P. Campins-Falco, A. Sevillano-Cabeza, R. Herraez-Hernandez and C. Molins-Legua, “Development of the H-Point Standard Additions Method for Ultravio- let-Visible Spectroscopic Kinetic Analysis of Two- Component Systems,” Analytical Chemistry, Vol. 63, No. 21, 1991, pp. 2424-2429. [30] M. Bahram, K. Farhadi, A. Afkhami, D. Shokatynia and F. Arjmand, “Simultaneous Kinetic Spectrophotometric Determination of Cu(II), Co(II) and Ni(II) Using Partial Least Squares (PLS) Regression,” Central European Journal of Chemistry, Vol. 7, No. 3, 2009, pp. 375-381. [31] M.A. Karimi, M. Mazloum-Ardakani, R. Behjatmanesh- Ardakani, M. H. Mashhadizadeh and N. Zarea Zadeh, “Application of H-Point Standard Addition Method and Multivariate Calibration Methods to the Simultaneous Kinetic-Potentiometric Determination of Hydrogen Per- oxide and Peracetic Acid,” Analytical & Bioanalytical Electrochemistry, Vol. 1, No. 3, 2009, pp. 142-158. [32] M. Chamsaz, A. Safavi and J. Fadaee, “Simultaneous Kinetic-Spectrophotometric Determination of Carbidopa, Levodopa and Methyldopa in the Presence of Citrate with the Aid of Multivariate Calibration and Artificial Neural Networks,” Analytica Chimica Acta, Vol. 603, No. 2, 2007, pp. 140-146. [33] M. Otto and W. Wegscheider, “Spectrophotometric Mul- ticomponent Analysis Applied to Trace Metal,” Analyti- cal Chemistry, Vol. 57, No. 1, 1985, pp. 63-69. [34] M. A. Karimi, M. Mazloum-Ardakani, R. Behjatmaneh- Ardakani, M. R. Hormozi Nezhad and H. Amiryan, “In- dividual and Simultaneous Determinations of Phenothi- azine Drugs Using PCR, PLS and (OSC)–PLS Multivari- ate Calibration Methods,” Journal of the Serbian Chemi- cal Society, Vol. 72, No. 2, 2008, pp. 233-247. [35] M. A. Karimi, M. Mazloum-Ardakani, O. Moradlou, R. Behjatmanesh-Ardakani and F. Banifatemeh, “Simulta- neous Kinetic-Spectrophotometric Determination of Hy- drazine and its Derivatives by Partial Least Squares and Principle Component Regression Methods,” Journal of the Chinese Chemical Society, Vol. 54, No. 1, 2007, pp. 15-21. [36] D. M. Haaland and E. V. Thomas, “Partial Least-Squares Methods for Spectral Analyses. 1. Relation to other Quantitative Calibration Methods and the Extraction of Qualitative Information,” Analytical Chemistry, Vol. 60, No. 11, 1988, pp. 1193-1202. [37] M. A. Karimi, M. Mazloum-Ardakani, M. H. Mashhadi- zadeh and F. Banifatemeh, “Simultaneous Kinetic Spec- trophotometric Determination of Hydrazine and Isoniazid Using H-Point Standard Addition Method and Partial Least Squares Regression in Micellar Media,” Croatica Chemica Acta, Vol. 84, No. 4, 2009, pp. 729-738. Copyright © 2010 SciRes. AJAC |

